J Wood Sci (1999) 45:24-29 © The Japan Wood Research Society 1999 O R I G I N A L A R T I C L E
H i r o s h i Y o s h i h a r a • H i s a s h i O h s a k i • Y o s h i t a k a K u b o j i m a M a s a m i t s u O h t a
Applicability of the Iosipescu shear test on the measurement of the shear
properties of wood
Received: September 3, 1997 / Accepted: August 29, 1998
A b s t r a c t We examined the applicability of the Iosipescu shear test for measuring the shear properties of wood. Quarter-sawn board of sitka spruce (Picea sitchensis Carr.) and shioji (Japanese ash, Fraxinus spaethiana Lingelsh.) were used for the specimens. Iosipescu shear tests were conducted with two types of specimen whose longitudinal and radial directions coincided with the loading direction. The shear modulus, yield shear stress, and shear strength were obtained and were compared with those obtained by the torsion tests of rectangular bars. The results are summa- rized as follows: (1) The Iosipescu shear test is effective in measuring the shear modulus and the yield shear stress. (2) To measure the shear strength properly by the Iosipescu shear test, the configuration of specimen and the supporting condition should be examined in more in detail.
Key words Iosipescu shear test - Shear modulus • Yield shear stress • Shear strength
Introduction
There are many methods for obtaining the shear properties of materials. The torsion test and the 45 ° off-axis tension or compression test are the most popular methods. <2 Using
H. Yoshihara ([])
Faculty of Science and Engineering, Shimane University, Matsue, 690-8504, Japan
Tel. +81-852-32-6508; Fax +81-852-32-6123 e-mail: yosihara@riko.shimane-u.ac.jp H. Ohsaki
Hokkaido Forest Products Research Institute, Asahikawa 071-0198, Japan
Y. Kubojima
Forestry and Forest Products Research Institute, Tsukuba 305-8687, Japan
M. Ohta
Graduate School of Agricultural and Life Sciences, The University of Tokyo, Tokyo 113-8657, Japan
these methods, we can obtain the shear modulus properly. Nevertheless, it is difficult to discuss the validity of the shear stress/shear strain relation in the plastic region using the shear moduli obtained by these methods. In a previous paper, we proposed an equation for predicting the shear stress/shear strain relation from the torsion test result. 3 The torsion test, however, is not a direct method for obtaining the shear stress/shear strain relation in the plastic region. In the 45 ° off-axis test, the normal stress components always occur in the material as does the shear stress, and it is difficult to obtain the pure shear stress/shear strain condi- tion. Thus, we believe that it is difficult to obtain the yield stress and shear strength by these methods.
As for wood, the shear test method is standardized by the Japan Industrial Standard (JIS) as in JIS Z-2101. It is widely known that the shear properties obtained by this method are apparent because the uniform shear stress con- dition cannot be expected in the specimen, and that the real shear properties cannot be obtained by this method. De- spite this drawback, the standard JIS shear test has been conventionally undertaken to measure the shear strength of wood. On various occasions we need to obtain the pure shear properties of wood properly. From this viewpoint, however, the conventional JIS test is insufficient. Therefore, we believe that a shear test method that can evaluate the real shear properties of wood should be standardized as quickly as possible.
Theory
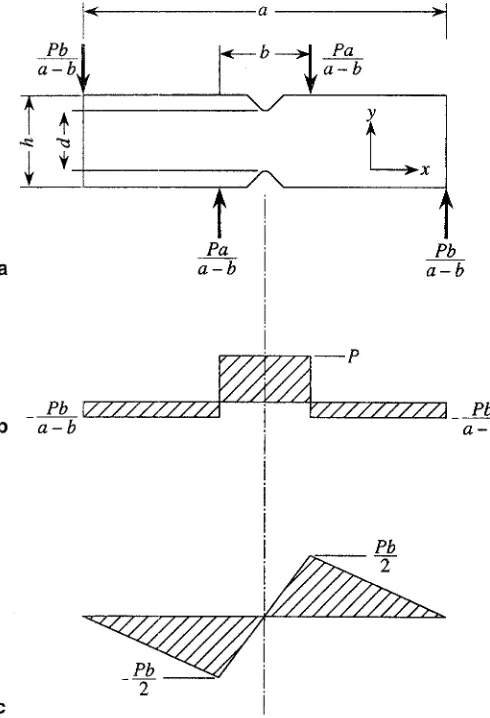
Figure 1 diagrams the Iosipescu shear test specimen. The x- and y-axes are defined as those parallel and perpendicular, respectively, to the long axis of the specimen. When the specimen is loaded asymmetrically as in Fig. la, an almost uniform shear stress condition is thought to be obtained at the midlength of the specimen except in the region near the notches. With this loading condition the shearing force equals P in the middle section of the specimen (Fig. lb), whereas the bending moment is equal to zero in the same section (Fig. lc). The validity of this hypothesis has been variously examined by finite element analyses. 64
As stated, the shearing force P applies on the region between the notches. Thus, the shear modulus Gx~ can be measured by obtaining the following equation:
AP
Gxy - (1)
tdATxy
where t is the thickness of the specimen, d is the distance between the notches, and 7xy is the engineering shear strain at the midpoint of the notches.
Shear yield stress, Y.w and shear strength, Fxy, are given, respectively, as follows:
Ey-Py
td
(2)
and
F~y-
Pf
(3)
td
where Py and P~ are the vertical loads at the occurrence of
yielding and failure, respectively.
Experiment
Materials
Sitka spruce (Picea sitchensis Carr.) and shioji (Japanese ash, Fraxinus spaethiana Lingelsh.) were used for the speci- mens. The density of spruce was 0.43g/cm 3, whereas that of shioji was 0.59g/cm 3. Specimens were conditioned at 20°C and 65% relative humidity (RH) before and during the tests.
a
b
Pb a - b
Pb a - b
{< a •
~ b >j. Pa ¥ a - b
/ ~
l >x
Pb a - b
t
Pa a - b
~ / / / / / / / / ~ / ~ / / ~ / / / / / / A _ _ _ _
Pb
P
Pb a - b
Iosipescu shear tests
The Iosipescu shear testing method is standardized for FRP in the American Society for Testing Materials (ASTM) D- 5379. However, it is difficult to fabricate the specimen in accordance with the standard because the specimen size defined in the standard is small. Hence, we determined the dimensions of the specimen as Fig. 2. The shape of the specimen is approximately proportional to that of ASTM standard.
Here, we measured the shear properties on the longitudinal-radial (LR) plane, and two types of specimens were prepared. In one type, the radial direction coincided with the long axis of the specimen, whereas the longit- udinal direction coincided with it in the other one. We defined these types as "RL-specimen" and "LR-specimen," respectively.
o
r¢3
• 1 2 0
y
V
I
Biaxial strain gage
R = 2
Thickness = 8 mm Fig. I. a Applied force, b shearing force, and c bending moment dia-
26
To measure the strain condition between the opposed notches, triaxial-strain gauges (gauge length 2 mm; YFRA- 2-11, Tokyo Sokki Co., Tokyo) were bonded on the oppo- site surfaces at the midpoint between the notches. Figure 3 shows the triaxial-gauge arrangement. The shear strain Yxy was obtained from the following equation
Yv = 2era - q - 811 ( 4 )
where 8i, 8n, and elu are the strains in the directions of axes I, II, and III, respectively, shown in Fig. 3.
Figure 4 diagrams the test fixture, which was the same type developed at the University of Idaho (named "Idaho fixture"), 9 and the setting of the specimen. As in Fig. 4, the loading surfaces began at points 22 and 12 mm away from the center of the test specimen. The vertical load of l m m / min loading velocity was applied to the specimen, and the load-strain relations were recorded by a XY-recorder. The shear modulus was obtained from the initial linear seg- ment of shear stress/shear strain curve. The plastic shear strain component, vPv, was then separated by the following equation:
'~ p ~xy
y. : ) % - - - ( 5 )
G,
where
Gy
is the shear stress. The shear stress/plastic shear strain relationship was formulated by Ludwik's power func- tion represented as follows~°:rx, = Yxy + a(r p,)~
(6)
where a and n are the parameters. The yield shear stress
Yv
was calculated as that where
YPxy
= 0. The shear strength was determined by substituting the maximum load into Pf of Eq. (3).The shear modulus, yield shear stress, and shear strength obtained from the RL-specimen are denoted as GRL, YRL, and FRL, respectively, whereas those obtained from the LR- specimen are as GLR, YLR, and FLR, respectively. Eight speci- mens were used for one test condition.
Torsion tests
Independently of the Iosipescu shear tests, torsion tests were conducted to measure the shear modulus and yield shear stress. The obtained values were compared with those derived by the Iosipescu shear tests.
Figure 5 shows the shape of the torsion test specimen. To measure the strains at the centers of the side surfaces, the same strain gauges used in the Iosipescu shear tests were bonded on the LR and LT planes. The specimen was twisted by a manual torsion-test device, and the torsional moment/strains relations were obtained. The strain compo- nents were transformed into the shear strain by Eq. (4), and the shear moduli on the LR and LT planes were calculated by the following equations]
GL R -- kLR
.V__ ~
J~GLRLR
+
(--1) 'I-1
|
7"C2 11G~ ( G : ~
2 '
a2bk
L ~ LT n : ltanh (2n - 1)zrb /G/~LR 1
CLTI
(7)
I 8 ~ 1 GLT
__ aebkkLT
1 - 7 Y ( 2 n , i-i - 1) 5c o s h ( 2 n -
1)~b
IGL~ R ]1]
7a
Load P
portion of fixture
/
Axis III 45=.{ ~ J
Axis II 42 "'"'" i
Y II
l Strain gage L ( R )
~--~R (L)
Specimen
adjusting screw le wedge to Le specimen
uide rod
mrtion of fixture
Fig.
3. Triaxial strain gauge arrangement. L, R, longitudinal and radialwhere a and b are the lengths in the radial and tangential directions, respectively; kcR and kLx are the initial inclina- tion of the torsional moment/shear strains on the LR and LT planes relations, respectively; and k is
k _ 1 2a [GLT ( 2"~5@, - - I - - - - , ~ - -- 1
- 1)a'b 1 / ~ tanh (2n 2 a
Yield shear stress, YLR, was calculated by the following equation:
I ~ - \n 1
YLR
--My
S GLR .a /--1)
tanh (2n - 1)z& ;GLR q
where My is the torsional moment at the occurrence of yielding. The value of My was determined by formulating the torsional moment/plastic shear strain relation on the LR plane into the Ludwik's power function similar to Eq. (6).
On the other hand, the shear strength cannot be pre- dicted by the torsion test without considering the shear stress/shear strain relation, which cannot be obtained di- rectly by the torsion test. Hence, we thought that the valid- ity of the shear strength predicted by the torsion test should be examined in detail. The comparison of the shear stress/ shear strain relations and the shear strengths obtained from
L
/
T
the Iosipescu and torsion tests will be mentioned in a suc- ceeding paper.
Results and discussion
(8) Figure 6 shows the typical pattens of the shear stress/shear strain relations obtained from the Iosipescu shear tests. The shear stress/shear strain behaviors obtained from the two specimens were similar before the occurrence of failure in the R L specimen. The failure occurred suddenly in the RL-specimen, whereas it occurred rather gradually in the LR-specimen.
Table 1 shows the shear moduli obtained from the Iosipescu shear tests and the torsion tests. The values of shear moduli were similar for the two specimens and coin- (9) cided with those obtained by the torsion tests.
The yield shear stress obtained from the Iosipescu shear tests and the torsion tests are shown in Table 2. The yield stresses obtained by the RL- and LR-specimens of the Iosipescu shear tests coincided with each other, but these values were smaller than those attained by the torsion tests.
> R
Fig. 5. Torsion test specimen (units: millimeters). T, tangential direction
15
10
o 5
I f / '
/ /
A s h
0 I I I
0 10000 20000 30000 40000 Shear strain (x 10-6)
Fig. 6. Typical patterns of the shear stress/shear strain relations ob- tained from the Iosipescu shear tests. Solid and dashed lines were obtained from the shear tests of RL and LR specimens, respectively
Table 1. Shear moduli obtained by the Iosipescu shear tests and tor- sion tests
Species Iosipescu (GPa) Torsion: GLR (GPa)
GRL GLR
28
In a previous paper, we pointed out that the yield stress determined by the torsion test tends to be about 30% larger than the real value. ~ Considering this phenomenon, we thought that the yield shear stresses were measured appro- priately by the Iosipescu shear tests.
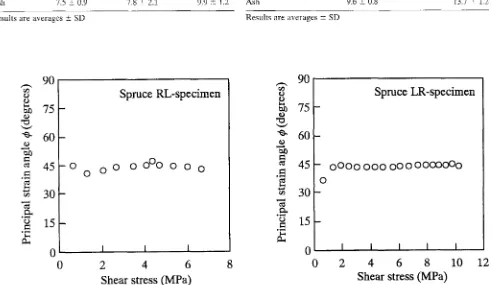
Figure 7 shows the typical patterns of the principal strain angle ~ during the loading process in the Iosipescu shear test. The value of q~ is calculated from the following equation. 12
q ~ = l t a n l ( Yv / 2 k, e1 - e i i j
(io)
When the pure shear stress condition, ~O should be 45 °. From the finite element calculations by Kumosa and Hull, the principal stress angle deviates from 45 ° when the speci- men has a large orthotropy. 8 From the experimental results, however, the principal strain angle was about 45 ° for both types. Hence, the pure shear stress condition occurs in
the region where the strain gauges were bonded. Thus, we thought that the Iosipescu shear test effectively measures the shear modulus and yield shear stress.
Table 3 shows the shear strengths obtained from the RL- and LR-specimens. This table shows that the shear strength
of the RL-specimen, FRL was smaller than that of the LR- specimen, FLa. Figure 6 also indicates this phenomenon. The fractures in the RL-specimen were initiated at the op- posed points of the longer supporting edges because of the maximum tensile stresses, which can be predicted by the bending moment diagram shown as in Fig. lc; and they propagated along the grain, as shown in Fig. 8a. The load reached its maximum at this fracture initiation before the catastrophic failure occurred between the notch. Hence, the values of FRL shown in Table 3 are not regarded as the shear strengths. Even if the shape of the RL-specimen is modified, fractures would be initiated at the notch roots, where the pure shear stress condition cannot be expected, and would propagate along the grain immediately. Therefore, we be- lieve that the shear strength cannot be measured properly using the RL-specimen type. On the other hand, the frac- ture in the LR-specimen started at the notch roots, as in Fig. 8b, and catastrophic failure occurred between the notches, as in Fig. 8c, by the continuous loading after fracture initia- tion. The value of FLRWaS higher than that usually obtained by the JIS shear test. 13 According to Adams and Walrath's results obtained from testing graphite/epoxy composite, the initial fracture does not alter the stress profiles significantly, and the shear stress is thought to be uniform even when the
Table 2. Yield shear stresses obtained by the Iosipescu shear tests and torsion tests
Species Iosipescu (GPa) Torsion: YLR (GPa)
YaL YLR
Spruce 6.5 +_ 1.6 6.2 -+ 1.4 8.7 -+ 2.1 Ash 7.5 _+ 0.9 7.8 -+ 2.1 9.9 -+ 1.2 Results are averages _+ SD
Table 3. Failure stresses obtained by Iosipescu shear tests
Species F R L /~LR
(MPa) (MPa)
Spruce 7.5 ± 1.4 10.3 ± 1.6 Ash 9.6 _+ 0.8 13.7 +- 1.2 Results are averages + SD
°1-.~
90
7 5 -
6 0 -
45 - o
3 0 -
1 5 -
0
0
Spruce R L - s p e c i m e n
0 0 0 0 0 0 0 0 0 0
I
I
I
2
4
6
Shear stress (MPa)
ID ID
°~..4
° ,...i
90
7 5 -
6 0 -
4 5 -
O
3 0 -
1 5 -
0
0
Spruce L R - s p e c i m e n
0 0 0 0 0 0 0 O 0 0 0 0 0 0 0 0 0
I
I
I
I
I
2
4
6
8
10
Shear stress (MPa)
12
a
Fracture
Fracture
I / l i i / / I
Fracture
~ / z r i i i i i / i i J
1 / / / / / / I l l r i i i , / i / ~ Fracture
L
LR
R
Conclusions
W e evaluated the m e t h o d for m e a s u r i n g shear properties of wood by the Iosipescu shear test a n d o b t a i n e d the following results.
1. T h e Iosipescu shear test effectively measures shear m o d u l u s a n d yield shear stress.
2. To m e a s u r e the shear strength by the Iosipescu shear test properly, we should e x a m i n e the configuration of the specimen a n d the supporting condition in more detail.
Acknowledgments We thank Prof. Peer Haller, Professor at The Dresden Technical University, and Mr. Kazuhiro Origuchi, a graduate student of The University of Tokyo, for their help in conducting our experiment. This research was supported partly by a Grant-in-Aid for Scientific Research (No. 09460072) from the Ministry of Education, Science, and Culture of Japan.
References
F r a c t u r e ~
C t____---~'---
"N ~ f
Fracture R
Pig. 8a-c. Fracturing pattern of each type of specimen, a RL specimen, fracture initiation; b LR specimen, fracture initiation; c LR specimen, after unload. Hatched zones represent the supports of the specimen
fracture exists. ~ Nevertheless, the R L - s p e c i m e n s tested here d e f o r m e d seriously, as in Fig. 8c. Despite the pure shear stress condition in the gauge region as in Fig. 6, we are afraid that this large d e f o r m a t i o n disturbs the pure shear stress c o n d i t i o n all over the region b e t w e e n the notches. I n this work, we used a configuration of the specimen a n d a supporting c o n d i t i o n similar to the A S T M standard. To reduce the large d e f o r m a t i o n of the specimen, we should e x a m i n e the testing condition in detail. If the cata- strophic failure occurs b e t w e e n the notches without large d e f o r m a t i o n of the specimen, the shear strength can be o b t a i n e d properly, and we can say that the Iosipescu shear test is the best me~hod for d e t e r m i n i n g the shear properties of wood.
1. Boonlualohr P, Valliappan S (1976) Elastoplastic torsion of aniso- tropic bars. Proc ASCE J Eng Mech Div 102:995-1008
2. Kon T (1948) On the law of variation of the modulus of elasticity for bending in wooden beams. Bull Hokkaido Univ Dept English 1:157-166
3. Yoshihara H, Ohta M (1997) Analysis of the shear stress/shear strain relationships in wood obtained by the torsion tests. Mokuzai Gakkaishi 47:457-463
4. iosipescu N (1967) New accurate procedure for single shear testing of metals. J Mater 2:537-566
5. Janowiak JJ, Pellerin RF (1991) Iosipescu shear test apparatus applied to wood composites. Wood Fiber Sci 23:410-418 6. Adams DF, Walrath DE (1987) Current status of the Iosipescu
shear test method. J Comp Mater 21:494-507
7. Pierron F, Vaoutrin A (1994) Accurate comparative determination of the in-plane shear modulus of T300/914 by the Iosipescu and 45 degrees off-axis tests. Comp Sci Technol 52:61-72
8. Kumosa M, Hull D (1987) Mixed-mode fracture of composites using Iosipescu shear test. Int J Fracture 35:83-102
9. Conant NR, Odom EM (1995) An improved Iosipescu shear test fixture. J Comp Technol Res 17(1):50-55
10. Yoshihara H, Ohta M (1997) Stress-strain relationship of wood in the plastic region. III. Determination of the yield stress by for- mulating the stress-plastic strain relationship. Mokuzai Gakkaishi 43:464469
11. Yoshihara H, Ohta M (1996) Shear stress-shear strain relationship of wood in the plastic region. Mokuzai Gakkaishi 41:52%536 12. Timoshenko SP, Goodier JN (1970) Theory of elasticity (3rd ed).
McGraw-Hill, New York, p 24