O R I G I N A L A R T I C L E
Open Access
Genomic and transcriptomic analysis reveal
molecular basis of salinity tolerance in a
novel strong salt-tolerant rice landrace
Changmaogu
Bing-Rui Sun
1†, Chong-Yun Fu
1†, Zhi-Lan Fan
1,2, Yu Chen
1,2, Wen-Feng Chen
1,2, Jing Zhang
1,2, Li-Qun Jiang
1,2,
Shuwei Lv
1,2, Da-Jian Pan
1,2*and Chen Li
1,2*Abstract
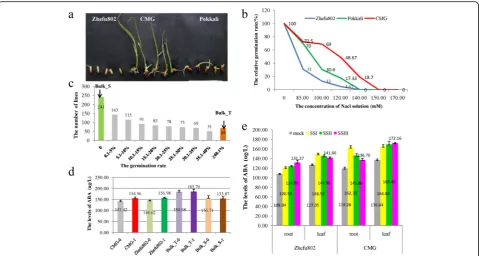
Background:Salt stress is an important factor that limits rice yield. We identified a novel, strongly salt tolerant rice landrace called Changmaogu (CMG) collected from a coastal beach of Zhanjiang, Guangdong Province, China. The salt tolerance of CMG was much better than that of the international recognized salt tolerant rice cultivar Pokkali in the germination and seedling stages.
Results:To understand the molecular basis of salt tolerance in CMG, we performed BSA-seq for two extreme bulks derived from the cross between CMG and a cultivar sensitive to salt, Zhefu802. Transcriptomic sequencing was conducted for CMG at the germination and young seedling stages. Six candidate regions for salt tolerance were mapped on Chromosome 1 by BSA-seq using the extreme populations. Based on the polymorphisms identified between both parents, we detected 32 genes containing nonsynonymous coding single nucleotide polymorphisms (SNPs) and frameshift mutations in the open reading frame (ORF) regions. With transcriptomic sequencing, we detected a large number of differentially expressed genes (DEGs) at the germination and seedling stages under salt stress. KEGG analysis indicated two of 69 DEGs shared at the germination and seedling stages were significantly enriched in the pathway of carotenoid biosynthesis. Of the 169 overlapping DEGs among three sample points at the seedling stage, 13 and six DEGs were clustered into the pathways of ABA signal transduction and carotenoid biosynthesis, respectively. Of the 32 genes carrying sequence variation, only OsPP2C8 (Os01g0656200) was differentially expressed in the young seedling stage under salt stress and also showed sequence polymorphism in the ORFs between CMG and Zhefu802.
Conclusion:OsPP2C8was identified as the target candidate gene for salinity tolerance in the seedling stage. This provides an important genetic resource for the breeding of novel salt tolerant rice cultivars.
Keywords:Rice landrace, Salt tolerance, BSA-seq, Transcriptome sequencing
© The Author(s). 2019Open AccessThis article is distributed under the terms of the Creative Commons Attribution 4.0 International License (http://creativecommons.org/licenses/by/4.0/), which permits unrestricted use, distribution, and reproduction in any medium, provided you give appropriate credit to the original author(s) and the source, provide a link to the Creative Commons license, and indicate if changes were made.
* Correspondence:13922413514@163.com;lic11111@sina.com
†Bing-Rui Sun and Chong-Yun Fu contributed equally to this work.
1Rice Research Institute, Guangdong Academy of Agricultural Sciences,
Guangzhou 510640, China
Salinity is one of the most common abiotic stresses liting crop production. Except for in coastal areas, im-proper irrigation and the use of poor-quality water aggravate the salinization of arid and semi-arid soil in in-land areas (Rahman et al., 2016). Rice (Oryza sativa L.) is a staple food crop that is salt sensitive in both young seedling and reproductive stages (Kumar et al., 2013). Identifying rice germplasm that is salt tolerant and breeding rice cultivars that are salt tolerant are the most economic and effective methods for the reduction of rice yield loss caused by salinity.
Rice salinity tolerance is a complex trait controlled by quantitative trait loci (QTLs) (Roy et al., 2011; Wang et al., 2013) and also shows different physiological mechanisms (Li and Xu,2007). Although many salt tol-erant QTLs have been detected in different rice lines (Koyama et al.,2001; Ammar et al., 2009; Pandit et al., 2010; Gong et al., 1999; Kumar et al., 2015), only sev-eral major salt tolerant rice QTLs or genes such as qSKC1 (Lin et al., 2004; Ren et al., 2005), qSNC7 (Lin et al.,2004),Saltol(Thomson et al.,2010), andOsRR22 (Takagi et al., 2015) have been identified by genomic
methods. A major QTL, qSKC1, encodes a sodium
transporter in rice under salt stress (Ren et al., 2005). OsRR22 encodes a B-type response regulator protein that acts as a transcription factor regulating genes in-volved in osmotic responses and/or ion transport be-tween parenchyma cells and vascular tissue cells of roots (Takagi et al.,2015).
Next generation sequencing (NGS) technologies con-tribute to discovering genome-wide genetic variation and genotyping in a highly efficient way (Huang and Han, 2013). The relatively low cost of sequencing en-ables the use of genome and transcriptomic sequencing to map some agronomic traits, especially quantitative traits (Varshney et al., 2014b; Pandey et al., 2017). The bulk segregant analysis (BSA) method is more effective in rapidly locating candidate genomic regions that underlie the target genes based on whole genomic rese-quencing for the extreme bulks and both parents (Takagi et al., 2013). Several transcriptomic studies have identified numerous differentially expressed genes in tolerant rice varieties compared to salinity-sensitive rice varieties (Kawasaki et al., 2001; Walia et al., 2005; Cotsaftis et al., 2011; Wang et al., 2016; Shankar et al., 2016). These differentially expressed genes (DEGs) are generally associated with stress signaling, ion trans-port, transcription regulation, and some specific meta-bolic processes (Kawasaki et al., 2001; Walia et al.,2005; Cotsaftis et al., 2011; Kumar et al., 2013). However, current studies of the tolerance of rice to salinity mainly focus on the classic salt-tolerant rice cultivar, Pokkali, and its derived line, FL478. We identified a new salt-tolerant landrace called Changmaogu (CMG), which
shows much stronger tolerance to salinity than Pokkali at the germination and young seedling stages (Fig.1a).
In this study, we performed BSA sequencing for two extreme bulks and transcriptomic sequencing for CMG in the germination and young seedling stages under salt stress. This research aimed to identify the salt tolerant candidate genes in the seedling stage and provide insight into the molecular basis of salinity tol-erance in CMG.
Results
Evaluation of Salinity Tolerance of CMG and Construction of the Extreme Mapping Population for BSA-Seq
The rice landrace Changmaogu (CMG), collected from a coastal beach of Zhanjiang, Guangdong Province, China, showed strong tolerance to the salinity of sea water (the total salt concentration: 370 mM) (Fig. 1a). To investigate the salt tolerance of CMG and identify the optimal salt concentration, the germination rates of CMG, Pokkali, and Zhefu802 were scored under six different salt (NaCl) concentrations (85 mM, 100 mM, 120 mM, 140 mM, 150 mM, and 170 mM). The germin-ation rates of the three rice lines gradually decreased with increasing salt concentration. Overall, CMG showed a much stronger tolerance to salinity than Pokkali and Zhefu802 under all six salt concentrations (Fig. 1b). The germination rate of CMG was similar to that of Pokkali and much greater than that of Zhefu802 in the 85 mM NaCl treatment. In the 100 mM NaCl treatment, the germination rate of CMG was higher than that of Pokkali. The germination rate of CMG var-ied based on the NaCl concentration; the germination rates were 69%, 48.67%, and 18.7% in the 100, 120, and 140 mM NaCl treatments, respectively. Hence, the 120 mM NaCl treatment was considered the optimal con-centration. The germination rate of CMG, Pokkali, and Zhefu802 were 48.67%, 17.33%, and 4.67%, respectively, in the 120 mM NaCl solution (Fig.1b).
To map the genes related to salinity tolerance in CMG, we constructed an F2population derived from the
cross between the strongly tolerant cultivar CMG and the sensitive cultivar Zhefu802. This F2 population was
used to identify the degree of salinity tolerance in the young seedling stage using F2:3 seeds in the 120 mM
NaCl treatment. We identified the salinity tolerance of more than 1000 F2:3 seeds and detected 241 and 68 F2:3
lines showing no germination and more than 40% ger-mination rate, respectively. We continued to cultivate the 68 F2:3 seeds for 25 days after salt treatment and
Measurement of Abscisic Acid (ABA)
Abscisic acid (ABA) is a plant hormone that regulates plant growth and development and is rapidly increased by abiotic stresses such as drought and salinity (Mahajan and Tuteja, 2005). High salinity increases ABA (Kumar et al.,2013). To investigate whether the salt tolerance of CMG is associated with ABA, we tested the content of ABA in the roots and leaves under both normal growth conditions and salt stress at the germination and young seedling stage in CMG and Zhefu802. At the germation stage, the ABA levels in CMG and Zhefu802 in-creased under salt stress, compares with normal growth condition. But the ABA levels in CMG were equivalent to those in Zhefu802 under salt stress and normal growth condition, respectively. Compared with under normal growth condition, the ABA levels in both ex-treme bulks did not significantly change under salt stress. But the ABA levels (about 185μg/L) in extreme salt tolerant bulk were remarkably higher than those (about 154μg/L) in salt sensitive bulk under salt stress and normal growth condition (Fig. 1d). At the young seedling stage, compared with normal growth condi-tions, the ABA levels in roots and leaves increased under salt stress in both CMG and Zhefu802, and the increase of ABA in CMG was significantly higher than that in Zhefu802 (Fig. 1e). In roots of CMG, the ABA content
instantly reached the highest level (162.70μg/L) at the first sampling point (SSI) and then gradually reduced at SSII (145.80μg/L) and SSIII (136.76μg/L). In leaves of CMG, the ABA level gradually increased at three sam-pling points, SSI (164.80μg/L), SSII (169.43μg/L), and SSIII (172.16μg/L).
However, Zhufu802 showed the different changing trend of ABA content in roots and leaves, compared with CMG. Namely, the ABA level gradually increased in roots (120.54μg/L, 124.09μg/L and 131.27μg/L) and decreased in leaves (148.59μg/L, 144.96μg/L and 141.66μg/L) at the sampling points from SSI to SSIII.
Sequencing and Mapping of Reads to the‘Nipponbare’ Reference Genome
rates of high quality (Q30) bases were more than 91% (91.82% for CMG, 93.66% for Zhefu802, 92.37% for S_ bulk, and 92.78% for T_bulk).
Candidate Regions for Salinity Tolerance by Bulked Segregant Analysis (BSA) Based on Genomic Resequencing
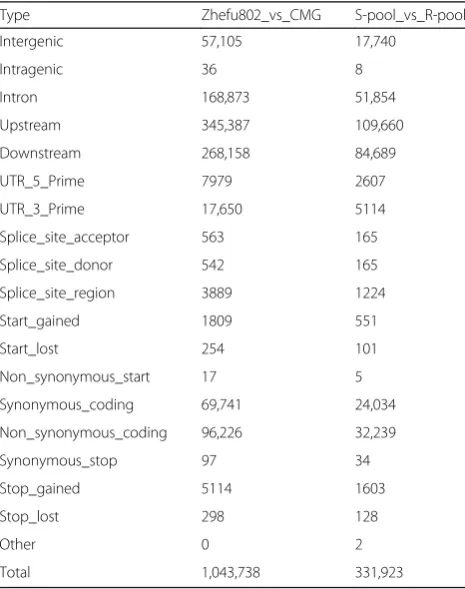
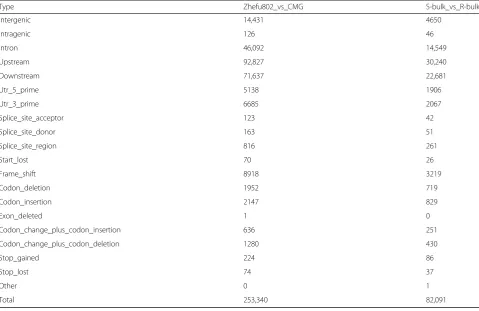
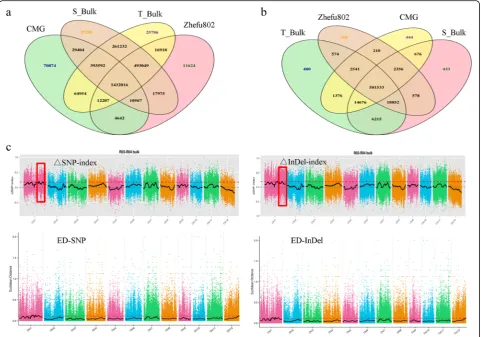
In total, we detected 1,043,738 SNPs, including 96,226 nonsynonymous coding SNPs and 253,340 small InDels, between both parent lines. Between the two extreme bulks, we detected 331,923 SNPs including 32,239 nonsynonymous coding SNPs and 82,091 small InDels (Tables2and3; Fig.2a,b). An association analysis of sal-inity tolerance and polymorphic markers was performed using Euclidean Distance (ED) and SNP/InDel-index methods. We detected seven and six related candidate
regions covering 3.66 Mb and 10.16 Mb based on SNP-index and ED, respectively (Additional file 1: Table S1). Similarly, according to polymorphic InDels, we obtained 10 and nine candidate regions covering 3.63 Mb and 9.58 Mb based on InDel-index and ED, respectively (Additional file 1: Table S2). We overlapped the results based on the two methods, identifying six and six candi-date regions covering 3.66 Mb and 2.6 Mb, respectively, based on the threshold value of the confidence interval of 0.8914 of Δ(SNP/InDel-index) at the 95% significant level (Fig. 2c;Additional file 1: Table S3). Finally, with further analyses, we identified that the six overlapped re-gions as the most likely candidate rere-gions for salinity tol-erance at the seedling stage. These six candidate regions were located on chromosome 1 and covered a 2.6 Mb re-gion containing 430 genes (Table 4). Based on the se-quence polymorphism in ORFs of 430 genes between CMG and Zhefu802, we found that 23 genes carried nonsynonymous coding SNPs and eight genes contained frame shift mutations (Table5).
Transcriptome Sequencing for CMG under Salt Stress at Germination and Seedling Stages
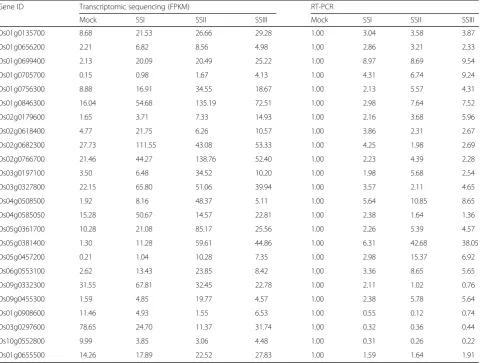
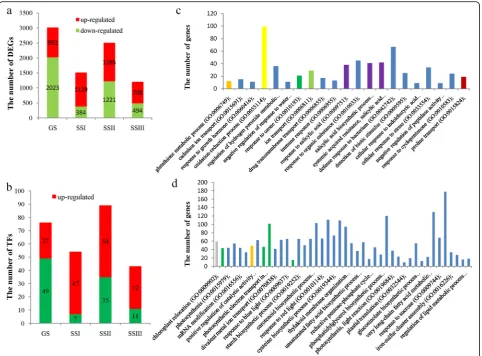
To understand the differentially expressed genes responding to salt stress, we performed transcriptomic sequencing under the conditions of normal growth and salt stress (120 mM NaCl solution). We randomly se-lected 24 DEGs for real time PCR (RT-PCR) to validate the differential expression (Additional file 1: Table S4). The RT-PCR results were in good agreement with the transcriptomic sequencing results (Table 6). We investi-gated the number of upexpressed and downexpressed genes at germination and the seedling stage and found that the number of downregulated genes was greater than that of upregulated genes at the germination stage. The number of upregulated genes was greater than that of downregulated genes at the seedling stage, especially at the first sampling point (SSI) (Fig. 3a). Similarly, the number of differentially expressed transcription factors (TFs) had a similar tendency at the germination and seedling stages (Fig.3b).
A Gene Ontology (GO) analysis was performed to ex-plore the biological processes related to salinity tolerance at germination and seedling stages. At germination stage, the DEGs were significantly enriched in 48 biological
Table 1Coverage of the reads mapping to the Nipponbare reference genome from resequencing of theindicarice variety Zhefu802 and a rice landrace CMG using Hiseq 2000.
BMK ID Clean_Reads Clean_Base Mapped (%) Properly_mapped (%) Q30(%)
CMG 42,143,655 12,625,063,756 96.39 90.33 91.82
Zhefu802 35,794,170 10,720,972,860 97.42 91.65 93.66
S-pool 71,884,976 21,536,286,334 98.01 91.94 92.37
R-pool 72,863,530 21,826,349,910 97.71 92.03 92.78
Table 2The distribution of detected SNPs between both parents Zhefu802 and CMG and between the two extreme pools
Type Zhefu802_vs_CMG S-pool_vs_R-pool
Intergenic 57,105 17,740
Intragenic 36 8
Intron 168,873 51,854
Upstream 345,387 109,660
Downstream 268,158 84,689
UTR_5_Prime 7979 2607
UTR_3_Prime 17,650 5114
Splice_site_acceptor 563 165
Splice_site_donor 542 165
Splice_site_region 3889 1224
Start_gained 1809 551
Start_lost 254 101
Non_synonymous_start 17 5
Synonymous_coding 69,741 24,034
Non_synonymous_coding 96,226 32,239
Synonymous_stop 97 34
Stop_gained 5114 1603
Stop_lost 298 128
Other 0 2
process terms (FDR < 0.001), including oxidation-reduction process (GO:0055114)(276 genes), carotenoid biosynthetic process (GO:0016117) (73 genes), glucosin-olate biosynthetic process (GO:0019761) (71 genes), glutathione biosynthetic process (GO: 0006750) (71 DEGs), and response to karrikin (GO:0080167) (87 genes). The upregulated DEGs were significantly enriched into 21 terms (FDR < 0.001) (Fig.3c), including glutathione metabolic process (GO:0006749), cadmium ion transport (GO:0015691), oxidation-reduction process (GO:0055114), negative regulation of response to water deprivation (GO:0080148), and proline transport (GO: 0015824). The downregulated DEGs were clustered into 46 GO terms (FDR < 0.001) (Fig. 3d). Most of these enriched terms were associated with the processes of photosynthesis and catalytic activity.
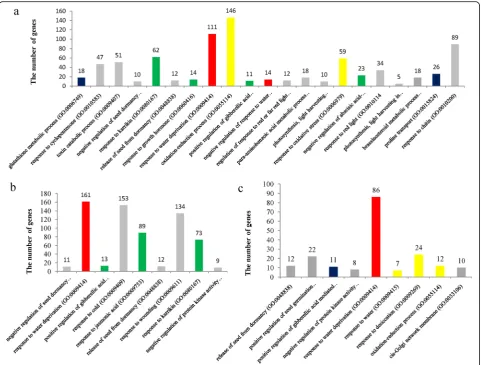
At the first sampling point (SSI) in the seedling stage, the DEGs were grouped into 21 GO terms (FDR < 0.001) (Fig. 4a), including glutathione metabolic process (GO: 0006749) (18 genes), response to karrikin (GO:0080167) (62 genes), response to water deprivation (GO:0009414) (111 genes), oxidation-reduction process (GO:0055114) (146 genes), negative regulation of response to water deprivation (GO:0080148) (14 genes), negative regula-tion of abscisic acid-activated signaling pathway (GO: 0009788) (23 genes), and proline transport (GO:
0015824) (26 genes). At SSII, these DEGs were clustered into nine GO terms (FDR < 0.001) containing response to water deprivation (GO:0009414) (161 genes), response to jasmonic acid (GO:0009753) (89 genes), and response to karrikin (GO:0080167) (73 genes) (Fig. 4b). At SSIII, the DEGs were also enriched into nine GO terms (FDR < 0.001) (Fig.4c), including response to water deprivation (GO:0009414) (89 genes), response to water (GO: 0009415) (seven genes), response to desiccation (GO: 0009269) (24 genes) and oxidation-reduction process (GO:0055114) (112 genes).
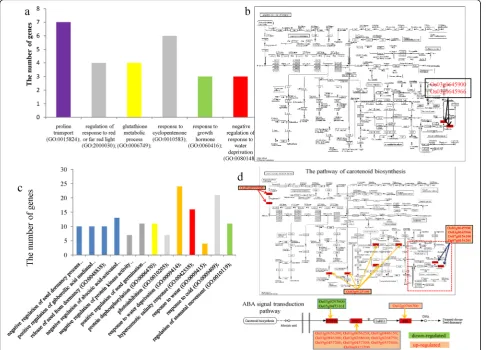
We also investigated the overlapping DEGs between ger-mination and seedling stages and among the three sam-pling points at the seedling stage. Some of the 69 shared DEGs between germination and the seedling stage were enriched in six GO terms (FDR < 0.01) (Fig. 5a), such as proline transport (GO:0015824) (seven genes), glutathione metabolic process (GO:0006749) (four genes), and negative regulation of response to water deprivation (GO:0080148) (three genes). The KEGG analysis indicated that only two genes, Os03g0645900 (OsNCED3) and Os03g0645966, were significantly enriched in the carotenoid biosynthesis pathway (ko00906) (FDR < 0.01) (Fig.5b). The 164 overlap-ping genes among the three sampling points at the seedling stage were clustered into 13 GO terms (FDR < 0.001) (Fig. 5c), including negative regulation of abscisic acid-activated
Table 3The distribution of detected InDels between both parents Zhefu802 and CMG and between the two extreme bulks
Type Zhefu802_vs_CMG S-bulk_vs_R-bulk
Intergenic 14,431 4650
Intragenic 126 46
Intron 46,092 14,549
Upstream 92,827 30,240
Downstream 71,637 22,681
Utr_5_prime 5138 1906
Utr_3_prime 6685 2067
Splice_site_acceptor 123 42
Splice_site_donor 163 51
Splice_site_region 816 261
Start_lost 70 26
Frame_shift 8918 3219
Codon_deletion 1952 719
Codon_insertion 2147 829
Exon_deleted 1 0
Codon_change_plus_codon_insertion 636 251
Codon_change_plus_codon_deletion 1280 430
Stop_gained 224 86
Stop_lost 74 37
Other 0 1
signaling pathway (GO:0009788) (13 genes), response to water deprivation (GO:0009414) (24 genes), hyperosmotic salinity response (GO:0042538) (16 genes), response to water (GO:0009415) (four genes), and regulation of stoma-tal movement (GO:0010119) (11 genes). These DEGs were also significantly grouped into the pathways of plant
hormone signal transduction (ko04075, 13 genes) and ca-rotenoid biosynthesis (ko00906, six genes) (FDR < 0.00001) (Fig.5d). All of the 13 DEGs enriched for plant hormone signaling pathways are involved in abscisic acid (ABA) signal transduction (Fig. 5d). Of them, two DEGs (Os03g0297600 and Os05g0473101) belongs to the PYR1/ PYL family, 10 genes (Os01g0656200, Os01g0656250, Os01g0846150, Os01g0846300, Os03g0268600, Os03g026 8750, Os05g0457200, Os05g0457300, Os05g0537400, and Os09g0325700) belong to the protein phosphatase 2C fam-ily, and one gene (Os02g0766700) encodes a bZIP tran-scription factor acting as an ABA responsive element binding factor.
Expression Patterns of Shared Genes among Three Sampling Points in the Seedling Stage
We further analyzed the expression patterns of DEGs among three sampling points at the early seedling stage according to four expression patterns: Up-Up-Up (U-U-U), Down-Down-Down D-D), Down-Up-Down (D-Fig. 2Constructing the extremely sensitive (S_bulk) and tolerant (T_bulk) salt bulks and BSA-seq analysis for both parents, CMG and Zhefu802, and the two extreme bulks.a: The frequency distribution of the germination rate in more than 1000 F2:3lines from CMG and Zhefu802;b: Venn diagram of the number of SNPs in CMG, Zhefu802, S_bulk, and T_bulk;c: Venn diagram of the number of small InDels in CMG, Zhefu802, S_bulk, and T_bulk;d: the distribution of associated values based on SNP−/InDel-index and Euclidean Distance (ED) on different chromosomes
Table 4The detailed positions of the candidate regions for salt tolerance in CMG
Chromosome Start End Size (Mb)
Chr.1 26,110,000 26,130,000 0.020001
Chr.1 26,160,000 26,180,000 0.020001
Chr.1 26,490,000 27,300,000 0.810001
Chr.1 29,440,000 30,630,000 1.190001
Chr.1 35,800,000 35,940,000 0.140001
Chr.1 36,140,000 36,160,000 0.020001
U-D), and Up-Down-Up (U-D-U). The number of DEGs in the expression patterns U-U-U, D-D-D, D-U-D, and U-D-U were 92, 10, 16, and 29, respectively (Fig. 6a, Additional file1: TableS5). The DEGs in the expression patterns D-U-D and U-D-U were not significantly enriched in any KEGG pathway. Some DEGs in the ex-pression pattern U-U-U were grouped into the two path-ways of plant hormone signal transduction (ko04075) (11 genes: Os01g0656200, Os01g0656250, Os01g084615 0, Os01g0846300, Os03g0268600, Os03g0268750, Os05g 0457200, Os05g0457300, Os05g0537400, Os09g0325700,
and Os02g0766700) and carotenoid biosynthesis
(ko00906) (six genes: Os09g0555500, Os03g0125100,
Os03g0645900, Os03g0645966, Os07g0154100, and
Os07g0154201) (Fig. 5d, marked in red). Two DEGs (Os03g0297600 and Os05g0473101) in the expression pattern D-D-D were also clustered into the plant hormone signal transduction pathway (Fig. 5d, marked in green).
We also investigated the transcription factors (TFs) involved in the four expression patterns. We detected 10
TFs including two ABA-inducible bHLH-type TFs
(Os01g0705700 and Os01g0705750), two C-2b heat shock TFs (Os06g0553001 and Os06g0553100), one ethylene-responsive TF RAP2–3 (Os05g0361700), one GAMYB TF (Os04g0508500), one MYB23 TF (Os02g0618400), one NAC TF ONAC010 (Os03g0327800), one probable WRKY TF 57 (newGene_197), one HEC2 TF (Os09g0455300),
Table 5The candidate genes for salt tolerance based on the index and ED of SNP and InDel
Mutation type Gene ID Position Fuctional annotation
nonsynonymous coding SNP Os01g0655400 26,608,476–26,601,904 Transposon protein, putative
Os01g0733200 30,582,485–30,583,743 HSF-type DNA-binding domain containing protein
Os01g0656200 26,652,944–26,658,313 Protein phosphatase 2C, putative, expressed
Os01g0655500 26,611,799–26,618,704 Serine/threonine-protein kinase stt7
Os01g0647800 26,114,190–26,111,942 Hypothetical protein
Os01g0655600 26,619,462–26,620,234 Hypothetical protein
Os01g0729800 30,422,055–30,422,387 Hypothetical protein
Os01g0658300 26,769,190–26,767,671 Microneme protein Sm70 putative, expressed
Os01g0715100 30,516,831–30,517,430 Ubiquitin-related 4 (Precursor)
Os01g0715100 29,740,123–29,742,527 Conserved hypothetical protein
Os01g0733100 30,585,423–30,585,100 Hypothetical protein
Os01g0655700 26,622,829–26,624,411 Hypothetical protein
Os01g0656600 26,706,158–26,699,189 Hypothetical protein
Os01g0665500 27,200,990–27,196,417 Probable WRKY transcription factor 71
Os01g0714700 29,717,779–29,718,346 Hypothetical protein
Os01g0659900 26,872,217–26,875,033 F-box domain and kelch repeat containing protein
Os01g0727600 30,341,594–30,340,015 Conserved hypothetical protein
Os01g0712250 29,590,343–29,589,249 Arginine/serine-rich protein
Os01g0722100 30,102,785–30,107,361 Bacterial transferase hexapeptide domain containing protein
Os01g0732100 30,533,818–30,536,908 Hypothetical protein
Os01g0655250 26,592,688–26,593,702 PWWP domain containing protein
Os01g0655300 26,599,136-26,599,632 Similar to Trithorax 4
Os01g0719150 29,971,297-29,971,882 Hypothetical protein
Frameshift mutation Os01g0733200 30,582,485–30,583,743 HSF-type DNA-binding domain containing protein
Os01g0659400 26,823,851–26,822,203 Non-protein coding transcript
Os01g0655700 26,622,829–26,624,411 Hypothetical protein
Os01g0655600 26,619,462–26,620,234 Hypothetical protein
Os01g0733100 30,585,423–30,585,100 Cortical cell-delineating protein (Precursor)
Os01g0712250 29,590,343–29,589,249 Arginine/serine-rich protein 45
Os01g0655250 26,592,688–26,593,702 PWWP domain containing protein
and 1 bZIP TF BZIP23 (Os02g0766700) (Fig. 6d). All of these TFs were significantly up-regulated at three sampling points in the seedling stage.
Screening the Target Candidate Genes for Salinity Tolerance
In 31 possible candidate genes including 23 genes containing nonsynonymous coding SNPs and eight frame-shift coding genes (Table5), nonsynonymous and frame-shift mutations simultaneously occurred in Os01g0712250 and Os01g0655700. One gene (Os01g0655400) encodes a putative transposon protein and 13 genes encode hypo-thetical proteins. We investigated the expression of the remaining 17 genes using transcriptomic sequencing. Only Os01g0656200 (OsPP2C8), encoding a protein phos-phatase 2C family protein (PP2C), had significantly in-creased expression levels at the young seedling stage; the expression levels were not altered at the germination stage under the salt treatment. Compared with normal growth conditions, the expression of other genes did not change in the salt treatment. We also compared the sequence of
Os01g0656200 (OsPP2C8) in CMG and Zhefu802 accord-ing to BSA sequencaccord-ing, and we detected one SNP (A in Zhefu802 to G in CMG) in the CDS region of OsPP2C8-causing the alternation of the corresponding amino acid (Thr in Zhefu802 to Ala in CMG) (Fig.6a). We also devel-oped the corresponding primers for the variant site and validated the variant site by sequencing and aligning PCR products from CMG (Fig. 6b). Hence, OsPP2C8 was thought to be the most likely candidate gene for confer-ring salinity tolerance in the seedling stage in CMG.
Discussion
Rice is considered relatively tolerant to salt at germin-ation and sensitive to salinity at the young seedling and reproductive stages (Heenanet al., 1988; Khatun et al., 1995; Zeng et al., 2001). Rice salinity tolerance is also thought to be a quantitative trait. Conventional QTL analysis is a laborious and time-consuming process be-cause of the requirement of genotyping and phenotyping a large number of individuals derived from a biparental cross (Lim et al., 2014). Whole genomic sequencing
Table 6The expression value of 24 randomly selected genes in transcriptomic sequencing and RT-PCR
Gene ID Transcriptomic sequencing (FPKM) RT-PCR
Mock SSI SSII SSIII Mock SSI SSII SSIII
Os01g0135700 8.68 21.53 26.66 29.28 1.00 3.04 3.58 3.87
Os01g0656200 2.21 6.82 8.56 4.98 1.00 2.86 3.21 2.33
Os01g0699400 2.13 20.09 20.49 25.22 1.00 8.97 8.69 9.54
Os01g0705700 0.15 0.98 1.67 4.13 1.00 4.31 6.74 9.24
Os01g0756300 8.88 16.91 34.55 18.67 1.00 2.13 5.57 4.31
Os01g0846300 16.04 54.68 135.19 72.51 1.00 2.98 7.64 7.52
Os02g0179600 1.65 3.71 7.33 14.93 1.00 2.16 3.68 5.96
Os02g0618400 4.77 21.75 6.26 10.57 1.00 3.86 2.31 2.67
Os02g0682300 27.73 111.55 43.08 53.33 1.00 4.25 1.98 2.69
Os02g0766700 21.46 44.27 138.76 52.40 1.00 2.23 4.39 2.28
Os03g0197100 3.50 6.48 34.52 10.20 1.00 1.98 5.68 2.54
Os03g0327800 22.15 65.80 51.06 39.94 1.00 3.57 2.11 4.65
Os04g0508500 1.92 8.16 48.37 5.11 1.00 5.64 10.85 8.65
Os04g0585050 15.28 50.67 14.57 22.81 1.00 2.38 1.64 1.36
Os05g0361700 10.28 21.08 85.17 25.56 1.00 2.26 5.39 4.57
Os05g0381400 1.30 11.28 59.61 44.86 1.00 6.31 42.68 38.05
Os05g0457200 0.21 1.04 10.28 7.35 1.00 2.98 15.37 6.92
Os06g0553100 2.62 13.43 23.85 8.42 1.00 3.36 8.65 5.65
Os09g0332300 31.55 67.81 32.45 22.78 1.00 2.11 1.02 0.76
Os09g0455300 1.59 4.85 19.77 4.57 1.00 2.38 5.78 5.64
Os01g0908600 11.46 4.93 1.55 6.53 1.00 0.55 0.12 0.74
Os03g0297600 78.65 24.70 11.37 31.74 1.00 0.32 0.36 0.44
Os10g0552800 9.99 3.85 3.06 4.48 1.00 0.31 0.26 0.22
assisted BSA has been widely used for the analysis of quantitative traits controlled by a few major genes and is thought to be less useful for the identification of minor QTLs (Guo et al., 2017). In this study, we performed a BSA analysis based on whole genome se-quencing and transcriptome sese-quencing of rice sub-jected to salt stress to identify the major QTLs for salinity tolerance in the rice landrace CMG, which has a strong tolerance to salinity.
Mapping Candidate Regions for Salinity Tolerance in CMG
In the whole genome sequencing analysis, we detected a large number of SNPs and InDelInDels between CMG and Zhufu802 and obtained six candidate regions for sal-inity tolerance in CMG. In these six regions, three re-gions are small (approximately 20 kb; Chr1: 26110000– 26,130,000, 26,160,000–26,180,000, and 36,140,000–36, 160,000) and contained two to three putative genes,
respectively. Os01g0648000 (located in the region from 26,110,000–26,130,000 on Chr1) encodes a putative po-tassium channel protein that has been previously shown to be associated with salt stress (Fuchs et al., 2005); how-ever, it was not differentially expressed in our transcript-ase analysis.
to be involved in abscisic acid signal transduction in higher plants (Sheen, 1998). Three PP2Cs (AtPP2CG1, AtPP2CA, andOsPP2C51) were found to enhance salin-ity tolerance in an abscisic acid-dependent mannerin Arabidopsis and promoted seed germination in rice (Liu et al., 2012; Cui et al., 2013; Bhatnagar et al., 2017). We detected a high level of ABA in the leaves and roots of CMG under salt stress in the seedling stage and the ex-pression of OsPP2C8 was significantly up-regulated at the three sampling points in the seedling stage. CMG shows strong salinity tolerance in the germination and seedling stages, and the expression of this gene was sig-nificantly up-regulated in the seedling stages under salt stress. Hence, OsPP2C8 is also considered the most likely candidate gene for salt tolerance in CMG.
Plant Hormone and Salinity Tolerance
Plant hormones are thought to be the most important en-dogenous substances for regulating various physiological
responses that lead to adaptation to salinity (Pearce et al., 2001b). Yang et al. (2014) assayed the levels of gibberellin, cytokinin, auxin, and abscisic acid under salt stress in to-mato, and the study indicated that ABA played a major role in tomato salt tolerance. The exogenous application of ABA was found to offset the effects of osmotic and ion stress from salt stress conditions in commonbean (Khadri et al., 2007), wheat (Gurmani et al., 2013), and rice (Sripi-nyowanich et al., 2013) by reducing the sodium concentra-tion and improving osmotic adjustment. In this study, we also found that the ABA level largely increased in the leaves and roots, even after approximately 30 min under salinity stress. Overlapping DEGs among three seedling sampling points were enriched in the pathways of caroten-oid biosynthesis and ABA signal transduction, and two DEGs shared in the germination and seedling stages were also clustered into carotenoid biosynthesis. Duan et al. (2012) reported that the genes responsive to salt stress in the tomato line ‘Moneymaker’ and its wild genotype Fig. 4GO analysis of the detected DEGs at the seedling stage.a: GO enrichment of DEGs at the sampling point SSI;b: DEGs enriched in
PI365967 (tolerant to salt) were involved in the carotenoid and ABA biosynthetic pathway. Similar results were also obtained in a close relative of Arabidopsis,Thellungiella, which showed strong tolerance to salt (Wong et al.,2006). Combined with the above studies, these results likely imply that similar mechanisms in the adaptation to sal-inity stress apply for both cultivated plants and wild spe-cies, namely, rapid accumulation of ABA upon salinity stress condition set off the ABA-dependent signal trans-duction pathway to activate downstream target genes to respond to salt stress.
The transcriptome analysis under salt stress indi-cated that only two genes OsNCED3 (Os03g0645900) and Os03g0645966, a hypothetical gene of 69 DEGs were significantly clustered into the pathway of carotenoid biosynthesis. Interestingly, OsNCED3 was down-expressed in the germination stage and up-expressed at three sampling points in the seedling
stage. Overexpression of rice OsNCED3 increased the accumulation of ABA, reduced relative water loss, and delayed seed germination in Arabidopsis (Hwang et al., 2010). In the sequence variants of the two genes in the BSA-seq analysis, we found that there were three nonsynonymous SNPs in the CDS regions.
It is possible that down-expression of OsNCED3
decreases the level of ABA to promote seed germin-ation in CMG in the germingermin-ation stage. In addition, no shared DEGs among the germination and seedling stages were identified in plant hormone signaling pathways, which seems to indicate that the mechan-ism of salinity tolerance in the germination stage might be different from that in the seedling stage. Hence, OsNCED3 could be invovled into salinity tol-erance in CMG at the germination stage, but it was not mapped into the candidate region based on the mapping population of CMG/Zhefu802.
Among 13 DEGs enriched in the ABA signal transduc-tion pathway in the seedling stage, one (Os02g0766700), two (Os03g0297600 and Os05g0473101), and 10 genes belong to the ABF (ABRE binding factors), PYR/PYL, and PP2C families, respectively. Os02g0766700 encodes a bZIP transcription factor. Previous studies have indi-cated that bZIP transcription factors play crucial roles in the ABA signaling pathway in plants (Amir Hossain et al., 2010; Liu et al., 2014). The PYR/PYL family has been identified as ABA receptors (Liu et al., 2012; Lud-wików, 2015). In the model of ABA signaling in plants, PP2Cs first interact with SnRK2s to form a reversible regulatory module in the manner of ABA-independence (Umezawa et al.,2009). The PYR-PP2C-SnRK2 complex is the primary framework for ABA signaling and phosphorylates downstream substrates, including bZIP
transcription factors to activate ABA-responsive gene expression. We detected a sequence variant in the CDS region of OsPP2C8 from CMG, Zhefu802, and Nippon-bare to alter the corresponding amino acid, which could cause the activation of the downstream genes in the pathway of ABA signaling to increase the salinity toler-ance of CMG.
Materials and Methods
Materials
A rice salinity tolerant landrace, Changmangu (CMG), was collected from a coastal beach in Zhanjiang city, Guangdong Province, China. Zhefu802 is a rice cultivar that is sensitive to salinity.
Approximately 2000 plants in the F2 population were
derived from a cross between CMG and Zhefu802. Their Fig. 6Detection and validation of the candidate geneOsPP2Ctolerant to salt at the seedling stage.a: The detected sequence variant ofOsPP2C
leaves were harvested for BSA-seq to map the salinity tolerant genes. The seeds from the F2plants (F2:3) were
also collected to identify salinity tolerance. The seeds of more than 1000 F2:3 lines from the F2 population and
two parents were immersed in 120 mM NaCl solution for 4 days to investigate germination rate at 25 °C in the artificial climate incubator (MGC-450HP). The F2:3
lines with more than 40% germination rate continued to be cultivated under salt stress for 21 days. Thirty F2:3
lines growing well were selected and their correspond-ing F2plant leaves were used to construct the salt
toler-ant bulk.
Bulked Segregant Analysis by Pooled Sequencing
BSA-seq was used to identify the genes regulating the tolerance to salinity in the above mentioned F2
popula-tion. We selected 30 extremely tolerant and 30 F2plants
sensitive to salinity to create extreme sample pools. Gen-omic DNA was extracted using a modified CTAB (Hexa-decyltrimethylammoniumbromide) method and purified by chloroform: phenol (1:1) (Chen and Ronald 1999). The DNA quality was checked using an Agilent bioana-lyzer 1000 (Agilent Technologies, Singapore). Library preparation was performed according to the manufac-turer’s protocol. Genomic re-sequencing was conducted to generate paired-end 100-base (PE100) reads using the Illumina Hiseq 2000 platform (Illumina Technologies), which was conducted by Biomarker (China). Clean reads were aligned to reference genome sequences of the Japonica rice Nipponbare genome ( http://ftp.ensembl-genomes.org/pub/release-24/plants/fasta/oryza_sativa/ dna/Oryza_sativa.IRGSP-1.0.24.dna.toplevel.fa.gz) using BWA software (Li and Durbin, 2009). SNPs and small InDelInDels were detected using GATK software (Mc-Kenna et al.,2010). The tool of Mark Duplicate in Picard
(http://sourceforge.net/projects/picard/) was used to
eliminate PCR duplication to increase SNP/InDel-calling accuracy. SNP/InDel-index was calculated for all the SNP/InDel positions. We excluded SNP/InDel positions with multiple genotypes and read depth < 4 from the two bulk sequences. The association analysis was con-ducted by Euclidean Distance (ED) and SNP/InDel-index, respectively (Hill et al., 2013; Fekih et al., 2013). The overlapped regions based on the above two methods were considered candidate regions for salinity tolerance.
Sample Preparation and Transcriptome Sequencing
Dry seeds from CMG were immersed in 120 mMNaCl solution and sterile water for 4 days. The young buds and roots were harvested at germination and rapidly stored in liquid nitrogen for transcriptomic sequencing. Thirty-day-old seedlings in nutrient solution were treated with 120 mM NaCl solution for 0 min, 30 min, 3 h, and 24 h; approximately 2 g of roots per treatment
were collected and rapidly stored in liquid nitrogen for transcriptomic sequencing of the seedling stage. Total RNA samples were extracted using the TRIzol reagent (Invitrogen) and then treated by RNase-freeDNase I (Takara) to remove genomic DNA. mRNA libraries were created according to the standardprotocols provided by Illumina. The mRNA quality including mRNA concen-tration and fragment size was tested using Qubit2.0 and Agilent 2100.mRNA was enriched using Dynabeads oligo (dT) (Dynal; Invitrogen) and fragmented using fragmen-tationbuffer. Double-stranded cDNAs were produced using reversetranscriptase (Superscript II; Invitrogen) and random hexamerprimers and further purified using AMPure XP beads. The purified double-stranded cDNA samples were enriched by PCR to construct the final cDNA libraries for sequencing using Hiseq 2500 (150 bp paired ends) by Biomarker (China). All raw-sequence reads data were uploaded to NCBI SequenceRead Arch-ive (SRA, http://www.ncbi.nlm.nih.gov/Traces/sra) with accession numbers SRP143635.
Clean reads were also aligned toreference genome se-quences of the Japonica rice Nipponbare genome using TopHat2 (Kim et al.,2013). Gene expression differences among different sampling points were detected using the EBSeq package (v1.10.1). Flod change≥2 and False Dis-covery Rate (FDR) < 0.01 were set to act as the standard for screening the DEGs. Functional classification of DEGs, including Gene Ontology and KEGG pathways, were analyzed using the GOseq R package (Release2.12) and KOBAS software (v2.0).
Real-Time PCR Confirmation of DEGs
A total of 30 DEGs were randomly selected to confirm the transcriptomic sequencing results using real time PCR (RT-PCR). The corresponding sequences of these genes were obtained from the rice genome sequence database (Rap-db). These primers were designed accord-ing to the CDS sequences of the correspondaccord-ing genes using Primer3 software (http://frodo.wi.mit.edu/) (Table S1). TheOsactin1gene was used as the internal control. Total RNAs were isolated from thesame samples for transcriptomic sequencing using the TRIzol reagent (Invitrogen) for RT-PCR. First-strand cDNA was synthe-sized from 1 mg of DNase I-treated RNA samples in a 20μl reaction solution with the oligo (dT) primer, using a Rever TraAce-akit (TOYOBO). Standard RT–qPCR was performed using SYBR Green SuperMix (Bio-Rad) on a CFX96 Real Time System (BioRad).
Assays of abscisic Acid Level
level of ABA. The ABA content was scored using the plant abscisic acidELISA kits (AndyGene) according to the manufacturer’s protocol.
Conclusions
In this study, we mapped six candidate regions for salt tolerance on chromosome 1 based on BSA-seq using ex-treme populations and identified 32 candidate genes ac-cording to the sequence polymorphism in the regions of promoters and ORFs between CMG and Zhefu802. The transcriptome analysis under the conditions of salt stress and normal growth identified numerous DEGs at the germination and young seedling stages. We investigated the expression of the 32 candidate genes and found that OsPP2C8(Os01g0656200) was differentially expressed in the seedling stage under salt stress. Hence, OsPP2C8 was identified as the target candidate gene for salinity tolerance in the seedling stage, which will provide an im-portant genetic resource for salt tolerant rice breeding.
Supplementary information
Supplementary informationaccompanies this paper athttps://doi.org/10. 1186/s12284-019-0360-4.
Additional file 1: Table S1.The mapped candidate regions based on SNP-index and ED.Table S2.The mapped candidate regions based on InDel-index and ED.Table S3.The overlapped candidate regions based on polymorphic SNPs and InDels.Table S4.Characteristics of the RT-PCR primers for validating the results of transcriptomic sequencing.Table S5. Functional annotation of the DEGs in four types of expression patterns at the seedling stage
Abbreviations
ABA:Abscisic acid; bHLH: Basic helix-loop-helix; BSA: Bulked segregant analysis; bZIP: Basic leucine zipper; DEG: Differentially expressed gene; ED: Euclidean distance; FDR: False discovery rate; GAMYB: GA-regulated myeloblastosis; NAC: NAM (no apical meristem), ATAF, CUC (cup-shaped cotyledon); NGS: Next generation sequencing; ORFs: Open reading frames; PP2C: Proteinphosphatase 2C; PYR1/PYL: Pyrabactin resistance 1/PYR1-like; RAP: RNA Polymerase II-associated Protein; SNP: Single nucleotide polymorphism;; TFs: Transcription factors
Acknowledgments
This work is supported in part by grants from Natural Science Foundation of Guangdong Province, China (2017A030310094), Science and Technology Program of Guangzhou, China (201707010218), Agricultural basic long-term scientific and technological work (ZX01S200101), Provincial Science and tech-nology project of Guangdong (2014B070706013, 2016B070701011, 2017B030314173 and 2017A070702006).
Authors’Contributions
Sun BR, screening the rice line, constructing the mapping population and designing the experiments; Fu CY, analyzing sequencing data and writing the manuscript; Fan ZL and Chen Y, identifying the mapping population; Chen WF, Zhang J, Jiang LQ and Lv SW, validating the partial sequencing results; Pan DJ and Li C, organizing the relative experiments.
Funding
This work is supported in part by grants from Natural Science Foundation of Guangdong Province, China (2017A030310094), Science and Technology Program of Guangzhou, China (201707010218), Agricultural basic long-term scientific and technological work (ZX01S200101) and Provincial Science and
technology project of Guangdong (2014B070706013, 2016B070701011, 2017B030314173 and 2017A070702006).
Availability of Data and Materials
All data generated or analysed during this study are included in this published article and its supplementary information files.
Ethics Approval and Consent to Participate Not applicable.
Consent for Publication Not applicable.
Competing Interests
The authors declare that they have no competing interests.
Author details
1
Rice Research Institute, Guangdong Academy of Agricultural Sciences, Guangzhou 510640, China.2Guangdong Provincial Key Laboratory of New
Technology in Rice Breeding, Guangzhou, China.
Received: 5 January 2019 Accepted: 19 December 2019
References
Amir Hossain M, Lee Y, Cho JI, Ahn CH, Lee SK, Jeon JS, Kang H, Lee CH, An G, Park PB (2010) The bZIP transcription factor OsABF1 is an ABA responsive element binding factor that enhances abiotic stress signaling in rice. Plant Mol Biol 72:557–566.https://doi.org/10.1007/s11103-009-9592-9 Ammar MHM, Pandit A, Singh RK, Sameena S, Chauhan MS, Singh AK, Sharma
PC, Gaikwad K, Sharma TR, Mohapatra T, Singh NK (2009) Mapping of QTLs controlling Na+, K+and cl−ion concentrations in salt tolerantindicarice variety CSR27. J Plant Biochem Biotechnol 18:139–150.https://doi.org/10. 1007/BF03263312
Bhatnagar N, Min MK, Choi EH, Kim N, Moon SJ, Yoon I, Kwon T, Ki-Hong Jung KH, Kim BG (2017) The protein phosphatase 2C clade a protein OsPP2C51 positively regulates seed germination by directly inactivating OsbZIP10. Plant Mol bio l93:389-401.https://doi.org/10.1007/s11103-016-0568-2
Chen DH, Ronald PC (1999) A rapid DNA minipreparation method suitable for AFLP and other PCR applications. Plant Mol Biol Rep 17:53–57.https://doi. org/10.1023/A:1007585532036
Cui MH, Yoo KS, Hyoung S, Nguyen HT, Kim YY, Kim HJ, Ok SH, Yoo SD, Shin JS (2013) An Arabidopsis R2R3-MYB transcription factor, AtMYB20, negatively regulates type 2C serine/threonine protein phosphatases to enhance salttolerance. FEBS Lett 587(12):1773–1778.https://doi.org/10.1016/j.febslet. 2013.04.028
Duan HK, Zhu Y, Qi DD, Li WL, Hua XJ, Liu YX, Deng X (2012) Comparative study on the expression of genes involved into carotenoid and ABA biosynthetic pathway in response to salt stress in tomato. J Integr Agr 11(7):1093–1102. https://doi.org/10.1016/s2095-3119(12)60102-6
Fekih R, Takagi H, Tamiru M, Abe A, Natsume S, Yaegashi H, Sharma S, Sharma S, Kanzaki H, Matsumura H, Saitoh H, Mitsuoka C, Utsushi H, Uemura A, Kanzaki E, Kosugi S, Yoshida K, Cano L, Kamoun S, Terauchi R (2013) MutMap+: genetic mapping and mutant identification without crossing in Rice. PLoS One 8(7):e68529.https://doi.org/10.1371/journal.pone.0068529
Gong JM, He P, Qian QA, Shen LS, Zhu LH, Chen SY (1999) Identification of salt-tolerance QTL in rice (Oryza sativa L.). Chin Sci Bull 44:68–71.https://doi.org/ 10.1007/BF03182889
Guo GJ, Wang SB, Liu JB, Pan BG, Diao WP, Ge W, Gao CZ, Snyder JC (2017) Rapid identification of QTLs underlying resistance toCucumbermosaicvirus in pepper (Capsicum frutescens). Theor Appl Genet 130:41–52.https://doi.org/10. 1007/s00122-016-2790-3
Hill JT, Demarest BL, Bisgrove BW, Gorsi B, Su YC, Yost HJ (2013) MMAPPR: mutation mapping analysis pipeline for pooled RNA-seq. Genome Res 23: 687–697.https://doi.org/10.1101/gr.146936.112
Huang X, Lu T, Han B (2013) Resequencing rice genomes: an emerging new era of rice genomics. Trends Genet 29:225–232.https://doi.org/10.1016/j.tig.2012. 12.001
Kim D, Pertea G, Trapnell C, Pimentel H, Kelley R, Salzberg SL (2013) TopHat2: accurate alignment of transcriptomes in the presence of insertions, deletions and gene fusions. Genome Biol 14:R36.https://doi. org/10.1186/gb-2013-14-4-r36
Koyama LM, Levesley A, Koebner RMD, Flowers TJ, Yeo AR (2001) Quantitative trait loci for component physiological traits determining salt tolerance in rice. Plant Physiol 125:406–422.https://doi.org/10.1104/pp.125.1.406
Kumar K, Kumar M, Kim SR, Ryu H, Cho YG (2013) Insights into genomics of salt stress response in rice. Rice 6(1):27.https://doi.org/10.1186/1939-8433-6-27 Kumar V, Singh A, Amitha Mithra SV, Krishnamurthy SL, Parida SK, Sourabh Jain S,
Tiwari KK, Kumar P, Rao AR, Sharma SK, Khurana JP, Singh NK, Mohapatra T (2015) Genome-wide association mapping of salinity tolerance in rice (Oryza sativa). DNA Res 22(2):133–145.https://doi.org/10.1093/dnares/dsu046 Li H, Durbin R (2009) Fast and accurate short read alignment with
burrows-wheeler transform. Bioinformatics 25(14):1754–1760.https://doi.org/10.1093/ bioinformatics/btp324
Li ZK, Xu JL (2007) Breeding for drought and salt tolerant rice (oryza sativaL.): progress and perspectives. In: Jenks MA et al (eds) Advances in molecular breeding toward drought and salt tolerant crops. Springer, USA, pp 531–564 Lim JH, Yang HJ, Jung KH, Yoo SC, Paek NC (2014) Quantitative trait locus
mapping and candidate gene analysis for plant architecture traits using whole genome re-sequencing in rice. Mol cells 37(2): 149-160. Doi:https://doi. org/10.14348/molcells.2014.2336
Lin HX, Zhu MZ, Yano M, Gao JP, Liang ZW, Su WA, Hu XH, Ren ZH, Chao DY (2004) QTLs for Na+and K+uptake of the shoots and roots controlling rice salt tolerance. Theor Appl Genet 108:253–260.https://doi.org/10.1007/ s00122-003-1421-y
Liu C, Mao B, Ou S, Wang W, Liu L, Wu Y, Chu C, Wang X (2014) OsbZIP71, a bZIP transcription factor, confers salinity and drought tolerance in rice.Plant Mol Bio l84:19-36.https://doi.org/10.1007/s11103-013-0115-3
Liu X, Zhu YM, Hong ZH, Cai H, Ji W, Luo X, Li J, Bai X (2012) AtPP2CG1, a protein phosphatase 2C, positively regulates salt tolerance of Arabidopsis in abscisic acid-dependent manner. Biochem Biophys Res Commun 422:710–715. https://doi.org/10.1016/j.bbrc.2012.05.064
Ludwików A (2015) Targeting proteins for proteasomal degradation—a new function ofArabidopsisABI1 protein phosphatase 2C. Front Plant Sci 6:310. https://doi.org/10.3389/fpls.2015.00310
Mahajan S, Tuteja N (2005) Cold, salinity and drought stresses: An overview. Arch Biochem Biophys 444(2):139–158.https://doi.org/10.1016/j.abb.2005.10.018 McKenna A, Hanna M, Banks E, Sivachenko A, Cibulskis K, Kernytsky A, Garimella
K, Altshuler D, Gabriel S, Daly M, MA DP (2010) The Genome Analysis Toolkit: a MapReduce framework for analyzing next generation DNA sequencing data. Genome Res 20:1297–1303.https://doi.org/10.1101/gr.107524.110.20 Pandey MK, Khan AW, Singh VK, Vishwakarma MK, Shasidhar Y, Kumar V, Garg V,
Bhat RS, Chitikineni A, Janila P, Guo BZ, Varshney RK (2017) QTL-seq approach identified genomic regions and diagnostic markers for rust and late leaf spot resistance in groundnut (Arachishypogaea L.). Plant Biotechnol J 15:927–941.https://doi.org/10.1111/pbi.12686
Pandit A, Rai V, Bal S, Sinha S, Kumar V, Chauhan M, GautamRK SR, Sharma PC, Singh AK, Gaikwad K, Sharma TR, MohapatraT SNK (2010) Combining QTL mapping and transcriptome profiling of bulked RILs for identification of functional polymorphism for salt tolerance genes in rice (Oryza sativa L.). Mol Gen Genomics 284:121–136.https://doi.org/10.1007/s00438-010-0551-6 Rahman MA, Thomson MJ, Shah-E-Alam M, Md O, Egdane J, Ismail AM (2016)
Exploring novel genetic sources of salinity tolerance in rice through molecular and physiological characterization. Ann Bot-London 117:1083– 1097.https://doi.org/10.1093/aob/mcw030
Ren ZH, Gao JP, Li LG, Cai XL, Huang W, Chao DY, Zhu MZ, Wang ZY, Luan S, Lin HX (2005) A rice quantitative trait locus for salt tolerance encodes a sodium transporter. Nat Genet 37:1141–1146.https://doi.org/10.1038/ng1643 Roy SJ, Tucker EJ, Tester M (2011) Genetic analysis of abiotic stress tolerance in
crops. Curr Opin Plant Biol 14:232–239.https://doi.org/10.1016/j.pbi.2011.03.002 Takagi H, Tamiru M, Abe A, Yoshida K, Uemura A, Yaegashi H, Obara T, Oikawa K, Utsushi H, Kanzaki E, Mitsuoka C, Natsume S, Kosugi S, Kanzaki H, Matsumura H, Urasaki N, Kamoun S, Terauchi R (2015) MutMap accelerates breeding of a salt-tolerant rice cultivar. Nat biotechno l33: 445-449.https://doi.org/10.1038/ nbt.3188
Thomson MJ, de Ocampo M, Egdane J, Rahman MA, Sajise AG, Adorada DL, Tumimbang-Raiz E, Blumwald E, Seraj ZI, Singh RK, Gregorio GB, Ismail AM (2010) Characterizing theSaltolquantitative trait locus for salinity tolerance in rice. Rice 3:148–160.https://doi.org/10.1007/s12284-010-9053-8
Umezawa T, Sugiyama N, Mizoguchi M, Hayashi S, Myouga F, Yamaguchi-Shinozaki K, Ishihama Y, Hirayama T, Yamaguchi-Shinozaki K (2009) Type 2C protein phosphatases directly regulate abscisic acid-activated protein kinases in Arabidopsis. Proc Natl Acad Sci U S A 106(41):17588–17593.https://doi.org/ 10.1073/pnas.0907095106
Varshney RK, Terauchi R, McCouch SR (2014) Harvesting the promising fruits of genomics: applying genome sequencing technologies to crop breeding. PLoS Biol 12(6):e1001883.https://doi.org/10.1371/journal.pbio.1001883 Walia H, Wilson C, Condamine P, Liu X, Ismail AM, Zeng L, Wanamaker SI, Mandal
J, Xu J, Cui X, Close TJ (2005) Comparative transcriptional profiling of two contrasting rice genotypes under salinity stress during the vegetative growth stage. Plant Physiol 139(2):822–835.https://doi.org/10.2307/4281915 Wang Z, Chen Z, Cheng J, Lai Y, Wang J, Bao Y, Huang J, Zhang HS (2013) QTL
analysis of Na+and K+concentrations in roots and shoots under different levels of NaCl stress in rice (Oryza sativa L.). PLoS One 7:e51202.https://doi. org/10.1371/journal.pone.0051202
Wong CE, Li Y, Labbe A, Guevara D, Nuin P, Whitty B, Diaz C, Golding GB, Gray GR, Weretilnyk EA, Griffith M, Moffatt BA (2006) Transcriptional profiling implicates novel interactions between abiotic stress and hormonal responses inThellungiella, a close relative of Arabidopsis.Plant Physiol140(4):1437-1450. https://doi.org/10.2307/20205705
Publisher’s Note