© Swiss Society of Economics and Statistics 2010, Vol. 146 (4) 639–659 a University of Luxemburg and CES-Ifo.
b FNRS and IRES, Université Catholique de Louvain. c DECRG, The World Bank.
Key Questions and Methodological Issues
Michel Beinea, Frédéric Docquierb and Cağlar Özdenc
JEL-Classification: F22, O15
Keywords: international migration, skill ratio, network effect, diaspora
1. Introduction
Until recently, the analysis of diaspora externalities has been conducted at the micro level (see Boyd (1989), Massey (1993), Munshi (2003), McKenzie and Rapoport (2010)). Individual or household level micro data have multiple advan-tages such as detailed information on demographic, human capital, social and economic parameters. However a major drawback of those micro approaches is that they can only focus on a limited number of migration corridors at time (e.g. the Mexican-US corridor) and can hardly be generalized to other country pairs. An exception is provided by Beine et al. (2010) who use bilateral macrodata on migration flows and stocks. They took advantage of a recent data set on interna-tional migration by educainterna-tional attainment to investigate the role of diaspora size on the educational structure of migration from 195 countries to the 30 OECD countries. Their paper shows that networks are by far the most important deter-minant of migration flows, explaining 71 percent of the observed variability of the size of migration flows, and 47% of the variability of the selection ratio in 2000.
In this paper, we extend the study of Beine et al. by looking at the diaspora effect on the geographical concentration or dispersion of new migrants, and by compar-ing results obtained with different estimation techniques. Indeed, a macro analysis of diaspora externalities raises multiple econometric problems. The main issues are the large number of empty corridors (due to truncation rules or true ’zeroes’), and the difficulty to identify causation (unobserved variables are likely to affect the existing stock of migrants and the flows of newcomers). Several econometric tech-niques are available to address these issues; one of our goals is to evaluate the quan-titative robustness of diaspora externalities to the choice of a particular method.
The remainder of this paper is organized as following. Section 2 depicts theory and key issues. Section 3 reviews the main empirical hurdles researchers face when studying the impact of diasporas. Section 4 discusses econometric issues while Section 5 presents some estimation results. Section 6 concludes.
2. Theory and Key Issues
We first consider a simplified version of the model used in Beine et. al. (2010) to describe how existing diasporas impact the size, skill composition, and geo-graphic concentration of migration flows.1 An individual endowed with h units of human capital earns a wage wih in country i 1,…,I, where wi is the skill
price in that country. The skill price is linked to labor productivity and the level of development of the country. This structure accommodates the assumptions that the main variation in wages within a country is due to differences in human capital levels (h) among workers whereas the main source variation across coun-tries is due to the skill prices (wi). The utility of a type-h individual working in his birth country (denoted o) is given by
( )
oo o o o
u h w h A F
where Ao is a variable capturing non-wage characteristics and amenities (such as climate) of the home country.
The utility obtained when the same person migrates to a destination country
d is given by
( ) ( )
od d d od d
u h w hA C h F
where Cod(h) denotes moving and assimilation costs that are borne by the migrant. Those costs depend on factors such as physical distance, destination and origin countries’ social, cultural and linguistic characteristics. Assimilation costs are generally assumed to be decreasing with human capital (sCodsh) 0 since high-skilled migrants tend to have more adaptive and transferrable linguistic, technical and cultural skills. A second set of costs involve policy induced costs faced by the migrant to overcome legal hurdles created by the destination country d. These would include migration related fees, legal barriers to citizenship and other civil rights, which we refer to as visa costs with slight abuse of terminology. Again, it is generally the case that these visa costs are lower for high-skilled migrants, especially in the presence of selective migration programs that specifically target highly educated workers and give them special preferences and priorities.
Let No denote the size of the native population that is within migration age in country o. When the random term Fi follows an iid extreme-value distribution (see McFadden, 1974), the probability that a type-h individual born in country
o will move to country d is given by:
exp[ ( )]
Pr[ ( ) max ( )]
exp[ ( )]
d d od
od ok
k
k k ok k
w h A C h
u h u h
w h A C h
( )
ln ( )
( )
od
d o d o od
oo
N h
w w h A A C h
N h
¯
¡ ° ¡ °
¢ ± (1)
This model with a single skill dimension h is rich enough to depict some key patterns of international migration. Among these, the most important are the following:
The size of bilateral migration flows Nod increases with the wage differential (wdwo ), differences in country fixed effects or amenities (AdAo ), and decreases with the level of overall migration costs (Cod).
Migration rates are lower for low-skilled workers than for the high-skilled since the latter benefit more from wage differentials and have lower migration costs (positive selection).
The proportion of high-skilled migrants is larger in countries with higher skill prices (positive sorting).
The key insight from the model is that it helps us to understand how existing diasporas affect the magnitude and structure of migration flows. In what follows, we denote the size of the diaspora from country o in country d by Mod. We show how diaspora externalities can be introduced into the equation (1) and how they can be empirically estimated using bilateral data on migration stocks and flows.
2.1 Impact on Size
As mentioned above, existing social networks or diasporas reduce migration costs through two main channels. First, they lower information, assimilation and adap-tation costs (see for instance Carrington et al., 1996; Bertolini, 2009). For example, members of a diaspora can help new migrants find jobs, adjust to dif-ferent social norms and navigate linguistic barriers. Second, family members who have migrated earlier and obtained certain legal rights in the destination country can lower the visa costs. This channel mainly operates by allowing migrants to benefit from family reunification programs for their legal entry into the destina-tion country. For these reasons, the diaspora size are included in the determinants of migration costs and Cod becomes a function of Mod with (sCodsMod) 0.
The size-externality of diasporas can be tested by regressing skill-specific bilat-eral flows, Nod(h), on the stock of existing migrants at the beginning of the period,
Mod. Assuming a logarithmic functional form for the diaspora effect, equation (1) can now be rewritten as
ln[ ( )] h h hln[ ] h h
od o d od od od
where h ln[ ( )] 0 0
o N hoo w h A
B w captures origin-country fixed effects and
Bdhww
dhAd denotes destination country fixed effects. Dod is a vector of other observable bilateral variables affecting migration decisions (such as distance, lin-guistic overlap, and historical/political connections) and h
od
I is the error term. A positive value for Ch is expected if existing networks reduce migration costs and, thus, increase migration flows.
2.2 Impact on Skill Selection
If the effect of existing networks varies by skill group, then diaspora size will also influence selection effects in terms of human capital levels. Indeed, as assimila-tion and informaassimila-tion costs are sources of positive selecassimila-tion (because they decrease with human capital), any factor that lowers migration costs will favor low-skilled migrants. Second, when the diaspora size is bigger, the probability that a migrant relies on an economic migration program declines and the probability she/he will benefit from family reunion programs increases. In short, the advantages of being skilled are likely to be less important when a destination country already hosts a large diaspora from a given origin country. As a result, ceteris paribus, countries with larger diasporas will tend to attract a larger proportion of less skilled migrants.
Effect of diasporas on educational/skill composition of migrant flows can be indirectly evaluated by differentiating the Ch obtained from the skill-specific regressions in (2). A more direct way to capture this externality is to regress the log-ratio of high-skilled to low-skilled migrants on the overall diaspora size. Denoting by h and h the human capital levels of high-skilled and low-skilled individuals, the dependent variable can be written as ln[Sod]wln[Nod( )h Nod( )].h By
sub-tracting equation (1) for low skill levels from the parallel equation for high skill levels, we obtain
ln[Sod]BoBdCln[Mod]EDodIod (3)
where Bowln[Noo( )h Noo( )]h w h0( h) is a origin-country fixed effect,
Bd ww hd( h) is a destination country fixed effect, and Iod is the error term.
2.3 Impact on Relative Concentration
The next question is about the impact of diasporas on the relative concentration of migration flows across education levels. Low-skilled migrants from a given country will be more concentrated (relative to high-skilled migrants) if they go to fewer number of countries in larger numbers. The impact of diasporas on the concentration levels should be in line with the effect in terms of selection. In particular, if diasporas tends to reinforce a negative selection process, it should increase the concentration of low-skilled migrants compared to the concentra-tion of high-skilled migrants.
Our relative concentration measure is defined as the following:
2 2
( ) ( ) ( ) ( )
od od ok od ok
k k
RC ¡¡N h N h ¯°° ¡ ¡N h N h ¯°°
¢
± ¢
± (4)A nice property of this bilateral measure is that its sum across destination coun-tries boils down to the difference between Herfindhal indices for high-skilled and low-skilled migrants. The equation to be estimated for relative concentra-tion can be written as the following:
ln
od o d od od od
RC B B C ¢¡ M ¯°±ED I (5)
Similar to previous two equations, we have Bo and Bd as the origin and destina-tion fixed effects, respectively, Dod is a vector of explanatory bilateral variables and Iod is the error term. A negative value for C is expected if existing networks increase the concentration of low-skilled migrants across destinations compared to the concentration of the high-skilled migrants.
3. Key Empirical Issues
2 Even though this is the standard definition of a migrant, especially in the economics litera-ture, the dataset does not include second generation children who are born in the destination country even though they might constitute an important part of a diaspora in the sociologi-cal sense. This is simply due to absence of comprehensive administrative data in tracking of the migrants’ children. However, we expect diaspora sizes inclusive and exclusive of second generation to be highly correlated.
any given country to any one of the 30 OECD countries by education level for 1990 and 2000. The dataset covers only the adult population aged 25 and over, and migration is defined on the basis of the country of birth rather than citizen-ship.2 We should note that the DLM database does not fully capture undocu-mented migration for which systematic statistics by education level and country of origin are not available in most destination countries. US census is believed to count most undocumented migrants, however this is not the case in many other OECD countries. By disregarding undocumented migrants (which are dispro-portionately unskilled), the database probably underestimates bilateral migration stocks/flows and overestimates the average level of education of the immigrant populations in many destination OECD countries.
The main strength of the DLM database is that it distinguishes between three levels of education for migrants. High-skilled migrants are those with post-secondary/tertiary education. Medium-skilled migrants are those with upper-secondary education completed. Low-skilled migrants are those with less than upper-secondary education, including those with lower-secondary and primary education or those who did not go to school. The main characteristics of the diaspora that we consider in this paper are the following:
– The bilateral migration flow for each skill group from origin country o to des-tination OECD country d is proxied by the change between 1990 and 2000 in the stock of migrants from o to d.
– The bilateral indicator of positive selection is proxied by the log-ratio of the number of high-skilled to low-skilled new migrants from o to d (we disregard medium-skilled migrants for this specification with no impact on the results) – The bilateral indicator of relative concentration is the ’high-skill minus low-skill’ difference in the squared proportions of migrants from a given origin country o to the 30 possible destinations, following equation (4).
3.1 Individual vs Aggregate Data
The use of aggregate macro data has many advantages but also introduces cer-tain complications. In this section, we discuss the pros and cons of using this dataset, and the main econometric issues triggered by our approach. An impor-tant distinction in the empirical analysis of migration data concerns the use of a individual (micro) data as opposed to aggregate (macro) one. Micro data are col-lected at the household and/or individual level to study the impact of networks on the propensity to migrate and the educational composition of the migrants (Massey (1986), Munshi (2003), McKenzie and Rapoport (2010)). These datasets include different measures of individual economic, demographic and social characteristics, such as age, income, occupation and education. This con-trasts with more approaches the employ aggregate international migration data. Both approaches have their advantages and drawbacks and should be seen as complementary strategies to address the key issues at stake here.
By focusing on individuals or households, micro data directly accounts for the role of individual characteristics of the migrants. For example, McKenzie and Rapoport (2010) confirm that the networks are more important for uned-ucated migrants than for eduned-ucated ones in the case of Mexican migration to the United States. Another appealing feature of the micro datasets is that they can distinguish between different types of networks such as networks defined at the community (city or region) level or at the household (family) level. If such data were available, then we can identify what kind of assistance (such as financial support or cultural assimilation) is provided by different network along the lines suggested by Massey (1986).
A final appealing feature is the possibility of finding suitable instruments for the network at destination. Since both the current migration flows and diasporas (i.e. past migration flows) are influenced by same factors, endogeneity and other statistical problems (see section on the reflection problem) arise in the estima-tion. Appropriate instruments should be strong predictors of the network but be uncorrelated with the size of the flows or their composition (i.e. the dependent variables). Munshi (2003) provides a good example for networks defined at the community level, again for the Mexico-US corridor. Rainfall in origin commu-nities in Mexico are supposed to predict the rate of emigration of those migrants but are uncorrelated with labor market outcomes at destination (in the US) that are potentially affected by Mexican networks already present.
Most other prominent corridors lack such detailed and high-quality data. Fur-thermore, destination selection effects are quite limited since the US is the des-tination for more than 99% of the Mexican migrants. This is unfortunately not the case for a majority of origin countries which send their migrants to a diversi-fied set of destination countries. Even in origin countries where migrants have a limited number of choices, the patterns are likely to vary across destination coun-tries. A good example is provided by Cape Verde, which sends a majority of its unskilled migrants to Portugal while sending the most skilled migrants to the US.
Pooling a large set of origin and destination countries in a macro dataset makes it possible to statistically assess the determinants of the various patterns in inter-national migration which might not be easily captured in an analysis of a single corridor. Furthermore, a large number of cells in a migration matrix are filled with zeros (see the section below for a more detailed discussion of this critical issue). The informational content of the empty cells (such as for the corridor between Cape Verde and Turkey) of migration flows or diasporas between coun-try pairs is valuable. The presence of zeros reflects that the net gains of migra-tion in those corridors are too low for potential migrants and/or . certain factors lead to high levels of migration costs. In other terms, while it creates additional statistical complications that need to be addressed, the inclusion of zero values in macro datasets tends to highlight and identify selection biases.
3.2 The Widespread Presence of Zero Observations
The Docquier, Lowell and Marfouk (DLM, 2007) dataset includes almost all origin countries in the world and 30 destination OECD countries. Many statis-tical properties of the migration flows and stocks can be easily constructed using DLM. The distribution of the migration flows turns out to be unimodal, highly left skewed with a large amount of zero values for both the (net) migration flows between 1990 and 2000 and the stocks in 1990 and 2000. For example, for the flows, DLM includes 34% of pairs of countries with zero values.
What do these large numbers of zero values truly reflect? For a group of coun-try pairs, the zero values might be the result of a statistical truncation process. For instance, for reasons of statistical confidentiality, national statistical agencies might prefer not to report some low number of migrants of country o in country
3 Santos Silva and Tenreyro (2006) show that ignoring the zero trade country pairs lead to overestimation of other bilateral factors such as distance.
it is possible that a number diplomats are not counted in the official stock of migrants following international conventions.
In majority of the cases, a large number of zero values in the migration datasets reflect true zeroes. Like in international trade, many bilateral migration corridors are not ’profitable’ so that there are simply no migrants to observe and record. Ignoring such zero values would be highly detrimental to assess the relevance of the determinants of international migration patterns. Zero values imply that the costs of migration is too high for any potential migrant to move from country o
to country d. Among those factors, The absence of a network at destination might be a leading factor that deters potential migrants from choosing that particular destination.3 Therefore, it is important in the empirical investigation of the net-work effect to employ methods that properly account for those zero migration flows. For example, for the size estimation, possible methods include Poisson regressions, 2-step Heckman approach and Tobit. For the selection and relative concentration, however, Tobit and Poisson regression methods are not possible.
3.3 Stocks vs Flows
on a network at destination, not because of past colonial links that offer current advantages.
The measurement of migration flows in destination countries is also a tricky issue. In most countries, we can rely on census data to provide the stock of migrants in a given year. For most national census rounds, a ten-year frequency is the rule. Therefore, the only way to measure migration flows over a ten-year period is to take the difference between stocks in two successive census rounds. This in turn raises several additional complications. First, the net migration flows are affected by the mortality rate of migrants present in the initial census. Second, there can be significant return migration which varies across origin and destination countries. For instance, using US data, Rosenzweig (2008) shows that the level of skill premia in the origin country is an important factor for the return migration rate of skilled migrants and students. Third issue arises due to regularization (legalization) programs implemented for undocumented migrants who are not recorded in many censuses (such as in most European countries). If regularization programs are implemented between the two censuses, the stocks of migrants in the second census and hence the size of the migration flows will increase in the data without actual movement of people. Another theoretical argument developed by Brücker (2006) suggests that using net migration flows instead of stocks might be misleading in the case of heterogeneous agents. This is especially important when it comes to estimating the impact of wage differ-entials on migration. In models like ours, we do not explicitly include the wage differentials for several reasons. One reason is the absence of reliable wage indi-ces by skill level in most origin countries. A second reason is that wages are cap-tured by country fixed effects in most of our estimations. To sum up, there are obviously negative and positive biases in measuring migrations flows through the changes in migrant stocks from census data. Whether this tends to underes-timate or overesunderes-timate the true values is obviously difficult to know in advance.
3.4 Defining a Network
level might overestimate the number of people able to provide help. Obviously, people located in large countries such as the US can provide assistance mainly to a restricted number of new migrants within certain geographic proximity. This is especially true if concentration of migrants in the destination country is not very high.
3.5 The Reflection Problem
As explained by Manski (1993), one issue in identifying and estimating endog-eneous social effects like the network effect is the presence of unobservable cor-related effects. In our framework, it could be the case that unobservable bilateral components will affect the size of the diaspora Mij and the dependent variables. For instance, unobserved cultural proximity between country i and country
j might affect simultaneously the stock of migrants, the current flows of new migrants and their selection. The cross-sectional nature of the data prevents us to estimate directly those unobservable components. Therefore, those effects will be included in the error term, which in turn leads to some kind of omitted vari-able bias and to some correlation between Mij and the error term.
4. Econometric Methods
There are several alternative methods that can be used to estimate the impact of diasporas on migration flows, on their skill composition and on their relative concentration by education. A simple and easy way of estimation the models is OLS, but, high occurrence of zero observations is likely to lead to inconsistent estimates. The use of a log specification drops the zero observations from the sample which is likely to result in biased estimates of the impact of diasporas and other variables on the migration flows and their selection. For instance, it might be the case that there are no migrants from country i to country j because migration costs are too high. In turn, migration costs might be too high because distance is too high and there is no diaspora. In this case, the exclusion of those observations leads to underestimation of the impact of the variables affecting the migration costs such as distance, colonial links, linguistic similarities or diasporas.
4 To be more precise, for the analysis of migration stock, the probability that a given observation will be included in the regression is directly related to the probability of observing a diaspora (either regardless of the skill level, either for a particular skill level) for this country pair. For the migration flows, the probability is exactly the same since we have no case of zero migra-tion flow with positive values of the stock in 1990 and 2000. For the analysis of selecmigra-tion, the probability is related to the existence of a diaspora or at least a skilled diaspora.
5 Since the observed level of diaspora in 1990 is used as a regressor, the use of diplomatic rep-resentation leads to some colinearity problems in the selection equation. In order to mitigate the collinearity problems, it is possible to run Heckman two-step regressions without any additional instrument. As stressed by Wooldridge (2002), the use of an additional instru-ment in the probit equation is not strictly necessary. The drawback of not using an additional instrument is that the Mills ratio might become highly collinear with the explanatory vari-ables of the flow equation, which in turn lowers the significance of the coefficients. This is not the case for most of our regressions.
positive migration flow4. The usual procedure implies the use of an instrument in the probit equation, i.e. a bilateral variable that influences the probability of observing a diaspora between the two countries but does not influence the size of this diaspora. It is obviously extremely difficult to find an instrument that influences, in a sense, the arrival of the first migrant (i.e. the presence of a dias-pora) but not the other migrants (i.e. the size of a diasdias-pora). One possible candi-date is diplomatic representation of the destination country in the origin coun-try. Diplomatic representation might affect the probability of having at least one migrant by setting some kind of threshold on the visa costs faced by the initial migrant. In the absence of any diplomatic representation of country j in country
i, the cost to get a visa can simply be too high so that nobody would consider to migrate to country j. The role of diplomatic representation in the migration process is to a certain extent analogous to the role played by a common religion for trade relationships. As argued by Helpman et al.(2007), a common religion (a proxy of costs of establishing business linkages) affects the extensive margin of trade (i.e. the probability of export) but not the intensive margin (i.e. trade volumes). In regressions (2–3), the use of a two-step Heckman approach yields intuitive results both for the flow and for the selection equation. In particular, for the selection equation, we find that diplomatic representation of country j
in county i tends to positively affect the probability of observing a diaspora of country i in country j. Furthermore, the mills ratio turns out to be significant in the flow equation, suggesting that accounting for a selection bias is important5.
cause of this problem, as mentioned before, is the exclusion of zero observations for the dependent variable. A second reason is that the expected value of the error will depend on the covariates of the model and hence will lead to estima-tion biases of the coefficient. The Poisson soluestima-tion is nevertheless unfeasible for the selection and the concentration analyses. For the selection, the existence of zero values for Mij(h) leads to undefined values for Sij, which cannot be handled by the Poisson approach.
The above mentioned estimation methods do not address one solution pro-posed by Munshi (2003) which is to estimate the effects of Mij by IV. For that purpose, one has to find instruments of Mij, i.e. variables uncorrelated with the flows but that are good predictors of the stocks. Beine et al. (2010) use two instruments. The first is a dummy variable capturing whether the two countries were subject to a temporary guest worker agreement in the 60’s and 70’s. One can expect those guest worker agreements to exert a strong impact on the initial formation of a stock of migrants in the 60’s and the 70’s, hence influencing the stock in 1990. In contrast, it is unclear why those initial agreements (that are no longer valid) would influence the contemporaneous migration flows beyond the impact exerted by the diaspora itself. For instance, it turns out that guest worker agreements did not create any preferential treatment at the level of country pairs in the migration policy. Therefore, it is expected that these guest worker agree-ments are not themselves correlated with the bilateral unobservable components. Examples of such a process are illustrated for instance by the impact of the post-war guest worker agreements between Belgium and Italy or Spain.
models along with IV estimation is proposed by Tenreyro (2009) within the GMM framework. This is relevant only for the size issues but it is nevertheless beyond the scope of this paper.
5. Results
After listing all the potential problems with the data, estimation methods and identification issues, we finally turn to the estimation of the three main equations listed above (2, 3 and 5) which correspond to analysis of the impact of diasporas on the size, skill composition and concentration of migration flows, respectively.
Table 1: Determinants of Migration Flows (1) OLS (2) Heck with (3) Heck w/o (4) Poisson (5) IV Lagged diasp 0.620
(34.35)*** 0.660 (47.97)*** 0.699 (43.91)*** 0.703 (16.20)*** 0.761 (10.92)*** Col links 0.331
(2.45)** 0.219 (2.03)** 0.127 (1.10) –0.312 (1.65)* –0.051 (0.26) language 0.388 (5.20)*** 0.477 (6.71)*** 0.496 (6.48)*** 0.298 (2.53)** 0.234 (2.27)** Log(dist) –0.408 (9.04)*** –0.501 (12.04)** –0.448 (10.69)*** –0.337 (3.28)*** –0.259 (2.84)*** Schengen 0.168 (1.19) 0.257 (2.00) 0.277 (2.02)** 0.061 (0.23) 0.160 (1.11) Constant 3.750 (6.92)*** 2.785 (4.82)*** 2.365 (4.02)*** 3.461 (3.06)*** 2.365 (2.69)
Observations 3608 5610 5760 5374 3486
Mills ratio – – 0.908 (7.60)*** 1.19 (9.35)*** – – – – Robust t statistics in parentheses
* significant at 10%; ** significant at 5%; *** significant at 1%
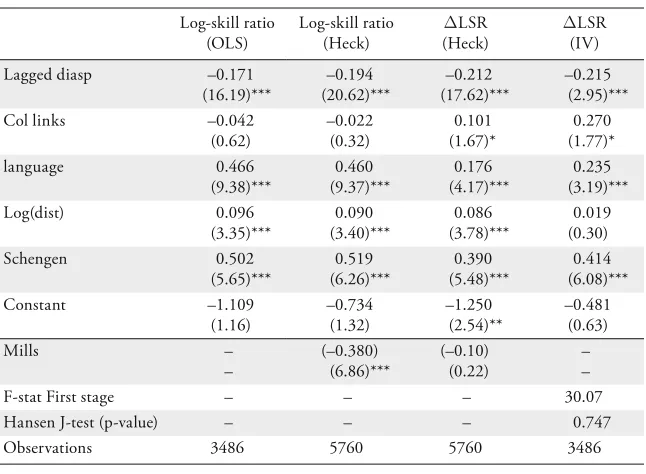
Table 2: Impact of Diaspora on Selection (Level and Change in Log High-Skill/Low-Skill Ratio)
Log-skill ratio (OLS) Log-skill ratio (Heck) %LSR (Heck) %LSR (IV) Lagged diasp –0.171
(16.19)*** –0.194 (20.62)*** –0.212 (17.62)*** –0.215 (2.95)***
Col links –0.042
(0.62) –0.022 (0.32) 0.101 (1.67)* 0.270 (1.77)* language 0.466 (9.38)*** 0.460 (9.37)*** 0.176 (4.17)*** 0.235 (3.19)*** Log(dist) 0.096 (3.35)*** 0.090 (3.40)*** 0.086 (3.78)*** 0.019 (0.30) Schengen 0.502 (5.65)*** 0.519 (6.26)*** 0.390 (5.48)*** 0.414 (6.08)*** Constant –1.109 (1.16) –0.734 (1.32) –1.250 (2.54)** –0.481 (0.63) Mills – – (–0.380) (6.86)*** (–0.10) (0.22) – –
F-stat First stage – – – 30.07
Hansen J-test (p-value) – – – 0.747
Observations 3486 5760 5760 3486
Absolute values of robust t statistics in parentheses
* significant at 10%; ** significant at 5%; *** significant at 1%
Instrument sets for Mij in all columns include a dummy for bilateral guest-worker agreements and
a proxy for diaspora size in 1960.
In column (1) the proxy is computed as ln(popi immstj / distij) (Conf 1i).
In column (2) the proxy is computed as ln(popi immstj / distij) (Conf 2i).
In column (3) the proxy is computed as ln(popi immstj / distij) (Conf 1i Conf 2i).
These results are in line with and confirm the results above concerning the skill selection of the migrants.
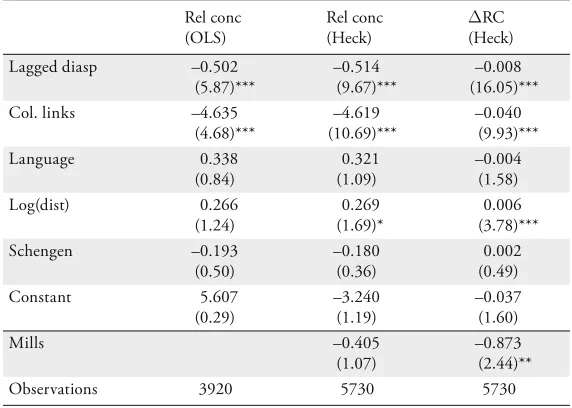
Table 3: Explaining Relative Concentration between High-Skill and Low-Skill and Change in Relative Concentration
Rel conc (OLS)
Rel conc (Heck)
%RC (Heck) Lagged diasp –0.502
(5.87)***
–0.514 (9.67)***
–0.008 (16.05)***
Col. links –4.635
(4.68)***
–4.619 (10.69)***
–0.040 (9.93)*** Language 0.338
(0.84)
0.321 (1.09)
–0.004 (1.58) Log(dist) 0.266
(1.24)
0.269 (1.69)*
0.006 (3.78)*** Schengen –0.193
(0.50)
–0.180 (0.36)
0.002 (0.49) Constant 5.607
(0.29)
–3.240 (1.19)
–0.037 (1.60) Mills –0.405
(1.07)
–0.873 (2.44)**
Observations 3920 5730 5730
Robust t statistics in parentheses
* significant at 10%; ** significant at 5%; *** significant at 1%
6. Conclusion
selection and concentration of the migration flows. The paper also reviews the data and econometric hurdles that the researchers face in assessing the impor-tance of networks. Among the key issues are the choice of individual micro vs aggregate macro approach, the definition of a network, the access to suitable data, and the adoption of econometric methods accounting for the main features of those data, such as wide prevalence of zeros.
The main results are illustrated with estimation results obtained using the Docquier-Lowell-Marfouk (DLM, 2007) data. Larger networks are shown to exert strong positive influence on the size of the international flows and lead to lower skill composition for a given corridor. We also show that diasporas also favour the concentration of the low-skilled migrants with respect to the high-skilled ones. Destination and origin country specific factors are captured via fixed effects. All other bilateral variables, such as linguistic overlap, distance, colonial linkages have the expected signs and economically significant effects.
Naturally, there are many questions remain unanswered. One venue to con-sider is whether if these results hold for non-OECD destination countries and south-south migration. They require higher quality data that covers larger number of destination countries outside the OECD. Another key issue is sepa-rating the assimilation effect of diasporas from the visa effect which operates mainly through the family reunification programs. Such questions will require different types of dataset that combine aggregate data with household level data. In closing, diasporas are among the key determinants of migration patterns and we have only scratched the surface in identifying their effects.
7. References
Bertolini, S. (2009), “Networks, Sorting and Self-selection of Ecuadorian Migrants”, Paper presented at the second TOM Meeting, Louvain-La-Neuve, January.
Borjas, G (1987), “Self-Selection and the Earnings of Migrants”, American Eco-nomic Review, 77 (4), pp. 531–553.
Borjas, G. J. (1994), “The Economics of Immigration”, Journal of Economic Lit-erature, 32, pp. 1667–1717.
Brücker, H. (2006), “International Migration with Heterogenous Agents: Theory and Evidence”, IZA Discussion Paper 2049.
Chiquiar, D. and G. H. Hanson (2005), “International Migration, Self-Selec-tion, and the Distribution of Wages: Evidence from Mexico and the United States”, Journal of Political Economy, 113 (2), pp. 239–281.
Docquier, F., O. Lohest and A. Marfouk (2007), “Brain Drain in Develop-ing Countries”, World Bank Economic Review, 21, pp. 193–218.
Docquier, F. and A. Marfouk (2006), “International Migration by Educa-tional Attainment (1990–2000)”, in C. Ozden and M. Schiff (eds), Interna-tional Migration, Remittances and Development, Palgrave Macmillan: New York (2006), chapter 5.
Docquier, F., B. L. Lowell and A. Marfouk (2007), “A Gendered Assess-ment of Highly Skilled Emigration”, Population and Development Review, 35 (2), pp. 297–321.
Grogger, J., and G. H. Hanson (2010), “Income Maximisation and the Selec-tion and Sorting of InternaSelec-tional Migrants”, Journal of Development Econom-ics, forthcoming.
Helpman, E., M. Melitz and Y. Rubinstein (2007), “Estimating Trade Flows: Trading Partners and Trading Volumes”, NBER Working Paper W12927. Jasso, G., and M. R. Rosenzweig (1986), “Family Reunion and the
Immigra-tion Multiplier: U.S. ImmigraImmigra-tion Law, Origin-Country CondiImmigra-tions, and the Reproduction of Immigrants”, Demography 23 (3), pp. 291–311.
Manski, C. F. (1993), “Identification of Endogeneous Social Effects: The Relec-tion Problem”, Review of Economic Studies, 60 (3), pp. 531–542.
Massey, D. S., J. Arango, G. Hugo, A. Kouaouci, A. Pellegrino and J. E. Taylor (1993), “Theories of International Migration: Review and Appraisal”,
Population and Development Review, 19 (3), pp. 431–466.
McFadden, D. (1984), “Econometric Analysis of Qualitative Response Models”, in: Z. Griliches and M. Intriligator (eds), Handbook of Econometrics, Volume 2, Amsterdam. Elsevier/North-Holland.
McKenzie, D. and H. Rapoport (2007), “Self-Selection Patterns in Mexico-US Migration: The Role of Migration Networks”, Review of Economics and Statistics, forthcoming.
Munshi, K. (2003), “Networks in the Modern Economy: Mexican Migrants in the US Labor Market”, Quarterly Journal of Economics, 118 (2), pp. 549–599. Pedersen, P. J., M. Pytlikova and N. Smith (2008), “Selection and Network
Effects – Migration Flows into OECD Countries 1990–2000”, European Eco-nomic Review, 52 (7), pp. 1160–1186.
Roy, A. D. (1951), “Some Thoughts on the Distribution of Earnings”, Oxford Economic Papers, 3 (2), pp. 135–146.
Santos Silva, J. M. C. and S. Tenreyro (2006), “The Log of Gravity”, Review of Economics and Statistics, 88 (4), pp. 641–658.
Wagner, D., K. Head and J. Ries (2003), “Immigration and the Trade of Prov-inces”, Scottish Journal of Political Economy, 49 (5), pp. 507–525.
Wooldridge, J. M. (2002), Econometric Analysis of Cross Section and Panel Data, MIT Press.
SUMMARY