Original Research Article
Patient-doctor ratio across nine super speciality clinics in government
hospital: a cross sectional study
Avinash Pandey*, Anjana Singh, Shivkant Singh, Amit Kumar
INTRODUCTION
For optimal universal health coverage, both World Health Organisation (WHO) and Planning Commission of India promulgate the ideal doctor population ratio as 1:1000.1,2 Currently, the doctor population ratio of India is 1:2000 with 7.7 doctors per 10,000 population, which is grossly insufficient as per WHO ideal of 23 doctors per 10,000 population.3,4 The above doctor: population ratio is even worse in government hospitals where one doctor works
for 11,000 people.5 Medical graduates at peripheral clinics are trained to handle acute infections and malnutrition, which often require fewer patient visits and has well established, easy to deliver clinical protocols.6 However, with increasing longevity and rise in non-communicable diseases, especially in urban India where patients frequently present with chronic symptoms and multifarious clinical complexity, specialist physician intervention is required to manage and provide optimum continuum of care.7 There is no information regarding real ‘ground-zero’ scenario of patient to doctor ratio in
ABSTRACT
Background: There is lack of information regarding patient-doctor ratio in government hospitals in India. The aim of the present study was to measure patient-doctor ratio across nine super specialty clinics. The objectives were to measure Outpatient department (OPD) patient-faculty and patient-senior resident doctor ratio, to measure number of patients seen per unit time and time spent per patient in OPDs across nine super specialty clinics.
Methods: Total number of OPD patient visits in year 2018 was retrieved for cardiology, gastroenterology, gastrointestinal surgery, neurology, neurosurgery, nephrology, urology, paediatric surgery and oncology. Number of faculties and senior residents working in above specialties were obtained. Ratio of OPD patients to faculties and senior residents across nine above clinics were derived and compared. The average time spend per patient in OPDs across nine above clinics was calculated by number of working days in year 2018 and number of working hours or day in OPD clinics, excluding public holidays.
Results: Total 3,59,099 OPD patient visits were registered in year 2018 across nine super specialty clinics. Patient to faculty ratio was highest for gastroenterology followed by neurology and cardiology, while least for neurosurgery and paediatric surgery in descending order. Gastroenterology, neurology and oncology OPDs saw more than 200 patients per working day; with average time spend per patient consultation was two minutes. Compared to super specialty physicians who spend average of 2.2 minutes per patient consult, surgical disciplines used an average of ten minutes per patient for consultation.
Conclusions: Super specialty clinics in government hospitals are over worked and under staffed with heavy patient load. Multiple parallel clinics in concerned specialty will provide more time and quality of services per patient.
Keywords: Patient doctor ratio, Super specialty, Government hospitals
Department ofMedical Oncology, Indira Gandhi Institute of Medical Sciences, Patna, Bihar, India
Received: 26 July 2019
Revised: 04 September 2019
Accepted: 05 September 2019
*Correspondence:
Dr. Avinash Pandey,
E-mail: [email protected]
Copyright: © the author(s), publisher and licensee Medip Academy. This is an open-access article distributed under the terms of the Creative Commons Attribution Non-Commercial License, which permits unrestricted non-commercial use, distribution, and reproduction in any medium, provided the original work is properly cited.
tertiary government hospitals providing public healthcare in super speciality clinics. We conducted a cross-sectional study across nine major super speciality Outpatient Department Clinics to calculate patient: faculty doctors and patient: senior resident doctor’s ratio working in government hospital. We also derived the average time spend per patient by physicians and surgeons on a typical working day for individual patient consult in busy Outpatient Department Clinics.
METHODS
This study was done on individual consecutive patient database of patients registered from 1st January 2018 till 31st December 2018 in out-patient department (OPD) of
nine super-speciality clinics, namely cardiology,
gastroenterology, gastrointestinal surgery, neurology, neurosurgery, nephrology, urology, paediatric surgery and oncology in Indira Gandhi Institute of Medical Sciences, Patna, Bihar. Our institute in the autonomous apex state government tertiary referral centre for Bihar and above patient database has been made available in public domain which can be easily assessed on institute’s website.8
We contacted the offices of above nine super-speciality clinics to elicit information regarding the number of permanent faculties and their rank along with the strength of senior resident doctors in each above speciality as on 31st December 2018. We calculated the ratio of number of patients seen in OPD clinics in year 2018 in each of the above super-speciality clinics to the permanent faculties and the senior resident doctors of concerned departments.
In order to calculate the average working days and hours spent in OPD clinics by doctors in year 2018, we excluded 52 Sundays and 13 public holidays (on working weekdays) out of 365 days. OPD clinics in our institute runs for 8 hours per day from Monday to Friday, minus one hour lunch break and five hours on Saturdays i.e., forty hours per week. Using above model and total number of working days in year 2018 as 300, the total number of working hours of OPD clinics in year 2018 was 1989.
Total number of patients seen per hour and time given for individual patient consultation was calculated using above indices for each of the nine super-specialties OPD
clinics. We also attempted to deduce the reduction in OPD patient case load per physician or surgeon or OPD clinic if that concerned department runs two parallel simultaneous OPD per day instead of one. Descriptive statistics and frequency distribution was used along with tabulation, summation and multiplication on SPSS software version 17.0, (IBM Corp. Released 2017. IBM SPSS Statistics for Windows, Version 25.0. Armonk, NY: IBM Corp.).
RESULTS
Total 3,59,099 OPD patient visits were registered in year 2018 across nine above super speciality clinics. Gastroenterology (n=64463), followed by neurology (n=62958) and oncology (n=61523) were the busiest clinics in year 2018, while paediatric surgery (n=8218)
and neurosurgery (n=7335) were the least.
Gastrointestinal surgery department had faculty to senior
resident doctor ratio of 1, while cardiology,
gastroenterology, nephrology and urology has more senior residents with above ratio as 0.4, 0.4, 0.8 and 0.85 respectively. Contrary to this, other disciplines had lesser senior resident doctors with faculty to senior resident doctor ratio of 1.25, 2, 2.2 and 2.3 in neurosurgery, neurology, oncology and paediatric surgery respectively.
Largest patient density of cases per faculty was seen in gastroenterology, followed by neurology and cardiology with OPD patient to faculty ratio in above three disciplines as 16115, 15739 and 13451 respectively. Surgical disciplines had lower patient to faculty ratio with neurosurgery and paediatric surgery, the above ratio was 1222 and 1174 respectively. Neurology and oncology with two and five senior resident doctors each were more busy with patient to senior resident doctor ratio of 31479 and 12304 respectively. With lower OPD cases, neurosurgery and paediatric surgery with four and three senior residents has patient to senior resident ratio of 1833 and 2739 respectively. In interdisciplinary
comparison, cardiology, gastroenterology,
gastrointestinal surgery, neurology and nephrology had four faculties each, while urology, neurosurgery, paediatric surgery and oncology had five, five, seven and eleven faculties respectively. Number of senior residents was ten for cardiology and gastroenterology while less than five for gastrointestinal surgery, neurology, neurosurgery, nephrology, paediatric surgery and oncology (Table 1).
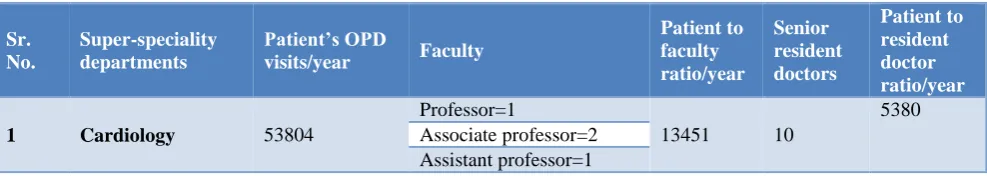
Table 1: Distribution of faculty positions and senior resident doctors across nine super specialities with OPD patient/doctor ratio per year.
Sr. No.
Super-speciality departments
Patient’s OPD
visits/year Faculty
Patient to faculty ratio/year
Senior resident doctors
Patient to resident doctor ratio/year
1 Cardiology 53804
Professor=1
13451 10
5380 Associate professor=2
Sr. No.
Super-speciality departments
Patient’s OPD
visits/year Faculty
Patient to faculty ratio/year
Senior resident doctors
Patient to resident doctor ratio/year
2 Gastroenterology 64463
Professor=1
16115 10 6446
Associate professor=2 Assistant Professor=1
3 Gastrointestinal
surgery 16540
Professor=1
4135 4 4135
Associate professor=1 Assistant professor=2
4 Neurology 62958
Professor=1
15739 2 31479
Associate professor=1 Assistant professor=2
5 Neurosurgery 7335
Professor=2
1222 4 1833
Associate professor=1 Assistant professor=3
6 Nephrology 36347 Professor=1 9086 5 7269
Associate professor=3
7 Urology 47911
Professor=2
7985 7 6844
Associate professor=3 Assistant professor=1
8 Paediatric surgery 8218
Professor=1
1174 3 2739
Additional professor=2 Associate professor=1 Assistant professor=3
9 Oncology (RCC) 61523
Radiotherapy
5593 5 12304
Professor=3
Associate professor=2 Assistant professor=2
Gynaecologic oncology
Additional professor=1
Surgical oncology
Assistant Professor=2
Medical oncology
Assistant professor=1
10 Total 359099 50 7181 50 7181
Table 2: Average patient number seen and time spend per patient across nine super speciality disciplines.
Sr. No. Super-specialty departments
OPD patients/ working hour#
Time (minutes) spend per patient consultation
OPD patients/ working day for single speciality OPD/day @
OPD patients/ working day for two per
speciality OPD/day
1 Cardiology 27 2.2 189 94
2 Gastroenterology 32 1.8 224 112
3 Gastrointestinal surgery 8 7.5 56 28
4 Neurology 32 1.8 224 112
5 Neurosurgery 4 15 28 14
6 Nephrology 18 3.3 126 63
7 Urology 24 2.5 168 84
8 Paediatric surgery 4 15 28 14
9 Oncology 31 1.9 217 108
With respect to average number of OPD patients seen per working hour in a day, gastroenterology, neurology and oncology saw more than thirty patients in an hour. Among surgical disciplines, the busiest was urology with more than twenty four patients per hour followed by gastrointestinal surgery with eight patients per hour. Neurosurgery and paediatric surgery departments saw four patients per hour. Similarly, time spend per patient consult was less than two minutes for gastroenterology, neurology and oncology, while paediatric surgery and neurosurgery spend more than fifteen minutes per patient consult. Compared to super speciality physicians who spend average of 2.2 minutes per patient consult, surgical disciplines used an average of ten minutes per patient for consultation. At above rate, gastroenterology, neurology and oncology saw more than 200 patients per working day if they conducted only single OPD in a day. This number goes down to half and one-third if simultaneous two or three parallel OPDs are run for each speciality respectively (Table 2).
DISCUSSION
The government and public hospitals are boon for India where subsidized yet accessible healthcare facility exists especially for poor, marginalised and lower middle class population at public expenditure. Due to this, often there is overwhelming influx of patients presenting with symptoms ranging from benign chronic illness to complex multi-systemic acute sufferings vying for limited beds and scarce time of health personnel. India has severe shortage of human resources in healthcare and it is not uncommon that personalised care and attention by doctors is suboptimal due to inexorable constraints of time and workforce and sheer magnitude of patients waiting to seek attention.3,9 This causes unnecessary
stress and strain on already compromised health-force in India and invokes untoward hostility and violence against doctors.10
Stress among Indian physicians is quite common, with 40% under moderate to severe stress.11,12 This is more frequent among younger faculties, government hospital doctors and in clinical disciplines.13,14 Doctors working in government sector have more job security, but it comes at the cost of poor financial rewards and higher strain while working with compromised infrastructure and strenuous workload.15 This concern is more profound for young resident doctors who often work extended odd hours with limited resources often at peril of their mental health and well-being.16,17 It is also not uncommon to see burnout among physicians due to chronic persistent stress especially in disciplines such as oncology.18,19 Moreover, shortage of time with urgency to finish work on schedule may lead to inadvertent errors in prescription of physicians and skill of surgeons, which may compromise outcomes and rarely lead to death. There is lack of information regarding patient to doctor ratio among government hospitals in India.
In our retrospective audit of individual consecutive patients across nine major super speciality departments registered between 1st January 2018 till 31st December 2018, we found that gastroenterology, neurology and cardiology had the poorest patient to faculty doctor ratio far exceeding 13,000. When it comes to patient-senior resident doctor, the ratio is worse for oncology and neurology with ratios exceeding 12,000. With such high ratios and patient burden exceeding more than 60,000 per year for some specialities such as gastroenterology, neurology and oncology, it is alarming to note that the average time spend per patient consultation is as low as 2.2 minutes.
Table 3: Proposal to reduce patient doctor ratio and minimise workplace related stress with optimized clinical approach to enhance therapeutic outcome within time constraints.
1. Individual super speciality should have two or more Outpatient Departments (OPDs) running in parallel every day, with each OPD not catering to more than 40 patients during seven working hours per day.
2. Each super specialist OPD should have at least one experienced faculty, one senior and one junior resident doctor along with one nursing staff. The onus of this lies on the management/administration of parent institute. 3. Experienced faculty must restrict themselves to supervise senior resident doctors and refine their investigation
list and narrow down differential diagnosis after history taking and clinical examination to achieve prompt provisional diagnosis in order to save time and resources.
4. All investigations and treatment prescribed to patients must preferably follow an expert consensus checklist and well established standard basic clinical protocols refined from evidence based guidelines to minimize error and optimise time.
5. Senior Resident doctors should triage very sick patients and those requiring urgent medical attention from routine patients and present to experienced faculties on priority to minimise casualties.
6. Institute should conduct regular workshops for workplace stress management and offer to facilitate for leisure time and space for faculties and resident doctors.
As per the best available knowledge to authors, this is the first study reported from India which deducts the average time spend by expert faculties across nine major super speciality disciplines in a busy tertiary government apex
consult in government hospitals abound with scarce infrastructure and manpower for prompt disposal. On the contrary from patient’s perspective, the exhausted and strained specialities from which they seek benevolent care may offer compromised solutions due to severe time constraints leading to inadvertent errors which may culminate to heightened morbidity and sometimes mortality. There is no uniform single solution to such complex conundrum, however few steps are suggested, which if implemented, may reduce the strain on overburdened healthcare (Table 3).
CONCLUSION
India is a developing country where majority of population seek healthcare solutions at public hospitals. The availability and retention of expert super speciality doctors in government hospitals are suboptimal due to heavy workload, redundant infrastructure and more lucrative private practice avenues outside. One of the best matrix to discover the 'ground -zero' scenario is patient-doctor ratio in such hospitals, which is alarmingly high as per our study. Urgent priority is merited by government to reduce this ratio by appointing and retaining experienced faculties by improving the infrastructure,
remunerations and inculcating ‘doctor-friendly’
environment in otherwise busy and strained tertiary care hospitals in India.
Funding: No funding sources Conflict of interest: None declared
Ethical approval: The study was approved by the Institutional Ethics Committee
REFERENCES
1. World health organization- Health workforce:
achieving the health-related MDGs. Available at: http://www.who.int/hrh/workforce_mdgs/en/. Accessed on 13 April 2019.
2. High Level Expert Group Report on Universal
Health Coverage for India: Planning Commission of
India New Delhi, 2011. Available at:
http://planningcommission.nic.in/reports/genrep/rep _uhc0812.pdf. Accessed on 13 April 2019.
3. Press Information Bureau, Government of India,
Ministry of Health and Family Welfare, 2011. Available at: http://pib.nic.in/newsite/PrintRelease.a spx?relid=77859. Accessed on 13 April 2019.
4. World Health Organisation. Global Health
Observatory data repository. Health Workforce- Medical Doctors. Available at: http://apps.who.Int /gho/data/node.main.HWFGRP_0020?lang=en. Accessed on 13 April 2019.
5. Bagcchi S. India has low doctor to patient ratio, study finds. BMJ. 2015;351:5195.
6. Deo MV. Time to revisit recommendations on
doctor to population ratio in India. J Assoc Physician India. 2016;64:72.
7. World health organization: Non-communicable
diseases and mental health. Global status report on non-communicable diseases, 2010. Available at: http://www.who.int/nmh/publications/ncd_report20 10/en/. Accessed on 13 April 2019.
8. Statistics for year 2018. Indira Gandhi Institute of Medical Sciences. Available at: http://www.igims. org/topics.aspx?mid=Patient%20Care. Accessed on 13 April 2019.
9. Rao M, Rao KD, Kumar AS, Chatterjee M,
Sundararaman T. Human resources for health in India. Lancet. 2011;377(9765):587-98.
10. Ambesh P. Violence against doctors in the Indian subcontinent: a rising bane. Indian Heart J. 2016;68(5):749-50.
11. Amte R, Munta K, Gopal PB. Stress levels of critical care doctors in India: a national survey. Indian J Critical Care Med. 2015;19(5):257.
12. Baba I. Workplace stress among doctors in
government hospitals: an empirical study. Int J Multidisciplinary Res. 2012;2(5):208-20.
13. Bhattacherjee S, Ray K, Roy JK, Mukherjee A, Roy
H, Datta S. Job satisfaction among doctors of a government medical college and hospital of Eastern India. Nepal J Epidemiol. 2016;6(3):596.
14. Agarwal M, Sharma A. Effects of hospital
workplace factors on the psychological well-being and job satisfaction of health care employees. J Health Manag. 2011;13(4):439-61.
15. Purohit B, Bandyopadhyay T. Beyond job security and money: driving factors of motivation for government doctors in India. Human Resources for Health. 2014;12(1):12.
16. Ratnakaran B, Prabhakaran A, Karunakaran V.
Prevalence of burnout and its correlates among residents in a tertiary medical center in Kerala, India: a cross-sectional study. J Postgraduate Med. 2016;62(3):157.
17. Azhar GS, Azhar AZ, Azhar AS. Overwork among
residents in India: a medical resident's perspective. J Fam Med Prim Care. 2012;1(2):141.
18. Bhutani J, Bhutani S, Balhara YP, Kalra S.
Compassion fatigue and burnout amongst clinicians: a medical exploratory study. Indian J Psycholog Med. 2012;34(4):332.
19. Alacacioglu A, Yavuzsen T, Dirioz M, Oztop I, Yilmaz U. Burnout in nurses and physicians working at an oncology department. Psychooncol. 2009;18(5):543-8.