© 2015 IJSRSET | Volume 1 | Issue 5 | Print ISSN : 2395-1990 | Online ISSN : 2394-4099 Themed Section: Science and Technology
Structural Analysis of Cu Doped TiO
2Nanoparticles using
Williamson-Hall Method
L. B. Patle, P. K. Labhane, V. R. Huse, A.L. Chaudhari
*MGSM’s Arts, Science & Commerce College Chopda, Dist. Jalgaon, Maharashtra, India
Corresponding Author :
ABSTRACT
Pure and doped Ti1-xCuxO2 nanoparticle is synthesized by co-precipitation technique successfully with nominal
composite of x=0.0,0.01,0.02 and 0.03 at room temperature.The precursorswere further calcined at500 to 600◦C for 6hrs in furnace which results in the formation of different TiO2 phase compositions. The structural analysis carried
out by XRD (Bruker D8 Cu-Kα1). X-ray peak broadening analysis was used to evaluate the crystalline sizes, the lattice parameters, number of unit cell per particle, c/aratioandVolume of unit cell. The Williamson Hall analysis is used to find grain size and Strain of prepared TiO2 nano particles. Crystalline TiO2 with a Tetragonal Anatase phase
is confirmed by XRD results. The grain size of pure and Cu doped samples were found in the range of 10nm to 18nm. All the physical parameters of anatase tetragonal TiO2 nanoparticles were calculated more precisely using
modified W-H plot a uniform deformation model (UDM). The results calculated were approximately similar with standard values.
Keyword: TiO2; Co-precipitation; Particle Size; W-H analysis
I.
INTRODUCTION
In the recent day’s research activities, semiconductor plays an important roll across the world. As the properties of semiconductors are very much dependent of particle size, hence it is considered as important part of material science and technology [1]. Titanium dioxide is the very popular semiconductor due to its wide band gap (3.3 eV), excellent chemical stability, large exciton binding energy. Titanium dioxide is immensely useful in various applications like gas sensors, solar cell, photocatalytic degradation and photo luminescence etc.The crystal morphology and particle size plays vital role in these applicationswhich have attracted most researchers to synthesis nano-crystalline TiO2 in recent
years. There are various techniques adopted by the researchers to synthesis TiO2 nanoparticles such as
sol-gel, precipitation and hydrothermal etc. The co-precipitation is an alternative, cheap and simple method for preparation of nanostructure TiO2[2]. Ulrich
Gesenhueset.al. represented that the properties of TiO2
depends on various internal and external parameters like: dopants, concentrations of surface hydroxyls, electric surface charges accumulated from different rates of consumption of e− and h+ outside the particle or from acid base reactions of the surface, adsorption of the molecules, etc.[3] Investigations of the influence of dopants on the properties of TiO2 provide huge space for
the researchers.
The crystalline size and lattice strain are mainly extracted from the peak width technique. The light scattering technique, scanning electron microscopy and transmission electron microscopy analysis are the most commonly used techniques for the measurement of particle size. The technique to measure lattice strain is X-ray peak broadening [4-5].
arereported. Further we reported a comparative study of particle size of pure and Cu doped TiO2 nanoparticles
and the strain due to lattice deformation obtained by Uniform Deformation Model (UDM) and Scherer model.
II.
METHODS AND MATERIAL
2.1 Material preparation
Titanium tetra isopropoxide (TTIP) and Copper Acetate reagents of analytical grade withoutfurther purification were used to prepare pure and Cu doped TiO2
nanoparticles. To prepare pure and Cu doped TiO2, TTIP
was dissolved into distilled water for 1M solution with continues stirring for half an hour. Another solution of copper acetate in distilled water was prepared separately for appropriate doping concentration. The solution of copper acetate further added drop wise into TTIP solution for half an hour and the solution was kept for rigorous stirring for 2 hours. The obtained precipitate was filtered and washed with water for several times and found white precipitate. The 30ml H2O2 was further
mixed with white precipitate and got transparent orange solution. This solution was further diluted with distilled water and color changed from orange to yellow. The solution was kept for 2 days for aging and followed by filtering and washing for several times. Then precipitate was dried in air at 100oC and calcined at 500 to 600oC for 6 hours to obtained Cu doped TiO2nanoparticles (x =
0.01.0.02 and 0.03).
2.2 Characterization
The X-ray diffraction data of synthesized pure and Cu doped TiO2 samples were recorded on Bruker D8
Advance Diffractometer with Cu-Kα1 radiation (λ=1.5418 Ǻ) and collected over the range 20°<2θ<80° at room temperature.
III.
RESULTS AND DISCUSSION
3.1 XRD analysis
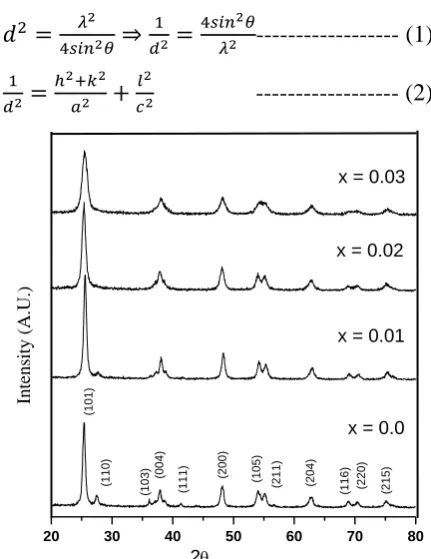
The XRD graphs of Ti1-xCuxO nanoparticles with
concentration x = 0.0, 0.01, 0.02 and 0.03 are shown in figure 1. The XRD analysis were determined by X-ray diffractometer (Bruker D8 Advance Diffractometer) with CuKα radiations (λ = 1.5418 Å) in the2θ range of 20o to 80o at room temperature. The dominant peak is
obtained at 2θ = 25.387 corresponding to (101) plane of TiO2. Rest of the peaks are at 2θ = 37.889, 48.143,
54.131, 55.081, 68.947, 70.365 corresponds to(004),(200),(105), (211), (116) and (220) respectively. These peaks confirm that the prepared TiO2
isanatasetetragonal crystal structure and agree with JCPDS data (73-1764). Further it is observed that in pure TiO2 samples some peaks of rutile structure are
present (2θ = 27.479 and 36.166 corresponds to (110) and (101) respectively is matching with JCPDS data (84-1284)). It may be due to the annealing temperature was at 500oC to 600oC. Yan HuaPeng et.al reported that at 600oC temperature mixture of anatase and rutile phase are present [6].As the Cu concentration increases rutile peaks reduces. It may be due to the active surface area increases by increasing copper concentration and by increasing active surface area rutile converts into anatase phase [7].
The anatase tetragonal lattice parameters such as the distance between adjacent planes in the miller indices ‘d’ (calculated from Braggs equation n𝛌=2dsinθ) and lattice constant ‘a’ and‘c’calculated from Lattice Geometry equation as shown in equation 1 and 2[8]. The lattice parameters of pure and Cu doped TiO2 nanoparticles are
summarized in table 1.
--- (1)
--- (2)
Figure 1: XRD pattern of Ti1-xCuxO2 samples with
concentration x = 0.0, 0.01, 0.02 and 0.03.
20 30 40 50 60 70 80
(2
1
5
)
(1
1
6
)
(1
1
1
)
(1
0
3
)
(2
2
0
)
(2
0
4
)
(2
1
1
)
(1
0
5
)
(2
0
0
)
(0
0
4
)
(1
1
0
)
(1
0
1
)
In
te
n
si
ty
(
A
.U
.)
2
x = 0.0 x = 0.01
x = 0.02 x = 0.03
Figure 2: Lattice parameters ‘a’ and ‘c’ versus Cu
concentration.
The figure 2 shows the plot between lattice parameters ‘a’ and ‘c’ versus Cu concentration.From the plot it is observed that the lattice parameter ‘c’ decreases rapidly upto 1%, then increase upto 2% and then slowly increases. At the same time the lattice parameter ‘a’ slowly increases upto 1%, then rapidly increases upto 2% and then decreases rapidly. The region behind this we have discussed in our previous article [11]. This may be due to the Cu can exist in Cu1+, Cu2+ and Cu3+ ions having ionic radii 0.77Å, 0.73Å& 0.54Å respectively and Ti can exist in Ti2+, Ti3+ and Ti4+ ions having ionic radii 0.86Å, 0.67Å, & 0.69Å respectively. There are random difference between ionic radii of Cu and Ti. The volume of unit cell can be determined by using well known formula
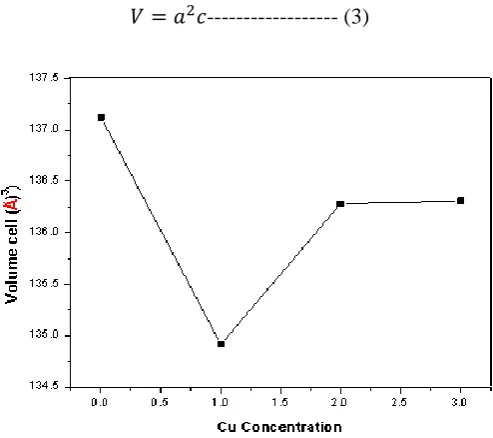
--- (3)
Figure 3: Volume of unit cell versus Cu concentration.
The Volume of unit cell versus Cu concentration is
shown in figure 3. It is observed that the volume of unit
cell decreases rapidly upto 1% of dopant concentration
and then suddenly increases upto 2% and then slightly
increase. This random variation of volume of unit cell
may lead due to the anisotropic nature of TiO2.
The number of unit cell in particle is calculated by using
formula given below [9]:
--- (4)
Where D is particle size and V is volume of the unit cell.
The number of unit cell in particle for pure and Cu
doped TiO2 are listed in table 1.
Table 1: Lattice Parameters of Ti1-xCuxO2 samples with
concentration x =0.0, 0.01, 0.02 and0.03.
Cu Conc.
(x)
d(hkl) at 2θ =25.4
Lattice parameter
in (Å)
c/a rati o
No. of unit
cell per parti cle
Volu me in
(Å)3
a c
0.00 3.505 569
3.77 70
9.61 19
2.54 49
6.524 2
137.1 208
0.01 3.495 683
3.77 75
9.45 47
2.50 29
6.600 5
134.9 139
0.02 3.513 055
3.77 98 9.53
90 2.52
37
8.837 3
136.2 826
0.03 3.503 126
3.77 54
9.56 31
2.53 30
12.25 66
136.3 090
3.2 Particle size and strain
3.2.1 Debye Scherer method
The particle size and lattice strain of the pure and Cu doped TiO2 sample were calculated by the x-ray line
broadening technique using Debye Scherer equation below:
-1 0 1 2 3 4
3.775 3.776 3.777 3.778 3.779
3.780 a
c
Cu Concentration
L
a
tt
ic
e
p
a
ra
m
e
te
r
a
(
Å
)
9.44 9.46 9.48 9.50 9.52 9.54 9.56 9.58 9.60 9.62 9.64
L
a
tt
ic
e
p
a
ra
m
et
er
c
(
Å
--- (5)
Where D is the particle size in nanometer, 𝛌 is the wavelength of the radiation (λ = 1.5418Å), k is a constant (0.94), β is the peak width at half maximum (FWHM) in radian and θ is the peak position. Theparticle size (D) and strain were calculated for the major XRD peak (101) using the Scherer’s formula (5).The particle size and strain were calculated for pure and Cu doped TiO2 samples are listed in Table 2.
3.2.2 Williamson Hall method
In order to understand the peak broadening with lattice strains, various peaks appeared in the XRD pattern were used. The Stokes and Wilson [12] formula given in equation (6) were used to calculate the strain induced broadening of the Bragg’s diffraction peak.
---(6)
In addition of Scherer equation and equation (6) results in following equations [8]:
--- (7)
--- (8)
Rearranging the equation (8) gives:
( ) --- (9)
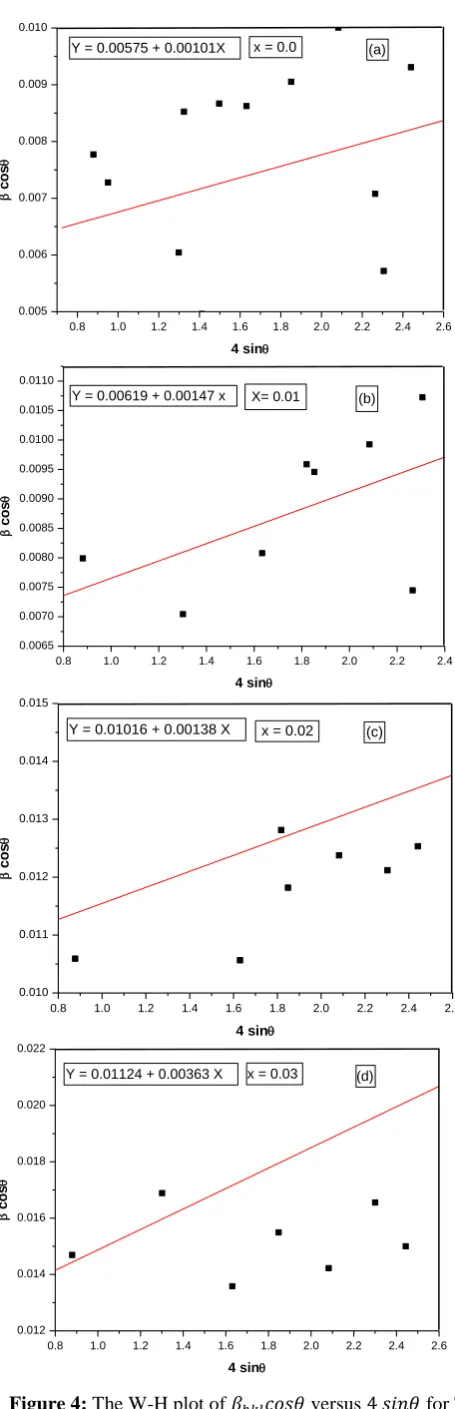
The W-H plot of versus for Ti1-xCuxO
samples with concentration x = 0.0, 0.01, 0.02 and 0.03 are shown in figure 4 (a, b, c and d). It is well known that, in the absence of strain in broadening of peak, the
versus plot is expected to be a
horizontal line parallel to the 4sinθ axis and in the presence of strain in broadening of peak, it should have a non – zero slope. The obtained values of grain size and strain induced in the broadening of the peak are tabulated in table 2. It is observed that the strain values are varying randomly. This may be due to the increment in number of unit cell per particle as a result of substitution of Cu1+, Cu2+ and Cu3+ ions in Ti site.
Figure 4: The W-H plot of versus for Ti
1-Cu O samples.
0.8 1.0 1.2 1.4 1.6 1.8 2.0 2.2 2.4 2.6
0.005 0.006 0.007 0.008 0.009 0.010
(a) x = 0.0
c
o
s
4 sin
Y = 0.00575 + 0.00101X
0.8 1.0 1.2 1.4 1.6 1.8 2.0 2.2 2.4
0.0065 0.0070 0.0075 0.0080 0.0085 0.0090 0.0095 0.0100 0.0105 0.0110
(b) X= 0.01
c
o
s
4 sin
Y = 0.00619 + 0.00147 x
0.8 1.0 1.2 1.4 1.6 1.8 2.0 2.2 2.4 2.6
0.010 0.011 0.012 0.013 0.014 0.015
(c) x = 0.02
c
o
s
4 sin
Y = 0.01016 + 0.00138 X
0.8 1.0 1.2 1.4 1.6 1.8 2.0 2.2 2.4 2.6
0.012 0.014 0.016 0.018 0.020 0.022
(d) x = 0.03
c
o
s
4 sin
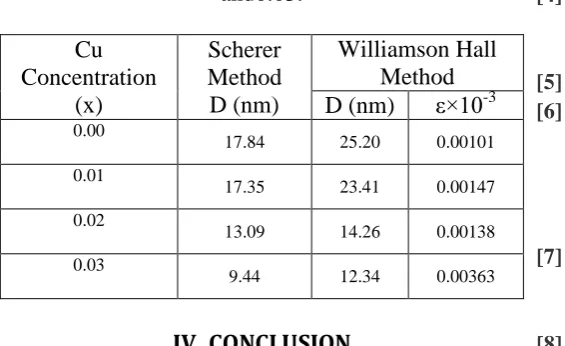
Table 2:
Geometric parameters of Ti
1-xCu
xO
2samples with concentration x =0.0, 0.01, 0.02
and0.03.
Cu
Concentration
(x)
Scherer
Method
D (nm)
Williamson Hall
Method
D (nm)
ε×10
-3 0.0017.84 25.20 0.00101 0.01
17.35 23.41 0.00147 0.02
13.09 14.26 0.00138 0.03
9.44 12.34 0.00363
IV.
CONCLUSION
It is summarizing that using the co-precipitation
method we have successfully synthesized pure and
Cu doped (x = 0.0, 0.01, 0.02 and 0.03) TiO
2nanoparticles at room temperature. This method is
simple, economic, catalyst free and nontoxic which
makes it suitable for various applications. From the
XRD analysis it is confirmed that all the samples
are good crystalline in nature tetragonal anatase
TiO
2. The lattice parameters calculated are
matching with standard values which agree with
JCPDS data (73-1764). The grain size and lattice
strain calculated by both the techniques are nearly
same.
V.
ACKNOWLEDGMENT
The author would like to thank UGC DAE Indore for the support of XRD characterization.
VI.
REFERENCES
[1] V. D. Mote, Y Purushotham and B.N. Dole, Williamson-Hall analysis in estimation of lattice strain in nanometer-sized ZnO particles, Journal of Theoretical and Applied Physics 2012, 6:6. [2] A.E. Shalan, M.M. Rashad, Incorporation of
Mn2+ and Co2+ to TiO2 nanoparticles and the performance of dye sensitized solar cells, Applied Surface Science 283 (2013) 975-98.
[3] Gesenhues, Al-doped TiO2 pigments: influence of doping on the photocatalytic degradation of alkyd
resins, Journal of Photochemistry and
Photobiology A: Chemistry 139 (2001) 243–251. [4] Ramakanth K, Basics of X-ray Diffraction and its
Application, I.K. International Publishing House Pvt. Ltd., New Delhi (2007).
[5] Ungar, T: J. Mater. Sci. 42, 1584 (2007).
[6] Yan HuaPeng, Gui-fang Huang, Wei Qing Huang,
Visible light absorption and photocatalytic activity of Cr doped TiO2nanocrystal film, Advance
Powder Technology (2010),
doi:10.1016/j.apt.2010.11.006
[7] Akihiko Kudo, Yugo Miseki, Heterogeneous
photocatalyst materials for water splitting, Chem. Soc. Rev., 2009, 38, 253-278
[8] A. Khorsand Zak, W.H Abd. Majid, M.E.
Abrishami, RaminYousefi, X-Ray analysis of ZnO nanoparticles by Williamson Hall nad size strain plot method, Solid Sate Sciences 13 (2011) 251-256.
[9] A.S. Menon, N. Kalarikkal, S. Thomas, Studies on Structural and Optical Properties of ZnO and Mn-doped ZnO Nanopowders,Indian Journal of Nanoscience 1 (2013) 16.
[10] A.M. Abdeen, O.M. Hemeda, E.E. Assem, M.M. El-Sehly,Structural, electrical and transport phenomena of Co ferrite substituted by Cd,Journal of Magnetism and Magnetic Materials 238 (2002) 75.
[11] P. K. Labhane, V. R. Huse, L. B. Patle, A. L. Chaudhari, G. H. Sonawane, Synthesis of Cu
Doped ZnO Nanoparticles:Crystallographic,
Optical, FTIR, Morphological and Photocatalytic Study, Journal of Materials Science and Chemical Engineering, 2015, 3, 39-51