Original Research Article
Obesity and associated factors among the residents of field practice area
of urban health centre in North Andhra
Bodhi Sri Vidya Vennam, N. G. Nagamani*, R. V. Manasa, Sanjana P., Prasantha Ratna R.
INTRODUCTION
India is in demographic and health transition period. In this transitional period, where sedentary life style is increasing, dietary patterns are getting changed, obesity is becoming an important public health issue. Obesity especially abdominal/truncal obesity is an important risk factor for cardio-vascular diseases, and other important chronic diseases like diabetes, hypertension etc. According to ICMR –INDIA B (phase-I) study, prevalence of Abdominal as well as generalized obesity were high in India.1
Overweight and obesity is a major public health problem in developing countries around the world.2 In Urban area, according to National Nutrition Monitoring Bureau urban nutrition survey report (2017), almost one third to one
half of the men and women aged more than 18 years were seen suffering from overweight and obesity.2
The study was planned to know the prevalence of obesity and factors associated with obesity among the residents of field practice area of urban health centre. There are some studies where waist circumference has been taken to assess abdominal obesity and in few studies waist hip ratio has been taken to measure abdominal obesity.3-5 Both waist circumference and waist hip ratio is mentioned in the WHO guidelines as parameters for measuring abdominal obesity.2,6 Based on this following objectives were framed.
Objectives
To know the prevalence of obesity in terms of generalized obesity, abdominal obesity.
ABSTRACT
Background: Obesity is becoming an important public health problem in India. The objectives were to know the prevalence of obesity (generalized obesity, abdominal obesity), to know the difference in prevalence of abdominal obesity with respect to waist circumference and waist hip ratio, to know the factors associated with obesity.
Methods: Descriptive cross-sectional study done at field practice area of urban health centre. 306 study subjects (15-65 years) were included into the study. A semi-structured schedule was applied. Body mass index ≥25 kg/m2 was considered as generalized obesity. Waist circumference, waist-hip ratio were calculated.
Results: The prevalence of generalized obesity was 35.6%. Abdominal obesity was rose from 56.2% to 76.1% when waist-hip ratio was taken as parameter instead of waist circumference. Most of the study subjects were not physically active.
Conclusions: The prevalence of obesity is high among study subjects.
Keywords: Generalized obesity, Abdominal obesity, Body mass index, Waist circumference, Waist hip ratio
Department of Community Medicine, GITAM Institute of Medical Science and Research, GITAM University, Visakhapatnam, Andhra Pradesh, India
Received: 03 July 2018
Revised: 07 August 2018
Accepted: 09 August 2018
*Correspondence:
Dr. N. G. Nagamani,
E-mail: [email protected]
Copyright: © the author(s), publisher and licensee Medip Academy. This is an open-access article distributed under the terms of the Creative Commons Attribution Non-Commercial License, which permits unrestricted non-commercial use, distribution, and reproduction in any medium, provided the original work is properly cited.
To know the difference in prevalence of abdominal obesity with respect to waist circumference and waist hip ratio.
To determine the factors associated with obesity.
METHODS
Type of study
Descriptive cross-sectional study.
Study population
Population aged 15-65 years residing at field practice area of Urban health centre, Bheemunipatnam.
Study place
field practice area of Urban Health Centre, Bheemunipatnam
Sample
Sample was calculated based on the formula 4pq/l2. Prevalence was taken as 24.6% (ICMR-INDIA B phase – I study)to calculate sample size. The sample size was calculated as 306.1
Data collection
One ward was selected randomly from field practice area. Data was collected by house to house survey until sample size was met.
Study period
October and November 2017.
Ethical clearance was taken from Institutional ethics committee.
Inclusion criteria
Inclusion criteria were subjects between 15-65 years who are willing to participate in the study.
Exclusion criteria
Exclusion criteria were who are using drugs related to endocrine disorders, and bedridden people.
Study instrument
A semi-structured, pre-designed, pre-tested schedule was applied after taking informed consent from the study participants. It contains questions related to socio-demographic details, factors related to obesity – physical activity, consumption of junk food items like bakery foods, chips, carbonated drinks etc., family history of
obesity, personal history of diabetes & hypertension and anthropometric measurements– weight, height, waist circumference and hip circumference.
Physical activity of 30 min/day at-least 5 days per week has been considered in the present study based on Global recommendations on physical activity for health.7
Usage of junk foods at least three times per week has been taken as definition for this study.
Anthropometric measurements were taken using standardized equipment and procedures. Weight nearest to 0.5 kg and height, waist circumference and hip circumference nearest to 0.2 cm were taken. Body mass index was estimated based on weight and height measurement. Prevalence of generalized obesity was calculated based on WHO guidelines for Asians using body mass index.8 Body mass index ≥25 kg/m2 was considered as generalized obesity. To calculate abdominal obesity both waist circumference and waist hip ratio was used.
Waist circumference was taken at the level of midpoint between the inferior margin of the rib and crest of ileum in the mid-axillary plane, using a non-stretchable measuring tape. Hip circumference was taken around the pelvis at the point of maximal protrusion of the buttocks with the tape parallel to floor.9
Waist circumference ≥90 cm and ≥80 cm for men and women respectively was taken as cutoff points for Abdominal obesity when only waist circumference was considered. Waist hip ratio ≥0.95 and ≥0.80 for men and women respectively was taken as cutoff points for abdominal obesity when both waist and hip circumferences were considered.9,10
Statistical analysis
It was done in terms of percentages and frequency tables. Chi-square test was applied to know statistical significance. SPSS 22 version was used for analysis of data.
RESULTS
The mean age group of study population was 34.9 yrs (S.D 14.92). More than 95% of them belonged to low socio-economic status (based on Government Ration card). Most of the study subjects were females (71.2%) and home makers (Table 1).
The prevalence of generalized obesity (BMI ≥25 kg/m2) was found out as 35.6% among study subjects (Table 2). The mean BMI was 23.73 kg/m2 and SD 5.12.
prevalence of obesity among females and males was 39.4% and 26.1% respectively.
Table 1: Socio-demographic details of study population (n=306).
N (%)
Age in years
≤30 145 (47.4)
31-50 116 (37.9)
>50 45 (14.7)
Gender
Females 218 (71.2)
Males 88 (28.8)
Education
Illiterates 124 (40.5) Primary and high school 116 (37.9) Intermediate and above 66 (21.6)
Occupation
Semiskilled 25 (8.2) Home maker 152 (49.7) Daily wage laborer 72 (23.5) Unemployed 57 (18.6)
Table 2: Body mass index (kg/m2) according to Asia-Pacific guidelines among study subjects (n=306).
Body mass index (kg/m2) N (%)
Obese ≥25 109 (35.6)
Overweight 23–24.99 43 (14.1)
Normal 18.5-22.99 116 (37.9)
Underweight <18.5 38(12.4)
Table 3: Generalized obesity in relation with gender.
Generalized obesity
Yes (%) No (%) Total (%)
Females 86 (39.4)
#
(78.9)##
132 (60.6)
(67.0) 218 (100)
Males 23 (26.1)
(21.1)
65 (73.9)
(33.0) 88 (100)
Total 109 (100) 197 (100) 306
Chi-square value=4.85, df=1, p=0.02. #Horizontal percentages ##Vertical percentages.
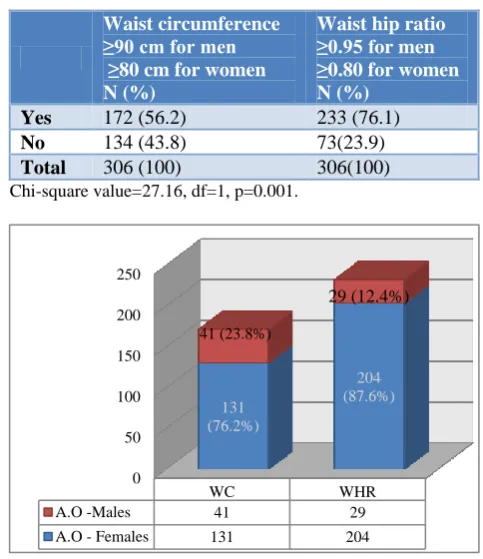
The prevalence of abdominal obesity was found out as 56.2% when waist circumference was taken as parameter. The prevalence rose to 76.1% when Waist hip ratio was taken as parameter (Table 4). The difference was statistically significant (p=0.01).
Prevalence of abdominal obesity was increased from 76.2% to 87.6% among females when Waist-hip ratio was taken as parameter instead of waist circumference. Whereas in males, prevalence of abdominal obesity was decreased from 23.8% to 12.4% if waist-hip ratio was taken as parameter (Figure 1). Abdominal obesity (waist-hip ratio) was more among females than males and it was statistically significant with p value 0.01.
Table 4: Comparison of prevalence of abdominal obesity with respect to waist circumference and waist
hip ratio.
Waist circumference ≥90 cm for men ≥80 cm for women N (%)
Waist hip ratio ≥0.95 for men ≥0.80 for women N (%)
Yes 172 (56.2) 233 (76.1)
No 134 (43.8) 73(23.9)
Total 306 (100) 306(100)
Chi-square value=27.16, df=1, p=0.001.
Figure 1: Comparison of abdominal obesity (AO) based on waist circumference (172) and waist hip
ratio (233) in relation with gender.
Factors related to obesity
Most of the study subjects (73.2%) were not physically active (Table 5).
More than three fourth of (76.4%) of study subjects were not taking junk foods frequently.
Majority (96%) of the study subjects told that they had no family history of obesity or they were not known.
Table 5: Factors related to obesity in proportions.
N (%)
Physical activity
Yes 82 (26.8)
No 224 (73.2)
Junk foods
Yes 72 (23.53)
No 234 (76.47)
Family history of obesity
Yes 12 (3.92)
No and not known 294 (96.08)
Known diabetics 8 (2.6)
Known hypertensives 26 (8.5)
0 50 100 150 200 250
WC WHR
A.O -Males 41 29
A.O - Females 131 204
131 (76.2%)
204 (87.6%) 41 (23.8%)
The percentage of known diabetics was 2.6% and all were found with abdominal obesity. The percentage of known hypertensives was 8.5%.
DISCUSSION
This study was done in the field practice area of urban health centre attached to the department of Community Medicine. This Urban health centre is located in a North Andhra town.
Majority of the study subjects were females (71.2%), may be because male members were not there during data collection.
Most of them were belonged to low socio-economic status. Around 40% were illiterates. Nearer to 50% were home makers.
In this study, (Table 2) the prevalence of generalized obesity was 35.6% and over-weight was 14.1%. This study findings are higher than the prevalence quoted by ICMR- INDIA (phase-1) study, in that study conducted by Pradeepa et al, the prevalence of generalized obesity and over-weight was 24.6%, 15.2% respectively in South India.1 A study done by Chaitanya et al, over weight and obesity were higher in the females compared to males, that is similar to the finding revealed in our study.11 In our study females were found to be more obese than males (Table 3) which was in lines with the NNMB urban nutritional survey.12 In the NNMB study it was found that the prevalence rate of obesity was 35.2% and 43% in men and women respectively in Andhra Pradesh, but in this study the prevalence of obesity among men and women was 26.1% and 39.4% respectively (Table 3).
The prevalence of abdominal obesity in this study was 56.2% (waist circumference only) and 76.1% (waist-hip ratio) (Table 4). Gupta et al in their study it was mentioned that prevalence of abdominal obesity was higher when waist-hip ratio has taken when compared to the prevalence of abdominal obesity calculated with waist circumference alone.6 This was similar to the finding in the present study.
It was statistically significant that prevalence of abdominal obesity (waist-hip ratio) was higher among females (87.6%) when compared to males (12.4%) (Figure 1). Other studies in India have also shown that more prevalence of abdominal obesity was found in women than men.13,14
Most of the study subjects (73.2%) were found to be physically inactive even though other factors like usage of junk foods and family history of obesity, known diabetics, hypertensives were less.
Little et al in their study in rural south India found that more proportion of people were not physically active.15 The similar finding was found in the present study also.
CONCLUSION
The prevalence of generalized and abdominal obesity was higher among women compared to men. The prevalence of abdominal obesity rose in females when waist-hip ratio was taken as parameter instead of waist circumference, whereas it is reduced in males. Majority of the population were physically inactive.
Recommendations
Awareness about obesity has to be created in the community in terms of abdominal obesity and importance of physical activity.
Limitation of study
Less number of males was covered in the study as it was conducted during working hours.
Funding: No funding sources Conflict of interest: None declared
Ethical approval: The study was approved by the Institutional Ethics Committee
REFERENCES
1. Pradeepa R, Anjana RM, Joshi SR, Bhansali A, Deepa M, Joshi PP, et al. Prevalence of generalized & abdominal obesity in urban & rural India- the ICMR - INDIAB Study (Phase-I) [ICMR - INDIAB-3]. Indian J Med Res. 2015;142(2):139-50. 2. National Nutrition Monitoring Bureau third repeat rural survey. Available at: http://nnmbindia.org/ 1_NNMB_Third_Repeat_Rural_Survey_Technical _Report_26.pdf. Accessed on 24 December 2017. 3. Mendagudli RR, Akka KD, Dorle AS, Nigudgi SR.
A Cross Sectional Study of Behavioral Risk Factors of Coronary Heart Disease among the Rural Population of Karnataka, South India. National J Community Med. 2017;8(5):219-24.
4. Sanjay TV, Arun Kumar DP, Madhusudan M. Prevalence and Determinants of Obesity among Elderly in an Urban Area of Bengaluru. National J Community Med. 2017;8(11):369-72.
5. Padmanabha UR, Nalam U, Badiger S, Nagarajaiah P. Prevalence and Risk Factors of Type 2 Diabetes Mellitus in the Rural Population of Mangalore, South India. National J Community Med. 2017;8(8):456-61.
7. Global Recommendations on Physical Activity for Health–WHO guidelines 2010. Available at: http://apps.who.int/iris/bitstream/10665/44399/1/97 89241599979_eng.pdf page 26. Accessed on 24 December 2017.
8. World Health Organization (WHO 2000): Preventing managing the Global Epidemic, WHO Technical Report Series 894, WHO, Geneva. 9. WHO Expert Consultation. Waist Circumference
and Waist-Hip Ratio Report of a WHO Expert Consultation Geneva. 2008: 8-11. Available from: http://whqlibdoc.who.int/publications/2011/978924 1501491_eng.pdf. Accessed on 04 January 2018. 10. The Asia Pacific perspective: redefining obesity
and its treatment. Regional Office for the Western Pacific (WPRO), World Health Organization. International Association for the Study of Obesity and the International Obesity Task Force: St Leonards, Australia; Health Communications Australia Pty Limited; 2000:22–9.
11. Gujjarlapudi C, Prabakaran J, Dulipala P, Rao J. Risk factors for Non Communicable Diseases among people aged above 30 years in an urban slum
of Guntur city - A cross sectional Study. National J Res in Community Med. 2016;5(4):288-93.
12. National Nutrition Monitoring Bureau Urban Nutrition Survey. Available at: http://www.ninindia. org/NNMB%20Urban%20Nutrition%20Report%20 -Brief%20report.pdf Brief Report on urban nurtition_27.pdf. Accessed on 24 December 2017. 13. Kalra S, Unnikrishnan AG. Obesity in India: The
weight of the nation. J Med Nutr Nutraceut 2012;1:37-41.
14. Mohan V, Deepa R. Obesity & abdominal obesity in Asian Indians. India J Med Res. 2006;123:593-6. 15. Little M, Humphries S, Patel K, Dewey C. Factors
associated with BMI, underweight, overweight, obesity among adults in a population of rural South India: a cross sectional study. BMC Obes. 2016;3:12.