ISSN: 2372-5060 (Print), 2372-5079 (Online) Copyright © The Author(s). All Rights Reserved. Published by American Research Institute for Policy Development DOI: 10.15640/ijhs.v3n3a2 URL: http://dx.doi.org/10.15640/ijhs.v3n3a2
Social Vulnerability and Obesity among U.S. Adults
Ruopeng An
1& Xiaoling Xiang
2Abstract
Obesity is a leading risk factor for morbidity and premature mortality. As a key indicator for public health preparedness, elevated social vulnerability may result in increased individual frailty. This study examined the relationship between residential county social vulnerability and overweight/obesity among U.S. adults.Individual-level data (661,360 adults residing in 2,250 counties) came from the Behavioral Risk Factor Surveillance System 2011 and 2012 surveys. County-level social vulnerability was measured by the Social Vulnerability Index (SVI) of the Centers for Disease Control and Prevention.Body mass index (BMI) was calculated from self-reported height and weight. Multilevel logistic regressions were performed to examine the associations between SVI quartiles and overweight/obesity.Compared to those residing in counties of the lowest SVI quartile, people living in counties of mid-low, mid-high, and highest SVI quartiles had 5.2% (95% confidence interval = 2.1%-8.4%), 6.8% (3.6%-10.0%), and 9.5% (6.0%-13.0%) higher odds of being overweight or obese (BMI ≥ 25), and 5.1% (1.9%-8.3%), 4.9% (1.8%-8.2%), and 7.1% (3.7%-10.6%) higher odds of being obese (BMI ≥ 30), respectively. Social vulnerability may profoundly impact individuals’ weight -related behaviors and outcomes. SVI could be a useful tool to guild community-based obesity prevention and health promotion initiatives besides its intended use for emergency preparedness.
Keywords: Obesity; Social vulnerability; Multilevel model
Introduction
Obesity is a leading risk factor for many adverse health outcomes such as type 2 diabetes, hypertension, dyslipidemia, coronary heart disease and certain types of cancer [1]. From 1976-1980 to 2011-2012, the prevalence of obesity more than doubled in the U.S. adult population [2,3]. Recent studies examined the profound influence from the “obesogenic” environment on the formation and progression of the obesity epidemic[4]. Social vulnerability, defined as “an environmental condition characterized by a set of factors that make the individual, although stable in his or her family and social setting, particularly susceptible to becoming ill when faced with even minor events”, serves asa key indicator of public health preparedness[5]. It has been hypothesized that an elevated social vulnerability results in increased individual frailty (signs and symptoms that make the individual susceptible to acquiring disease when encountering psychosocial or clinical difficulty) and subsequently, adverse health outcomes [5]. Studies on the societal impact of social vulnerability have long been confined in community resilience when confronted by natural or human-caused disasters or disease outbreaks [6-8]. Emerging evidence reveals poorer health care quality andincreased mortality among regions of high social vulnerability[9-11]. However,little has been investigated on the risk of obesity in relation to residential environment vulnerability status.
1 PhD, Department of Kinesiology and Community Health, College of Applied Health Sciences, University of Illinois at
Urbana-Champaign, 1206 South 4th Street, Champaign, IL, USA, 61820. Email: ran5@illinois.edu, Tel: 1-217-244-0966, Fax:
1-217-333-2766
Multiple mechanisms may potentially link contextual-level social vulnerability to individual-levelunhealthy weight. People residing in regions of high social vulnerability face daily physical, economic, and social barriers that prevent them from engaging in adequate physical activity and healthy diet[12].Specific barriers include but are not limited to built environment (e.g., crowded housing, low street connectivity, broken sidewalks and bike lanes, lacking parks and exercise facilities, etc.), economic environment (high unemployment rate, lacking investment in healthy life-style promotion/education programs and awareness campaigns, lacking law enforcement to reduce crime and make neighborhood a safer place to live and exercise, etc.), and social environment (e.g., language and cultural barriers in minority neighborhoods, lacking community resources to build up capacity, social cohesion and mutual trust, high stress level and self-perceived danger, etc.)[13]. Moreover, the impact of social vulnerability on body weight status might differ across population subgroups. Genetically and/or psychosocially more susceptible individuals are more likely to be affected by neighborhood environment with aggravated social vulnerability and disproportionally suffer from its adverse health consequences[14]. The objective of this study is to examine the relationship between residential county social vulnerability and obesity among U.S. adults using data from a nationally representative health survey.To our knowledge, our study serves as the first attempt to explore the potential link between social vulnerability and body weight status. We adopted a multilevel modeling approach that permits simultaneous examination of the effects from county-level and individual-level predictors while accounting for potential correlations of individuals within the same residential county (due to similarities in built environment, culture, local policies, etc.). We assessed potential population heterogeneities in the relationship by gender, age group and race/ethnicity.
Methods
Participants
Individual-level data came from the Behavioral Risk Factor Surveillance System (BRFSS) 2011 and 2012 surveys. The BRFSS is a state-based system of annually repeated cross-sectional telephone surveys that collect information on health risk behaviors, preventive health practices, and health care access primarily related to chronic disease and injury. Detailed information about the BRFSS including questionnaires, sampling design and survey datasets can be found on its web portal (http://www.cdc.gov/brfss/). Among a total of 982,154 adults 18 years of age and above who participated in the BRFSS 2011 and 2012 surveys, the following individuals were excluded from the analyses: missing data on residential county, 101,263; missing data on self-reported body height/weight, 43,002; and missing data on other individual characteristics (sex, age, race/ethnicity, education, marital status, employment status, annual household income, smoking status, leisure-time physical activity, general health status, disability status, and chronic condition diagnoses), 176,529. The remaining 661,360 survey participants were included in the final sample. Measures of Body Weight Status
Body mass index (BMI) was calculated based on self-reported height and weight (weight in kilograms [km] divided by height in meters squared [m2]). In accordance with the international classification of body weight status for
adults, overweight and obesity combined is defined as BMI equal to or greater than 25 kg/m2, and obesity as BMI
equal to or greater than 30 kg/m2.
Individual Characteristics
A dichotomous variable for disability (no disability as the reference group), and eight dichotomous variables for each of the chronic conditions i.e. asthma, depression, chronic obstructive pulmonary disease, kidney disease, skin cancer, other cancer, diabetes and arthritis.
Annual trend and Seasonality
To account for annual trend and seasonal variations in body weight status, multilevel logistic regressions controlled for a dichotomous variable for survey year 2012 (survey year 2011 as the reference group) and 11 dichotomous variables for survey month (January-November, with December as the reference group).
Measure of Social Vulnerability
The Agency for Toxic Substances and Disease Registry of the Centers for Disease Control and Prevention uses the Social Vulnerability Index (SVI) to measure the social vulnerability of U.S. census tracts and counties [15]. The SVI is constructed based on 14 variables at the census tract or county level retrieved from the 2010 U.S. Census (five variables including proportion of people 17 years of age and below, people 65 years of age and above, single parent households with children 17 years of age and below, racial/ethnic minorities, and people living in group quarters) and the American Community Survey 2006-2010 waves (nine variables including proportion of people below poverty level, unemployed, no high school diploma among people 25 years of age and above, people who have limited English proficiency, housing infrastructure with 10 or more units, households that have more people than rooms, mobile homes, no vehicle access, and per capita income). For each of the 14 variables, percentile ranking ranging from zero to one is calculated for every U.S. census tract and county, with higher values indicating greater vulnerability. An overall SVI index is constructed by summing individual variable rankings and calculating an overall percentile ranking. This study classified U.S. counties into four mutually exclusive groups with increasing social vulnerability based on the quartiles of the overall SVI index, with the reference group being counties in the lowest quartile that are least vulnerable to environmental hazards.
Measure of Disaster
The relationship between residential county social vulnerability and body weight status might be confounded by natural or human-caused disasters, because disasters could have more severe health consequences among people residing in counties with higher social vulnerability. We therefore aimed to control the independent association between residential county disaster and self-reported body weight status as well as its potential impact through social vulnerability at the county level (i.e., an interaction between residential county disaster and social vulnerability). Monthly county-level disaster data came from the U.S. Department of Homeland Security Federal Emergency Management Agency (FEMA). The FEMA disaster declarations summary documents all federally declared disasters at the county level since 1953 and group disasters into three major types: major disaster declaration, emergency declaration, and fire suppression or management [16]. Both major disaster and emergency declaration authorize the President to provide supplemental federal disaster assistance, but the event related to the disaster declaration and type and amount of assistance differ. The President can declare a major disaster declaration for any natural event, including hurricane, tornado, storm, high water, wind-driven water, tidal wave, tsunami, earthquake, volcanic eruption, landslide, mudslide, snowstorm, or drought, or, regardless of cause, fire, flood, or explosion, that the President believes has caused damage of such severity that it is beyond the combined capabilities of state and local governments to respond. A major disaster declaration provides a wide range of federal assistance programs for individuals and public infrastructure, including funds for both emergency and permanent work. An emergency declaration can be declared for any occasion or instance when the President determines federal assistance is needed. Emergency declarations supplement state and local efforts in providing emergency services, such as the protection of lives, property, public health, and safety, or to lessen or avert the threat of a catastrophe in U.S. territory. The total amount of assistance provided for a single emergency may not exceed $5 million. A dichotomous variable was constructed for any major disaster or emergency declaration in a county in a specific month/year.
Measure of Urbanicity
The scheme classifies U.S. counties into six mutually exclusive categories: large central metro (counties in metropolitan statistical areas [MSAs] of one million or more population that contain the entire population of the largest principal city of the MSA, or have their entire population contained in the largest principal city of the MSA, or contain at least 250,000 inhabitants of any principal city of the MSA); large fringe metro (counties in MSAs of one million or more population that do not qualify as large central metro counties); medium metro (counties in MSAs of populations of 250,000 to 999,999); small metro (counties in MSAs of populations less than 250,000); micropolitan (counties in micropolitan statistical areas); and noncore (nonmetropolitan counties that do not qualify as micropolitan).
Linkage between Individual-Level and County-Level Data
County-specific data for social vulnerability and urbanicity are constant for the BRFSS survey period (2011-2012) whereas county-specific data for disaster/emergency declaration differ by month/year. Individual characteristics of the BRFSS participants were linked with social vulnerability and urbanicity data by residential county, and with disaster/emergency declaration data by residential county and survey month/year.
Statistical Analysis
Descriptive statistics of survey participants and residential county characteristics were calculated, accounting for the BRFSS sampling design. Multilevel logistic regressions were conducted to examine the relationship between residential county social vulnerability andindividual overweight/obesity status. Multilevel analysis differs from conventional single-level model (e.g., multiple linear or logistic regression) in the following four aspects: it permits simultaneous examination of the effects from group-level (county in this study) and individual-level predictors; it accounts for the potential interdependence of individuals within groups; groups are seen as coming from a larger population of groups rather than as unrelated; and both inter-individual and intergroup variation can be examined [18]. Multilevel models have been increasingly recognized by public health researchers as a useful tool to study micro-level of individuals and macro-micro-level of groups or contexts simultaneously [19. 20]. For multimicro-level analysis involving two levels (e.g. survey participants residing in counties), the model can be presented as a two-stage system of equations where individual variation within each group is explained by an individual-level equation, and the variation across groups in the group-specific regression coefficients is explained by a group-level equation. Let denote the probability of being overweight/obese for individual residing in county . The logit function of the probability at the first stage (individual level) is given by:
= + (Equation 1)
where is a county-specific intercept, and a vector of regression coefficients corresponding to the effects of individual-level covariates (participants’ characteristics and survey month/year). In the second stage (county level), the county-specific intercept defined in Equation 1 is modeled as a function of county-level variables:
= + + (Equation 2)
where is a vector of regression coefficients corresponding to the effects of county-level characteristics (social vulnerability, disaster/emergency declaration, and urbanicity), and an independent and identically distributed error term. In a main effect model, is an additive function of social vulnerability, disaster/emergency declaration and urbanicity without an interaction term. In an interaction model, is an additive function of social vulnerability, disaster/emergency declaration and urbanicity, plus interaction terms between each level of social vulnerability and disaster/emergency declaration. As none of the interaction terms were statistically significant at P < 0.05, we decided to report outcomes from main effect models only. In the above two-level logistic model, individuals residing in the same county are assumed to be correlated because they share the county-specific intercept . If observations within a county are independent of one another, a multilevel model will collapse to a single level model, and we can estimate a conventional logistic regression instead. As a single level model is nested in its multilevel counterpart, a likelihood ratio test can be applied to test the assumption of within-group interdependence in the multilevel model. Separate two-level logistic regressions were conducted on the two dichotomous outcome variables, namely overweight and obesity combined (BMI ≥ 25) and obesity (BMI ≥ 30). In subgroup analyses, multilevel
To test for the statistical significance in the differences of the estimated effects across subgroups, we included interactions between each other covariate and the subgroup indicator variable in the model. Among all age-eligible (18 years of age and above) participants in the BRFSS 2011 and 2012 surveys, 10.31% and 22.35% of them were excluded from the analyses due to missing data on residential county and individual characteristics, respectively. Data on residential state and survey month/year were complete for all participants. Two sets of sensitivity analyses were conducted: in the first trial, we replaced each missing county identifier with the county’s corresponding state monthly average characteristics (social vulnerability, disaster/emergency declaration, and urbanicity) and re-estimated the multilevel logistic model; and in the second trial, we only controlled for survey month/year in the regression but left all other individual characteristics uncontrolled. The estimated effects of social vulnerability on overweight/obesity from both sets of sensitivity analyses were fairly comparable with that obtained from the model using only the complete sample, indicating the limited impact of missing data on model estimation. All statistical analyses were performed in SAS 9.3 version (SAS Institute, Cary, NC). Multilevel logistic models were estimated using the GLIMMIX procedure.
Results
Table 1 reports descriptive statistics of the study sample and residential county characteristics. Nearly two-thirds (64.71%) of survey participants were overweight or obese (BMI ≥ 25) and less than a third (28.64%) were obese
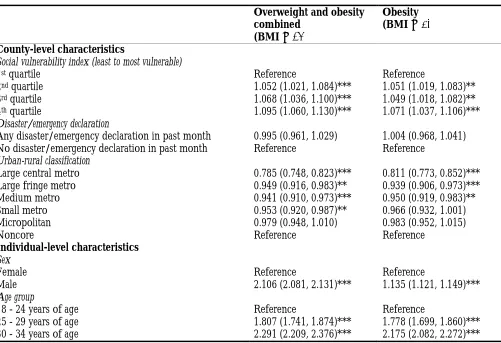
(BMI ≥ 30). Nearly a quarter (23.30%) of survey participants reported no leisure-time physical activity in past month and over a fifth (22.03%) had a disability. Nearly one in seven (14.34%) residential counties had a SVI in the first quartile or lowest social vulnerability category, whereas over a quarter (27.42%) had a SVI in the fourth quartile or highest social vulnerability category. Slightly over one in fifty (2.16%) residential counties had a disaster/emergency declaration during the study period from 2010 to 2011. Table 2 reports the estimated odds ratios of overweight/obesity in multilevel logistic regressions. Residential county social vulnerability positively predicted overweight/obesity. Compared to those residing in counties of the lowest SVI quartile, people living in counties of mid-low, mid-high, and highest SVI quartiles had 5.2% (adjusted odds ratio [AOR] = 1.052, 95% confidence interval [CI] = 1.021, 1.084), 6.8% (AOR = 1.068, 95% CI = 1.036, 1.100), and 9.5% (AOR = 1.095, 95% CI = 1.060, 1.130) higher odds of being overweight or obese (BMI ≥ 25), respectively, and 5.1% (AOR = 1.051, 95% CI = 1.019, 1.083),
4.9% (AOR = 1.049, 95% CI = 1.018, 1.082), and 7.1% (AOR = 1.071, 95% CI = 1.037, 1.106) higher odds of being obese (BMI ≥ 30), respectively.People residing in major urban areas (i.e., large central metros, large fringe metros, and
medium metros) tended to have lower overweight/obesity rate compared to those residing in rural areas (i.e., noncores). Presence of major disaster/emergency in a residential county was not found to be associated with overweight/obesity risk.The likelihood ratio tests were highly significant, indicating a multilevel logistic model was preferred to its single-level counterpart because it accounted for the similarities (correlations) of individuals residing in the same county.
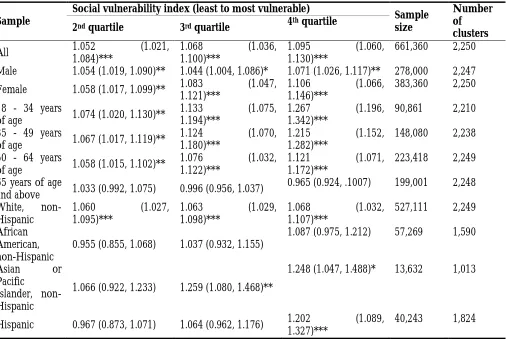
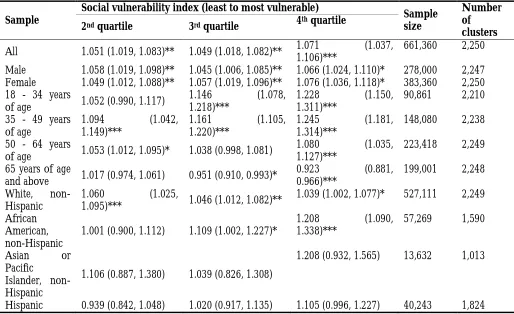
Table 3 and 4 report results from subgroup analyses for overweight and obesity combined (BMI ≥ 25) and obesity (BMI ≥ 30), respectively. As Table 3 shows, the positive association between residential county social
vulnerability andoverweight and obesity combined (BMI ≥ 25) was to some extent larger (although not always
statistically significant) for females, young (18 - 34 years of age) adults, and non-Hispanic Asians, compared to males, older adults, and other racial/ethnic groups. In contrast, no association between residential county social vulnerability and overweight and obesity combined (BMI ≥ 25) was found among adults 65 years of age and above and non-Hispanic African Americans. As Table 4 shows, the positive association between residential county social vulnerability and obesity (BMI ≥ 30) was larger among young to middle-aged adults (35-49 years of age) compared to other age groups; whereas a small but statistically significant negative association between residential county social vulnerability and obesity was observed among adults 65 years of age and above.
Discussion
OneBrazil-based study found that living in regions of a major metropolitan area with high social vulnerability, as assessed by census tract socio-economic condition and family composition, was associated with poor self-rated health [21]. Existing studies on the link between social vulnerability and health have predominately focused on incidence of infectious diseases, particularly HIV/AIDS, in developing countries [22-25].Social vulnerability has also been consistently linked to mortality among middle-aged and older adults after considering the impact of frailty[9,10,26-28]. Several studies documented the association of high social vulnerability and poor mental health outcomes [29,30]. Regions of high social vulnerability suffered from lower level of mental health resilience and longer recovery time when confronted with disasters [30]. Notably, existing literature primarily focused on vulnerability at the individual or household level, which does not capture the full portrait of social vulnerability in the environment. Population-level or aggregate social indicatorsmay influence health behaviors and/or outcomes independent of individual characteristics [31].
This study adds to the literature by demonstrating the impact of aggregate social indicators at the community level on body weight status. The SVI captures socioeconomic condition, household composition, housing, transportation, and concentration of minority and residents of limited English proficiency in a county.These contextual factors have been individually linked to inadequate physical activity, unhealthy diet, and overweight/obesity[12,32,33]. People living in neighborhoods with low socioeconomic status,high clustering of minority and high population density have reduced access to recreational facilities andhealthy food choices, which discourages them from engaging in regular physical activities and healthy diet[12,32,33]. Residents in communities of higher social vulnerability are also thought to be disproportionately affected by their neighborhood built environmentdue toissues related to safety, transportation, walkability and shopping[34]. This study found that social vulnerability, but not incidence of disasters, was associated with elevated risk for overweight/obesity. This finding could reflect the chronic nature of obesity – accumulation of body fat is mainly affected by persistent rather than temporary vulnerability in an individual’s residential neighborhood. Mechanic and Tanner [35]distinguished between events that lead to temporary versus persistent vulnerability. A majority of acute natural and human-caused disasters aretemporary events that overtax communities’ resources and coping capacities for a limited time. In contrast, SVI captures long-term adversities such as persistent poverty and chronic unemployment that cannot be mediated in a short time horizon and profoundly impact local people’s health in the long term. In this study, the association of SVI and body weight status tended to be stronger for females, non-Hispanics Asians, and young adults. Sex differences in the association between social vulnerability and health outcomes have been reported in previous studies. In a Canadian study of community-dwelling older adults, women had higher level of social vulnerability compared to their male counterparts [9]. They found that although women had a longer life expectancy overall, high social vulnerability appeared to offset this sex benefit, reducing the life expectancy of women with high social vulnerability to resemble that of men with low social vulnerability [9].
A few limitations of this study should be noted. Although the SVI is constructed using multiple dimensions of social vulnerability, it is not a comprehensive list of main indicators for social vulnerability. Many other key factors that determine social vulnerability such as information dissemination (e.g., digital divide), built infrastructure (e.g., parks and bike lanes), safety, social capital and resource (e.g., rehabilitation services), etc., are not captured by the SVI [13]. Moreover, SVI is an aggregate measure of social indicators at the community level and consisted of several different dimensions. We could not elucidate which dimensions of SVI contribute to obesity or to what extent each dimension is associated with body weight status. In addition, body weight status isclassified based on self-reported weight and height and subject to reporting error and social desirability bias [40]. Although there was a clear time order between measure of SVI (constructed using data from 2010 and before) and body weight status (measured in 2011 and 2012), findings based on data from observational surveys cannot be interpreted as causality. Finding from this study indicatesthat community-level social vulnerability may affect obesity independent of personal characteristics. SVI could be a useful tool to guild community-based obesity prevention and health promotion initiatives besides its intended use for emergency preparedness. The current health preparedness system is largely built around meeting temporary needs of individuals and communities [35]. Our study highlights the importance of designing policy interventions that address persistent social vulnerability in communities. Moreover, future studies are called to explore the key mechanisms through which community-level social vulnerability impact individuals’ health outcomes.
References
Must, A., Spadano, J., Coakley, E. H., Field, A. E., Colditz, G., & Dietz, W. H. (1999). The disease burden associated with overweight and obesity. Journal of the American Medical Association, 282, 1523-1529.
An, R. (2014). Prevalence and trends of adult obesity in the US, 1999–2012. ISRN Obesity, 2014. doi:10.1155/2014/185132
Fryar, C. D., Carroll, M. D., Ogden, C. L. (2014). Prevalence of overweight, obesity, and extreme obesity among adults: United States, 1960–1962 through 2011–2012.Retrieved from
http://www.cdc.gov/nchs/data/hestat/obesity_adult_11_12/obesity_adult_11_12.pdf.
Sturm, R., & An, R. (2014). Obesity and economic environments. CA: A Cancer Journal for Clinicians, 64, 337-350. doi:10.3322/caac.21237
Niero, M., &Bertin, G.(Eds.) (2012). Vulnerability and Social Frailty. A Theory of Health Inequalities. Roma, Italy: Franco Angeli.
Adger, N. W. (1999). Social vulnerability to climate change and extremes in coastal Vietnam. World Development, 27, 249-269. doi:10.1016/S0305-750X(98)00136-3
Bergstrand, K., Mayer, B., Brumback, B., & Zhang, Y. (2014). Assessing the relationship between social vulnerability and community resilience to hazards. Social Indicators Research. Advance online publication.
doi:10.1007/s11205-014-0698-3
Paton, D., & Johnston, D. (2001). Disasters and communities: Vulnerability, resilience and preparedness. Disaster Prevention and Management, 10(4), 270-277. doi:10.1108/EUM0000000005930
Andrew, M. K., Mitnitski, A. B., & Rockwood, K. (2008). Social vulnerability, frailty and mortality in elderly people. PloS One, 3(5), e2232. doi:10.1371/journal.pone.0002232
Armstrong, J. J., Andrew, M. K., Mitnitski, A., Launer, L. J., White, L. R., & Rockwood, K. (2015). Social vulnerability and survival across levels of frailty in the Honolulu-Asia Aging Study. Age and Ageing. Advance online publication. doi:10.1093/ageing/afv016
Grabovschi, C., Loignon, C., & Fortin, M. (2013). Mapping the concept of vulnerability related to health care disparities: A scoping review. BMC Health Services Research, 13, 94. doi:10.1186/1472-6963-13-94
Gordon-Larsen, P., Nelson, M. C., Page, P., & Popkin, B. M. (2006). Inequality in the built environment underlies key health disparities in physical activity and obesity. Pediatrics, 117(2), 417-424. doi:10.1542/peds.2005-0058 Cutter, S. L., Boruff, B. J., & Shirley, W. L. (2003). Social vulnerability to environmental hazards. Social Science
Quarterly, 84(2), 242-261. doi:10.1111/1540-6237.8402002
World Health Organization. (2010).Environment and health risks: A review of the influence and effects of social inequalities. Retrieved from http://www.euro.who.int/__data/assets/pdf_file/0003/78069/E93670.pdf Flanagan, B.E., Gregory, E.W., Hallisey, E.J., Heitgerd, J.L, &Lewis, B. (2011).A social vulnerability index for disaster
Federal Emergency Management Agency.(2015). FEMA Disaster Declarations Summary - Open Government Dataset. Retrieved fromhttps://www.fema.gov/media-library/assets/documents/28318
U.S. Department of Health and Human Services, Centers for Disease Control and Prevention, &National Center for Health Statistics. 2013 NCHS Urban-Rural Classification Scheme for Counties. DHHS Publication No. 2014-1366, Hyattsville, Maryland, 2014.
Diez-Roux, A.V. (2000). Multilevel analysis in public health research. Annual Review of Public Health, 21(1), 171-192. Leyland, A.H., & Goldstein, H. (Eds.). Multilevel modeling of health statistics. West Sussex, England: John Wiley &
Sons, Ltd, 2001.
Leyland, A.H., &Groenewegen, P.P. (2003). Multilevel modeling and public health policy. Scandinavian Journalof Public Health, 31(4), 267-274.
Barata, R. B., Ribeiro, M. C., Cassanti, A. C., &Grupo do ProjetoVulnerabilidade Social no Centro de Sao Paulo. (2011). Social vulnerability and health status: A household survey in the central area of a Brazilian metropolis. Cadernos De SaudePublica, 27, S164-S175. doi:10.1590/S0102-311X2011001400005
Kalipeni, E. (2000). Health and disease in southern Africa: A comparative and vulnerability perspective. Social Science & Medicine, 50, 965-983. doi:10.1016/S0277-9536(99)00348-2
Roza, D. L., Caccia-BavaMdo, C., & Martinez, E. Z. (2012). Spatio-temporal patterns of tuberculosis incidence in Ribeirao Preto, State of Sao Paulo, southeast Brazil, and their relationship with social vulnerability: A Bayesian analysis. Revista Da Sociedade Brasileira De Medicina Tropical, 45(5), 607-615.
Smith-Estelle, A., &Gruskin, S. (2003). Vulnerability to HIV/STIs among rural women from migrant communities in Nepal: A health and human rights framework. Reproductive Health Matters, 11(22), 142-151. doi:10.1016/S0968-8080(03)02292-4
Kienberger, S., & Hagenlocher, M. (2014). Spatial-explicit modeling of social vulnerability to malaria in east Africa. International Journal of Health Geographics, 13, 29. doi:10.1186/1476-072X-13-29
Andrew, M. K., Mitnitski, A., Kirkland, S. A., & Rockwood, K. (2012). The impact of social vulnerability on the survival of the fittest older adults. Age and Ageing, 41(2), 161-165. doi:10.1093/ageing/afr176
Andrew, M. K., & Keefe, J. M. (2014). Social vulnerability from a social ecology perspective: A cohort study of older adults from the National Population Health Survey of Canada. BMC Geriatrics, 14, 90. doi:10.1186/1471-2318-14-90
Wallace, L. M., Theou, O., Pena, F., Rockwood, K., & Andrew, M. K. (2014). Social vulnerability as a predictor of mortality and disability: Cross-country differences in the survey of health, aging, and retirement in Europe (SHARE). Aging Clinical and Experimental Research. Advance online publication.doi:10.1007/s40520-014-0271-6
Bilotta, C., Case, A., Nicolini, P., Mauri, S., Castelli, M., & Vergani, C. (2010). Social vulnerability, mental health and correlates of frailty in older outpatients living alone in the community in Italy. Aging & Mental Health, 14(8), 1024-1036. doi:10.1080/13607863.2010.508772
Zahran, S., Peek, L., Snodgrass, J. G., Weiler, S., & Hempel, L. (2011). Economics of disaster risk, social vulnerability, and mental health resilience. Risk Analysis: An Official Publication of the Society for Risk Analysis, 31(7), 1107-1119. doi:10.1111/j.1539-6924.2010.01580.x
Galea, S., Ahern, J., &Karpati, A. (2005). A model of underlying socioeconomic vulnerability in human populations: Evidence from variability in population health and implications for public health. Social Science & Medicine, 60(11), 2417-2430. doi:10.1016/j.socscimed.2004.11.028
Larson, N. I., Story, M. T., & Nelson, M. C. (2009). Neighborhood environments: Disparities in access to healthy foods in the U.S. American Journal of Preventive Medicine, 36(1), 74-81. doi:10.1016/j.amepre.2008.09.025 Singh, G. K., Siahpush, M., & Kogan, M. D. (2010). Neighborhood socioeconomic conditions, built environments,
and childhood obesity. Health Affairs (Project Hope), 29(3), 503-512. doi:10.1377/hlthaff.2009.0730
Papas, M. A., Alberg, A. J., Ewing, R., Helzlsouer, K. J., Gary, T. L., & Klassen, A. C. (2007). The built environment and obesity. Epidemiologic Reviews, 29(1), 129-143. doi:10.1093/epirev/mxm009
Mechanic, D., & Tanner, J. (2007). Vulnerable people, groups, and populations: Societal view. Health Affairs (Project Hope), 26(5), 1220-1230. doi:10.1377/hlthaff.26.5.1220
Newman, A. B., Yanez, D., Harris, T., et al. (2001). Weight change in old age and its association with mortality. Journal of American Geriatrics Society, 49(10), 1309-1318.
Locher, J. L., Roth, D. L., Ritchie, C. S., et al. (2007). Body mass index, weight loss, and mortality in community-dwelling older adults. The Journals of Gerontology Series A: Biological Sciences and Medical Sciences, 62(12):1389-1392.
Saracci, R. (2007). Survival-related biases survive well. International Journal of Epidemiology, 36(1), 244-246.
Kuczmarski, M. F., Kuczmarski, R. J., & Najjar, M. (2001). Effects of age on validity of self-reported height, weight, and body mass index: Findings from the third national health and nutrition examination survey, 1988-1994. Journal of the American Dietetic Association, 101(1), 28-34.doi:S0002-8223(01)00008-6
Table 1: Descriptive Statistics of BRFSS Sample and Residential County Characteristics
Percentage (95% Cl) Individual-level characteristics
Body weight status
Overweight and obesity combined (BMI ≥ 25) 64.71 (64.57, 64.95)
Obesity (BMI ≥ 30) 28.64 (28.42, 28.86)
Sex
Female 49.58 (49.33, 49.82)
Male 50.42 (50.18, 50.67)
Age group
18 - 24 years of age 10.66 (10.46, 10.87)
25 - 29 years of age 7.60 (7.45, 7.76)
30 - 34 years of age 8.99 (8.83, 9.14)
35 - 39 years of age 8.30 (8.15, 8.44)
40 - 44 years of age 10.07 (9.91, 10.22)
45 - 49 years of age 9.23 (9.09, 9.37)
50 - 54 years of age 11.03 (10.88, 11.18)
55 - 59 years of age 8.58 (8.46, 8.70)
60 - 64 years of age 8.11 (8.00, 8.22)
65 - 69 years of age 5.73 (5.64, 5.81)
70 - 74 years of age 4.28 (4.20, 4.35)
75 - 79 years of age 3.52 (3.45, 3.59)
80 years of age and above 3.90 (3.84, 3.97)
Race/ethnicity
White, non-Hispanic 67.94 (67.68, 68.19)
African American, non-Hispanic 11.60 (11.42, 11.77)
Asian or Pacific Islander, non-Hispanic 4.17 (4.03, 4.31)
Other race or multi-race, non-Hispanic 2.79 (2.72, 2.87)
Hispanic 13.51 (13.29, 13.72)
Education
Primary school (8th grade) or lower 3.84 (3.72, 3.97)
Some high school (9th – 11th grade) 9.14 (8.96, 9.31)
High school graduate or equivalent 28.50 (28.28, 28.73)
Some college or equivalent 30.99 (30.76, 31.22)
College graduate or higher 27.53 (27.33, 27.72)
Marital status
Married or living with partner 57.40 (57.15, 57.64)
Divorced or widowed or separated 19.77 (19.60, 19.94)
Never married 22.83 (22.59, 23.08)
Employed 58.31 (58.07, 58.55)
Unemployed for a year or less 3.84 (3.73, 3.95)
Unemployed for over a year 4.11 (4.00, 4.22)
Homemaker 6.10 (5.98, 6.21)
Student 4.97 (4.83, 5.11)
Retired 16.40 (16.26, 16.54)
Unable to work 6.28 (6.16, 6.40)
Annual household income
$10,000 or lower 6.19 (6.05, 6.32)
$10,001 - $15,000 5.79 (5.67, 5.91)
$15,001 - $20,000 8.22 (8.08, 8.37)
$20,001 - $25,000 9.45 (9.30, 9.60)
$25,001 - $35,000 11.12 (10.96, 11.28)
$35,001 - $50,000 14.21 (14.04, 14.38)
$50,001 - $75,000 15.54 (15.36, 15.71)
$75,001 or higher 29.49 (29.27, 29.71)
Current or former smoker
Yes 45.39 (45.15, 45.64)
No 54.61 (54.36, 54.85)
Leisure-time physical activity
Any leisure-time physical activity in past month 76.70 (76.49, 76.91)
No leisure-time physical activity in past month 23.30 (23.09, 23.51)
General health status
Excellent or very good or good 82.83 (82.64, 83.02)
Fair or poor 17.17 (16.98, 17.36)
Disabled currently
Yes 22.03 (21.84, 22.22)
No 77.97 (77.77, 78.16)
Chronic condition diagnosis
Asthma 8.81 (8.67, 8.95)
Depression 17.11 (16.93, 17.29)
Chronic obstructive pulmonary disease 6.40 (6.29, 6.51)
Kidney disease 2.59 (2.51, 2.66)
Cancer (except for skin cancer) 6.58 (6.47, 6.69)
Skin cancer 5.92 (5.84, 6.02)
Diabetes 12.46 (12.31, 12.62)
Arthritis 25.70 (25.51, 25.90)
Survey year
2011 48.56 (48.33, 48.80)
2012 51.44 (51.20, 51.67)
Survey month
January 7.66 (7.53, 7.80)
February 9.35 (9.21, 9.50)
March 9.15 (9.01, 9.39)
April 7.90 (7.77, 8.03)
May 7.49 (7.36, 7.61)
June 8.14 (8.00, 8.27)
July 8.24 (8.11, 8.38)
August 9.20 (9.06, 9.35)
September 7.99 (7.85, 8.13)
October 8.94 (8.80, 9.08)
November 8.41 (8.27, 8.55)
County-level characteristics
Social vulnerability index (least to most vulnerable)
1st quartile 14.34 (14.20, 14.48)
2nd quartile 24.55 (24.36, 24.73)
3rd quartile 33.69 (33.47, 33.91)
4th quartile 27.42 (27.20, 27.64)
Disaster/emergency declaration
Any disaster/emergency declaration in past month 2.16 (2.10, 2.22)
No disaster/emergency declaration in past month 97.84 (97.78, 97.90)
Urban-rural classification
Large central metro 28.84 (28.62, 29.07)
Large fringe metro 24.62 (24.42, 24.82)
Medium metro 21.67 (21.49, 21.85)
Small metro 9.61 (9.50, 9.73)
Micropolitan 9.66 (9.55, 9.77)
Noncore 5.60 (5.51, 5.68)
Notes: Individual-level data (N = 661,360) came from the BRFSS 2011-2012 surveys. The BRFSS sampling design was incorporated in estimating the descriptive statistics. County-level social venerability index (SVI-2010) data came from the CDC (http://svi.cdc.gov/). County-level monthly disaster/emergency declaration data came from the FEMA (https://www.fema.gov/media-library/assets/documents/28318). County-level urban-rural classification data came from the CDC (http://www.cdc.gov/nchs/data_access/urban_rural.htm).
Table 2: Estimated Odds Ratios of Overweight and Obesity in Multilevel Logistic Regressions
Overweight and obesity combined
(BMI ≥ 25)
Obesity (BMI ≥ 30)
County-level characteristics
Social vulnerability index (least to most vulnerable)
1st quartile Reference Reference
2nd quartile 1.052 (1.021, 1.084)*** 1.051 (1.019, 1.083)**
3rd quartile 1.068 (1.036, 1.100)*** 1.049 (1.018, 1.082)**
4th quartile 1.095 (1.060, 1.130)*** 1.071 (1.037, 1.106)***
Disaster/emergency declaration
Any disaster/emergency declaration in past month 0.995 (0.961, 1.029) 1.004 (0.968, 1.041) No disaster/emergency declaration in past month Reference Reference
Urban-rural classification
Large central metro 0.785 (0.748, 0.823)*** 0.811 (0.773, 0.852)***
Large fringe metro 0.949 (0.916, 0.983)** 0.939 (0.906, 0.973)***
Medium metro 0.941 (0.910, 0.973)*** 0.950 (0.919, 0.983)**
Small metro 0.953 (0.920, 0.987)** 0.966 (0.932, 1.001)
Micropolitan 0.979 (0.948, 1.010) 0.983 (0.952, 1.015)
Noncore Reference Reference
Individual-level characteristics
Sex
Female Reference Reference
Male 2.106 (2.081, 2.131)*** 1.135 (1.121, 1.149)***
Age group
18 - 24 years of age Reference Reference
25 - 29 years of age 1.807 (1.741, 1.874)*** 1.778 (1.699, 1.860)***
35 - 39 years of age 2.613 (2.520, 2.710)*** 2.400 (2.299, 2.507)***
40 - 44 years of age 2.711 (2.616, 2.810)*** 2.346 (2.248, 2.448)***
45 - 49 years of age 2.722 (2.627, 2.820)*** 2.242 (2.150, 2.339)***
50 - 54 years of age 2.736 (2.643, 2.833)*** 2.142 (2.054, 2.233)***
55 - 59 years of age 2.766 (2.672, 2.864)*** 2.007 (1.925, 2.093)***
60 - 64 years of age 2.830 (2.731, 2.933)*** 1.954 (1.873, 2.039)***
65 - 69 years of age 2.742 (2.641, 2.847)*** 1.725 (1.650, 1.803)***
70 - 74 years of age 2.466 (2.370, 2.566)*** 1.430 (1.365, 1.499)***
75 - 79 years of age 1.964 (1.874, 2.037)*** 1.045 (0.995, 1.098)
80 years of age and above 1.267 (1.216, 1.320)*** 0.592 (0.563, 0.623)***
Race/ethnicity
White, non-Hispanic Reference Reference
African American, non-Hispanic 1.890 (1.846, 1.935)*** 1.639 (1.605, 1.675)*** Asian or Pacific Islander, non-Hispanic 0.534 (0.513, 0.555)*** 0.442 (0.418, 0.467)*** Other race or multi-race, non-Hispanic 1.174 (1.139, 1.211)*** 1.119 (1.084, 1.154)***
Hispanic 1.379 (1.344, 1.415)*** 1.089 (1.061, 1.118)***
Education
Primary school (8th grade) or lower Reference Reference
Some high school (9th – 11th grade) 0.976 (0.932, 1.022) 0.982 (0.940, 1.027)
High school graduate or equivalent 1.030 (0.989, 1.073) 0.985 (0.947, 1.025)
Some college or equivalent 1.004 (0.963, 1.046) 0.986 (0.948, 1.027)
College graduate or higher 0.752 (0.721, 0.784)*** 0.740 (0.710, 0.770)***
Marital status
Married or living with partner Reference Reference
Divorced or widowed or separated 0.892 (0.880, 0.905)*** 0.938 (0.924, 0.952)***
Never married 0.915 (0.898, 0.932)*** 1.131 (1.110, 1.153)***
Employment status
Employed Reference Reference
Unemployed for a year or less 0.948 (0.916, 0.982)** 0.989 (0.955, 1.025)
Unemployed for over a year 0.921 (0.891, 0.952)*** 0.957 (0.926, 0.989)**
Homemaker 0.753 (0.735, 0.771)*** 0.804 (0.782, 0.826)***
Student 0.780 (0.750, 0.811)*** 0.835 (0.796, 0.876)***
Retired 0.913 (0.896, 0.930)*** 0.950 (0.931, 0.969)***
Unable to work 0.712 (0.701, 0.741)*** 0.757 (0.738, 0.777)***
Annual household income
$10,000 or lower Reference Reference
$10,001 - $15,000 1.095 (1.059, 1.131)*** 1.057 (1.023, 1.092)**
$15,001 - $20,000 1.122 (1.087, 1.158)*** 1.081 (1.047, 1.115)***
$20,001 - $25,000 1.148 (1.113, 1.184)*** 1.103 (1.069, 1.138)***
$25,001 - $35,000 1.153 (1.118, 1.188)*** 1.085 (1.052, 1.119)***
$35,001 - $50,000 1.208 (1.172, 1.245)*** 1.119 (1.085, 1.154)***
$50,001 - $75,000 1.207 (1.171, 1.245)*** 1.119 (1.085, 1.155)***
$75,001 or higher 1.067 (1.035, 1.100)*** 0.959 (0.929, 0.990)**
Current or former smoker
Yes 0.867 (0.857, 0.876)*** 0.827 (0.817, 0.837)***
No Reference Reference
Leisure-time physical activity
Any leisure-time physical activity in past month 0.773 (0.762, 0.784) 0.674 (0.665, 0.683)*** No leisure-time physical activity in past month Reference Reference
General health status
Excellent or very good or good 0.970 (0.953, 0.987)*** 0.816 (0.802, 0.830)***
Fair or poor Reference Reference
Yes 1.220 (1.201, 1.238)*** 1.374 (1.354, 1.395)***
No Reference Reference
Chronic condition diagnosis
Asthma 1.376 (1.348, 1.405)*** 1.439 (1.411, 1.467)***
Depression 1.199 (1.181, 1.217)*** 1.191 (1.173, 1.209)***
Chronic obstructive pulmonary disease 0.810 (0.792, 0.828)*** 0.914 (0.893, 0.934)***
Kidney disease 0.980 (0.949, 1.013) 0.989 (0.958, 1.020)
Cancer (except for skin cancer) 0.971 (0.953, 0.990)** 0.955 (0.936, 0.975)***
Skin cancer 0.872 (0.855, 0.889)*** 0.843 (0.825, 0.862)***
Diabetes 2.651 (2.601, 2.702)*** 2.756 (2.714, 2.799)***
Arthritis 1.490 (1.470, 1.510)*** 1.552 (1.531, 1.573)***
Survey year
2011 0.972 (0.962, 0.983)*** 0.957 (0.946, 0.968)***
2012 Reference Reference
Survey month
January 1.012 (0.984, 1.040) 0.993 (0.965, 1.023)
February 1.004 (0.978, 1.031) 0.977 (0.950, 1.005)
March 1.024 (0.998, 1.051) 0.992 (0.965, 1.020)
April 1.029 (1.001, 1.057)* 0.987 (0.959, 1.015)
May 1.028 (1.001, 1.056)* 1.023 (0.994, 1.052)
June 1.032 (1.005, 1.061)* 1.021 (0.992, 1.051)
July 1.020 (0.993, 1.048) 0.998 (0.970, 1.027)
August 1.013 (0.987, 1.040) 1.000 (0.972, 1.028)
September 1.027 (0.999, 1.055) 1.001 (0.973, 1.031)
October 0.989 (0.964, 1.016) 0.990 (0.963, 1.018)
November 0.992 (0.966, 1.019) 0.971 (0.944, 0.999)*
December Reference Reference
Model specifics
Sample size 661,360 661,360
Number of clusters (counties) 2,250 2,250
LR test vs. single-level logistic regression (χ ) 1486.39*** 1127.46***
Table 3: Estimated Associations between Residential County Social Vulnerability Indexand Overweight/ Obesity Combined (BMI ≥ 25) by Sex, Age Group, and Race/Ethnicity
Sample
Social vulnerability index (least to most vulnerable)
Sample size
Number of clusters 2nd quartile 3rd quartile 4th quartile
All 1.052 (1.021,
1.084)***
1.068 (1.036,
1.100)***
1.095 (1.060,
1.130)***
661,360 2,250 Male 1.054 (1.019, 1.090)** 1.044 (1.004, 1.086)* 1.071 (1.026, 1.117)** 278,000 2,247 Female 1.058 (1.017, 1.099)** 1.083 (1.047,
1.121)***
1.106 (1.066,
1.146)***
383,360 2,250 18 - 34 years
of age 1.074 (1.020, 1.130)**
1.133 (1.075,
1.194)***
1.267 (1.196,
1.342)***
90,861 2,210 35 - 49 years
of age 1.067 (1.017, 1.119)**
1.124 (1.070,
1.180)***
1.215 (1.152,
1.282)***
148,080 2,238 50 - 64 years
of age 1.058 (1.015, 1.102)**
1.076 (1.032,
1.122)***
1.121 (1.071,
1.172)***
223,418 2,249 65 years of age
and above 1.033 (0.992, 1.075) 0.996 (0.956, 1.037)
0.965 (0.924, .1007) 199,001 2,248 White,
non-Hispanic
1.060 (1.027,
1.095)***
1.063 (1.029,
1.098)***
1.068 (1.032,
1.107)***
527,111 2,249 African
American, non-Hispanic
0.955 (0.855, 1.068) 1.037 (0.932, 1.155)
1.087 (0.975, 1.212) 57,269 1,590
Asian or
Pacific
Islander, non-Hispanic
1.066 (0.922, 1.233) 1.259 (1.080, 1.468)**
1.248 (1.047, 1.488)* 13,632 1,013
Hispanic 0.967 (0.873, 1.071) 1.064 (0.962, 1.176) 1.202 (1.089, 1.327)***
40,243 1,824
Notes:Individual-level data came from the BRFSS 2011-2012 surveys. County-level social venerability index (SVI-2010) data came from the CDC (http://svi.cdc.gov/). Multilevel logistic models (residential county at contextual level) were performed on the dichotomous outcome variable for overweight and obesity combined(BMI ≥ 25),
Table 4: Estimated Associations between Residential County Social Vulnerability Index and Obesity (BMI
≥ 30) by Sex, Age Group, and Race/Ethnicity
Sample
Social vulnerability index (least to most vulnerable)
Sample size
Number of clusters 2nd quartile 3rd quartile 4th quartile
All 1.051 (1.019, 1.083)** 1.049 (1.018, 1.082)** 1.071 (1.037, 1.106)***
661,360 2,250 Male 1.058 (1.019, 1.098)** 1.045 (1.006, 1.085)** 1.066 (1.024, 1.110)* 278,000 2,247 Female 1.049 (1.012, 1.088)** 1.057 (1.019, 1.096)** 1.076 (1.036, 1.118)* 383,360 2,250 18 - 34 years
of age 1.052 (0.990, 1.117)
1.146 (1.078,
1.218)***
1.228 (1.150,
1.311)***
90,861 2,210 35 - 49 years
of age
1.094 (1.042,
1.149)***
1.161 (1.105,
1.220)***
1.245 (1.181,
1.314)***
148,080 2,238 50 - 64 years
of age 1.053 (1.012, 1.095)* 1.038 (0.998, 1.081)
1.080 (1.035,
1.127)***
223,418 2,249 65 years of age
and above 1.017 (0.974, 1.061) 0.951 (0.910, 0.993)*
0.923 (0.881,
0.966)***
199,001 2,248 White,
non-Hispanic
1.060 (1.025,
1.095)*** 1.046 (1.012, 1.082)**
1.039 (1.002, 1.077)* 527,111 2,249 African
American, non-Hispanic
1.001 (0.900, 1.112) 1.109 (1.002, 1.227)*
1.208 (1.090,
1.338)***
57,269 1,590
Asian or
Pacific
Islander, non-Hispanic
1.106 (0.887, 1.380) 1.039 (0.826, 1.308)
1.208 (0.932, 1.565) 13,632 1,013