Infogain Publication (Infogainpublication.com) ISSN : 2454-1311
Selection of Representative Kansei Adjectives
using Cluster Analysis: A Case Study on Car
Design
Sugoro Bhakti Sutono
Department of Industrial Engineering, Pelalawan School of Technology, Riau, Indonesia
Abstract— This study aims to select the representative Kansei adjectives or words in Kansei engineering methodology. This study used the passenger car design as its experimental case study. A two-stage cluster analysis was carried out for selecting the representative Kansei adjectives. The selection process of the representative Kansei adjectives was determined based on the smallest distance of individual Kansei adjective to the centroid of each cluster. Thus, the results indicated that ‘modern’, ‘elegant, ‘sporty’, and ‘youthful’ were thereupon selected as appropriate adjectives to represent the initial set of Kansei adjectives. As a conclusion, the cluster analysis method was able to systematically select the representative Kansei adjective and easily interpretable for Kansei engineering.
Keywords— Consumers’ emotional perception, product form, car design, Kansei engineering.
I. INTRODUCTION
It is generally known that products should be designed to fulfil consumer needs. Product designs which are primarily based on the functionality of the product is inadequate to attract consumers to buy the product. When it comes to buying decisions, consumers tend to follow their feelings, emotions and perceptions, and search for something more than what product designers think. Hence, the appearance of a product is one of the crucial factors which influence the buying decision of consumers. A number of systematic product design studies have been carried out over the years in order to attain a better understanding on the subjective perception of consumers. Kansei engineering has been one of the prominent studies in product design [1, 2], as it is considered as one of the most reliable and useful methodologies in dealing with the emotional needs of consumers. Kansei is a Japanese word, which can be literally translated as feeling, image, emotion, affection, sense and impression [3]. Kansei engineering is a methodology that unites Kansei with the engineering discipline, a field in which the development of products that bring happiness and satisfaction to humans is performed technologically, by analyzing human emotions and incorporating them into the product
design [4]. In recent years, Kansei engineering has been proven and successfully adopted in various design fields, such as a telephone [5], a mobile phone [6], machine tools [7], trade show booth [8], PET bottle [9] and urban planning [10].
One of the challenges of Kansei engineering involves selecting representative Kansei adjectives that will best describe the consumers’ perception towards the product during initial stage of Kansei engineering. Delin et al. [11] selected representative Kansei adjectives by proposing a manual methodology based on a set of predefined rules specified by experts. However, their methodology possesses the main drawback the information of the extracted representative Kansei adjectives and their set of original ones are not presented quantitatively.
Several attempts have been made to select representative Kansei adjectives that support quantitative information. Consumers were requested to evaluate product samples using specific Kansei adjectives in the semantic differential (SD) experiments [12]. Factor analysis (FA) was used to extract and analyze the evaluation scores obtained from semantic differential experiments. The factor loading for each Kansei adjective was determined from the factor analysis. Following this, similar Kansei adjectives were extracted and merged into factors based on the consumers’ perception. The appropriate Kansei adjectives were then determined by examining and interpreting the factor loadings of the original Kansei adjectives for each factor.
A number of studies have been carried out to correlate consumers’ emotional needs with Kansei adjectives using factor analysis. Such studies include Petiot and Yannou [13], Alcantara et al. [14], Hsiao and Chen [15], You et
al. [16]. Although the methodologies presented in these
International Journal of Advanced Engineering, Management and Science (IJAEMS) [Vol-2, Issue-11, Nov- 2016] Infogain Publication (Infogainpublication.com) ISSN : 2454-1311
www.ijaems.com Page
|
1886this approach may yield undesirable results in selecting Kansei adjectives that best represent the consumers’ perception, specifically when several adjectives possess the same factor loadings in a a particular factor.
In order to address the above problem, this study is aimed to devise a systematic methodology, in which representative Kansei adjectives are selected based on predefined criteria using cluster analysis.
A car design is used as the experimental case study to demonstrate the applicability of the cluster analysis in selecting representative Kansei adjectives. As a brief background, the automotive industry is becoming one of the most important and strategic industries in the Malaysian manufacturing sector. The Malaysian Automotive Association [17] forecasted that there is an increasing trend in market share for automobiles between 2011 and 2016 with a growth of 11.6%. This will be a very challenging period for the automotive industry, in which passenger cars have the biggest market share. Although Proton and Perodua national cars dominate the current Malaysian automotive market, the steady increase of imported European and Japanese cars will eventually result in a decline in national car sales. This scenario reflects that the automotive industry is a highly competitive market, and therefore this reflects that automotive market is extremely competitive and therefore only automobiles with high appeal to consumers will thrive in such a market. A number of manufacturers are moving towards a consumer-oriented approach in automobile design due to increased competition.
It is anticipated that the results of this study will be useful for future studies to develop emotionally attractive passenger cars, specifically for the Malaysian automotive industry. This paper is organized as follows. A brief
background on Kansei engineering and its relevance to product design, the Malaysian automotive industry, as well as the motivation and objective of this study is presented in the ‘Introduction’ section. The methodology and experimental design adopted in this study are presented in the “Research Method” section. The findings of this study are presented and discussed in detail in the “Results and Discussion” section. Finally, conclusing remarks are given in the “Conclusions” section.
II. RESEARCHMETHOD
The cluster analysis is used to select the most appropriate adjectives in Kansei engineering and is elaborated in detail in this section. The methodology consists of the following stages: (1) Preparation of stimuli; (2) Preparation of the initial Kansei adjectives; (3) Experimental design for semantic differential evaluation; (4) Analysis of the initial Kansei adjectives using factor analysis; and (5) Selection of the representative Kansei adjectives using cluster analysis.
2.1 PREPARATION OF STIMULI
A total of 76 product samples are gathered based on the various passenger cars sold in the Malaysian automotive market between year 2007 and 2012. However, the number of product samples is too large for semantic differential measurements. Hence, representative product samples are selected by consulting three experts having an automotive and product design background, in which the product samples are evaluated and classified based on the degree of similarity between the products.
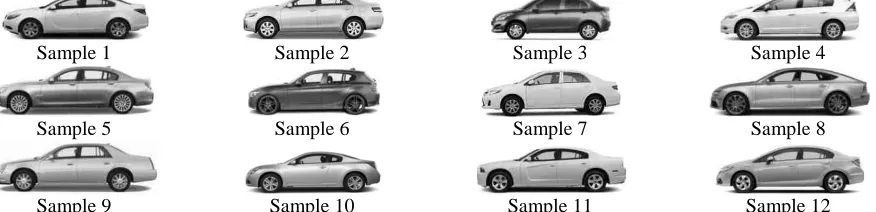
A total of 12 representative product samples are finally selected as the set of stimuli used to evoke the consumer’s emotional perception for the semantic differential survey as shown in Fig. 1.
Sample 1 Sample 2 Sample 3 Sample 4
Sample 5 Sample 6 Sample 7 Sample 8
Sample 9 Sample 10 Sample 11 Sample 12
Fig. 1: 12 representative product samples used as a set stimulus for the semantic differential survey
2.2 PREPARATION OF THE INITIAL KANSEI ADJECTIVES
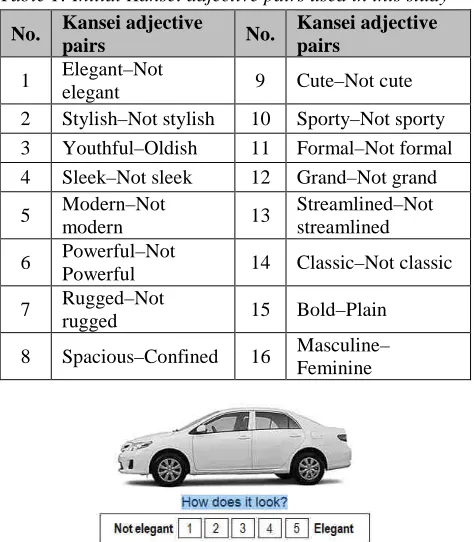
A total of 16 initial Kansei adjective pairs are collected in order to describe the emotional perception of consumers towards car design as shown in Table 1. These adjective pairs are selected by eliminating adjectives gathered from relevant Kansei engineering literatures, car magazines and the Internet based on the relationship and similarities in the definitions (i.e. synonyms). The selected Kansei
adjectives are expected to represent the complete semantic description as much as possible.
2.3 EXPERIMENT DESIGN FOR SEMANTIC DIFFERENTIAL
EVALUATION
Infogain Publication (Infogainpublication.com) ISSN : 2454-1311
females) participated in a subjective evaluation of 12 product samples using 16 initial Kansei adjective pairs on passenger car design. The subjects are requested to evaluate each product sample in the survey questionnaire, whereby each Kansei adjective pair is rated using a 5-point Likert scale [12]. In this manner, the subjects can express their subjective perception for each product sample by rating each Kansei adjective pair. For example, consider the Kansei adjective pair ‘elegant – not elegant’ shown in Fig. 2. If the subject evaluates the product sample by giving a score of 1, this indicates that the consumer strongly perceives that the product sample is ‘not elegant’. Likewise, if the subject gives a score of 5, this indicates that the subject strongly perceives that the product sample is ‘elegant’. The subjects’ evaluation scores for each product sample and initial Kansei adjective pairs are averaged to obtain a final utility rating.
Table 1: Initial Kansei adjective pairs used in this study
No. Kansei adjective
pairs No.
Kansei adjective pairs
1 Elegant–Not
elegant 9 Cute–Not cute 2 Stylish–Not stylish 10 Sporty–Not sporty 3 Youthful–Oldish 11 Formal–Not formal 4 Sleek–Not sleek 12 Grand–Not grand 5 Modern–Not
modern 13
Streamlined–Not streamlined 6 Powerful–Not
Powerful 14 Classic–Not classic 7 Rugged–Not
rugged 15 Bold–Plain 8 Spacious–Confined 16 Masculine– Feminine
Fig. 2: Example of semantic differential questionnaire: ‘Not elegant – Elegant’ adjective pair
2.4 ANALYSIS OF INITIAL KANSEI ADJECTIVES USING
FACTOR ANALYSIS
The semantic differential measurement data of emotional perception are analyzed to extract the initial Kansei adjective pairs using factor analysis. Factor analysis with varimax rotation is carried out to obtain the Kansei structure, in which the emotional perception is described by factor loadings. The number of factors is determined by the following criterion, i.e. the eigenvalues must be greater than 1. The proportions of variability explaining the factor contribution are obtained after varimax rotation.
The data are then analyzed for sampling adequacy and reliability. The adequacy of the sample structure is analyzed using the Kaiser-Meyer-Olkin (KMO) statistic, whereas the reliability of internal consistency between the Kansei adjectives is evaluated using Cronbach’s alpha. 2.5 SELECTION OF REPRESENTATIVE KANSEI ADJECTIVES
USING CLUSTER ANALYSIS
Cluster analysis is performed to select representative Kansei adjectives once the Kansei structure is obtained. The process of selecting representative Kansei adjectives that combines hierarchical and non-hierarchical procedures is known as two-stage cluster analysis [18]. In the first stage of the two-stage cluster analysis, the hierarchical procedure is employed to determine the number of clusters. Agglomerative clustering is performed using the Ward’s method in order to compute the sum of squared distances within the clusters and aggregate clusters having a minimum increase in the overall sum of squares. The elbow rule is used to define the number of clusters [19] as it has been proven to be a better rule than other statistical methods [20].
In the second stage, the non-hierarchical procedure (k-means cluster analysis) is employed to classify homogeneous Kansei adjective pairs into clusters and select representative adjective pairs for each cluster. Each cluster can be considered as a representative group of Kansei adjectives. For this purpose, the squared Euclidean distance is used to calculate the distances between each Kansei adjective pair and its centroid for each cluster. Kansei adjective pairs with the shortest distance to the centroid of each cluster are selected as the representative adjective pairs for the cluster.
III. RESULTS AND DISCUSSION
A semantic differential survey is carried out to gather data of evaluation scores, as described in the ‘Research Method’ section. The evaluation scores for each subject are then analyzed using the Statistical Package of the Social Science (SPSS) Version 19.0 software.
3.1 FACTOR ANALYSIS RESULTS
International Journal of Advanced Engineering, Management and Science (IJAEMS) [Vol-2, Issue-11, Nov- 2016] Infogain Publication (Infogainpublication.com) ISSN : 2454-1311
www.ijaems.com Page
|
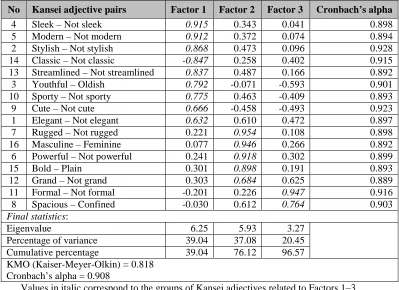
1888adjectives. When Factor 3 is included, the proportion of variance increases to explain most of the factor contribution. From Table 2, it can be seen that the total cumulative percentage of three factors represent 96.57% of the total explained variance, which indicates that the three factors extracted from factor analysis are quite acceptable. Consequently, the proportion of variance explained by the remaining factors can be considered insignificant, with a value less than 3.43%. The KMO (Kaiser-Meyer-Olkin) statistic is found to be 0.818, as shown in Table 2. In terms of sampling adequacy, a KMO statistic of over 0.5 indicates that the data is adequate in order to proceed with a satisfactory factor analysis. Since the KMO statistic is 0.818 (which exceeds a value of 0.5), this indicates that the sampling of consumers’ emotional perception is adequate for factor analysis. The Cronbach’s alpha value is determined to be 0.908, with a range between 0.889 to 0.928 for the 16 Kansei adjective pairs, as shown in Table 2. Cronbach’s alpha is a coefficient of internal consistency, and is used as an internal consistency estimate of the reliability of scores in a construct. Indicators with unsatisfactory values will be deleted based on a reliability indicator of 0.7 [21]. The
results show that the Kansei adjective pairs have a Cronbach’s alpha value greater than 0.7. This indicates that all items of the Kansei construct are indeed reliable. Furthermore, Table 2 shows the factor loading score for each Kansei adjective pair in a descending order. Adjective pairs with high factor loading scores are perceived as significant factors in passenger car design. A variable must have a factor loading score greater than 0.60 in order to qualify as a significant factor, based on the criterion recommended by Hair et al. [22]. The results reveal that the 16 emotional perceptions of car design are structured by three factors, which explain 95.67% of the total data. The first factor consists of 9 impression adjective pairs, whereas the second and third factors consist of 5 and 2 impression adjective pairs, respectively. The impression adjectives ‘sleek’, ‘modern’, ‘stylish’, ‘classic’, ‘streamlined’, ‘youthful’, ‘sporty’, ‘cute’ and ‘elegant’ belong to the first factor, whereas the impression adjectives ‘rugged’, ‘masculine’, ‘powerful’, ‘bold’ and ‘grand’ belong to the second factor. The impression adjectives ‘formal’ and ‘spacious’ make up the third factor.
Table 2: Factor loadings for 16 Kansei adjective pairs for three factors
No Kansei adjective pairs Factor 1 Factor 2 Factor 3 Cronbach’s alpha
4 Sleek – Not sleek 0.915 0.343 0.041 0.898 5 Modern – Not modern 0.912 0.372 0.074 0.894 2 Stylish – Not stylish 0.868 0.473 0.096 0.928 14 Classic – Not classic -0.847 0.258 0.402 0.915 13 Streamlined – Not streamlined 0.837 0.487 0.166 0.892 3 Youthful – Oldish 0.792 -0.071 -0.593 0.901 10 Sporty – Not sporty 0.775 0.463 -0.409 0.893 9 Cute – Not cute 0.666 -0.458 -0.493 0.923 1 Elegant – Not elegant 0.632 0.610 0.472 0.897 7 Rugged – Not rugged 0.221 0.954 0.108 0.898 16 Masculine – Feminine 0.077 0.946 0.266 0.892 6 Powerful – Not powerful 0.241 0.918 0.302 0.899 15 Bold – Plain 0.301 0.898 0.191 0.893 12 Grand – Not grand 0.303 0.684 0.625 0.889 11 Formal – Not formal -0.201 0.226 0.947 0.916 8 Spacious – Confined -0.030 0.612 0.764 0.903
Final statistics:
Eigenvalue 6.25 5.93 3.27 Percentage of variance 39.04 37.08 20.45 Cumulative percentage 39.04 76.12 96.57 KMO (Kaiser-Meyer-Olkin) = 0.818
Cronbach’s alpha = 0.908
Values in italic correspond to the groups of Kansei adjectives related to Factors 1–3. 3.2 SELECTION PROCESS OF REPRESENTATIVE KANSEI
ADJECTIVES USING CLUSTER ANALYSIS RESULTS
The 16 initial Kansei adjective pairs are extracted from the factor analysis, in which the factor loadings are classified into three factors for two-stage cluster analysis. The factor loadings for the three factors are first analyzed
Infogain Publication (Infogainpublication.com
presented in Fig. 3. From the table in Fig
jump occurs between stages 11 and 12, with a difference in agglomeration coefficient value of 0.692 (i.e. 1.622 0.930). Hence, an elbow forms at stage 12, as indicated by the red quadrangle in Fig. 3(b). From the scree plot in
Stag
e Coefficients
1 0.001 2 0.003 3 0.008 4 0.020 5 0.043 6 0.070 7 0.127 8 0.220 9 0.402 10 0.642 11 0.930 12 1.622 13 2.821 14 4.156 15 8.447
(a)
Fig. 3: Results of the hierarchical cluster analysis: (a) table of agglomeration coefficients, (b) scree plot of coefficients and
Table 3: Euclidean distance between Kansei adjective pairs and their centroid for cluster 1–4
Cluster No. Kansei adjective pairs
1 5 Modern – Not modern
1 14 Classic – Not classic 1 4 Sleek – Not sleek 1 2 Stylish – Not stylish 1 13 Streamlined – Not
streamlined
2 1 Elegant – Not elegant
2 15 Bold – Plain
2 6 Powerful – Not powerful 2 12 Grand – Not grand 2 8 Spacious – Confined 2 7 Rugged – Not rugged 2 16 Masculine – Feminine 2 11 Formal – Not formal 3 10 Sporty – Not sporty
3 9 Cute – Not cute
4 3 Youthful – Oldish
The italic Kansei adjective pair indicates the representative Kansei adjective pairs within the cluster 1 4.
Following this, the non-hierarchical procedure (
clustering method) is implemented to classify homogeneous Kansei adjective pairs into four clusters. The squared Euclidean distance concept is applied to extract one Kansei adjective pair from each cluster by computing the centroid of each cluster.
Infogainpublication.com)
. From the table in Fig. 3(a), a bigger jump occurs between stages 11 and 12, with a difference 0.692 (i.e. 1.622 – rms at stage 12, as indicated (b). From the scree plot in
Fig. 3, the number of clusters can be calculated by subtracting the number of cases (Kansei adjective pairs) using the step of the ‘elbow’, i.e. 16
number of clusters is 4, as determined from the hierarchical cluster analysis.
(b)
cluster analysis: (a) table of agglomeration coefficients, (b) scree plot of coefficients and stage
: Euclidean distance between Kansei adjective
Euclidean distance
Not modern 0.108
0.111 0.116 0.179 0.412 0.192 0.249 Not powerful 0.313 0.322 0.388 Not rugged 0.408 0.456 0.805 0.206 0.206 0.000 The italic Kansei adjective pair indicates the representative Kansei adjective pairs within the cluster 1–
hierarchical procedure (k-means clustering method) is implemented to classify homogeneous Kansei adjective pairs into four clusters. The squared Euclidean distance concept is applied to extract one Kansei adjective pair from each cluster by he centroid of each cluster. The distance
between each Kansei adjective pair and its centroid for each cluster is computed and the representative Kansei adjectives are selected based on those with the smallest Euclidean distance. The Euclidean distance for Kansei adjective pair and its centroid for each cluster is tabulated in Table 3. Table 3 shows that Clusters 1, 2, 3 and 4 consist of 5, 8, 2 and 1 Kansei adjective pairs, respectively. It is evident that the following adjective pairs with the shortest distance
representative Kansei adjectives: ‘modern for Cluster 1 (distance: 0.108), ‘elegant Cluster 2 (distance: 0.192), ‘sporty
not cute’ for Cluster 3 (distance: 0.206), and ‘youthful oldish’ for Cluster 4 (distance: 0.000).
From Table 3, it can be noted that the adjective pairs for Cluster 3 have an equal Euclidean distance, whereby the distance for adjective pairs ‘sporty
not cute’ is 0.206. Consequently, this p
deciding which Kansei adjective pair is most representative of consumers’ emotional perception. It may be possible that both adjective pairs should be selected or either one should be selected to be representative of Cluster 3. However, t
still be solved by considering the
Kansei adjective pair from factor analysis. From Table 2, the Kansei adjective pairs ‘sporty
selected as a representative Kansei adjective of Cluster 3 because it has a factor loading higher than ‘cute cute’, i.e. 0.775>0.666. Accordingly, if facing these
step of ‘elbow’
ISSN : 2454-1311
, the number of clusters can be calculated by subtracting the number of cases (Kansei adjective pairs) using the step of the ‘elbow’, i.e. 16 – 12 = 4. Thus, the number of clusters is 4, as determined from the
cluster analysis: (a) table of agglomeration coefficients, (b) scree plot of coefficients and
between each Kansei adjective pair and its centroid for each cluster is computed and the representative Kansei adjectives are selected based on those with the smallest Euclidean distance. The Euclidean distance for each Kansei adjective pair and its centroid for each cluster is tabulated in Table 3. Table 3 shows that Clusters 1, 2, 3 and 4 consist of 5, 8, 2 and 1 Kansei adjective pairs, respectively. It is evident that the following adjective st distance are selected as representative Kansei adjectives: ‘modern–not modern’ for Cluster 1 (distance: 0.108), ‘elegant–not elegant’ for Cluster 2 (distance: 0.192), ‘sporty–not sporty’ or ‘cute– not cute’ for Cluster 3 (distance: 0.206), and ‘youthful– oldish’ for Cluster 4 (distance: 0.000).
International Journal of Advanced Engineering, Management and Science (IJAEMS) [Vol-2, Issue-11, Nov- 2016] Infogain Publication (Infogainpublication.com) ISSN : 2454-1311
www.ijaems.com Page
|
1890drawbacks, the selection of representative Kansei adjectives is not as simple to be overcome by using cluster analysis, but should also take into account the highest factor loading criteria of factor analysis into cluster analysis.
IV. CONCLUSION
The process involved in selecting Kansei adjectives which best represent the emotional perception of consumers with respect to product samples is difficult to obtain and are often unsystematic. To address this problem, a systematic methodology is devised using cluster analysis to select Kansei adjectives which are most representative of the consumers’ emotional perception for passenger cars. Based on the results obtained from the survey, it is evident that cluster analysis is capable of selecting representative Kansei adjectives in a systematic and efficient manner, and the methodology is easily interpretable for Kansei engineering. The Kansei structure is first formed by evaluating the factor loadings of each adjective pair using factor analysis. The Euclidean distance between each adjective pair and its centroid for each cluster is computed, and the representative Kansei adjectives for each cluster are selected by extracting those with the minimum distance. The representative Kansei adjective pairs are found to be ‘modern–not modern’, ‘elegant–not elegant’, ‘sporty–not sporty’, and ‘youthful– oldish’ for Clusters 1, 2, 3 and 4, respectively. However, this methodology possesses the drawback that it is difficult to select representative Kansei adjectives when there are several adjectives having the same Euclidean distance. Hence, to overcome this drawback, it is critical to take into account the highest factor loading as criteria. The results and analysis presented in this study serve as a useful reference for future studies in designing emotionally attractive passenger cars, particularly for the Malaysian automotive industry. It shall be highlighted however, that this study is constrained within a specific number of subjects, which is assumed to be representative of the actual market segment.
REFERENCES
[1] M. Nagamachi, “Kansei engineering: A new ergonomic consumer-oriented technology for product development,” International Journal of Industrial Ergonomics, vol. 15, no. 1, pp. 3-11, 1995.
[2] M. Nagamachi, “Perspectives and the new trend of Kansei/affective engineering,” The TQM Journal, vol. 20, no. 4, pp. 290-298, 2008.
[3] M. Nagamachi, Kansei/Affective Engineering, CRC Press, 2011.
[4] M. Nagamachi and A. M. Lokman, Innovations of Kansei Engineering, CRC Press, 2011.
[5] S. H. Hsu, M. C. Chuang and C. C. Chang, “A semantic differential study of designers' and users'
product form perception,” International Journal of Industrial Ergonomics, vol. 25, no. 4, pp. 375-391, 2000.
[6] M. H. Yun, S. H. Han, S. W. Hong and J. Kim, “Incorporating user satisfaction into the look-and-feel of mobile phone design,” Ergonomics, vol. 46, no. 13/14, pp. 1423-1440, 2003.
[7] S. Mondragón, P. Company and M. Vergara, “Semantic differential applied to the evaluation of machine tool design,” International Journal of Industrial Ergonomics, vol. 35, no. 11, pp. 1021-1029, 2005.
[8] M. S. Huang, H. C. Tsai and T. H. Huang, “Applying Kansei engineering to industrial machinery trade show booth design,” International Journal of Industrial Ergonomics, vol. 41, no. 1, pp. 72-78, 2011.
[9] K. Widiyati and H. Aoyama, “A study of Kansei engineering in PET bottle silhouette,” ASME 2011 International Design Engineering Technical Conferences and Computers and Information in Engineering Conference, Washington, DC, USA, 2011.
[10]C. Llinares and A. F. Page, “Kano’s model in Kansei engineering to evaluate subjective real estate consumer preferences,” International Journal of Industrial Ergonomics, vol. 41, no. 3, pp. 233-246, 2012.
[11]J. Delin, S. Sharoff, S. Lillford and C. Barnes, “Linguistic support for concept selection decisions,” Artificial Intelligence for Engineering Design, Analysis and Manufacturing, vol. 21, no. 2, pp. 123-135, 2007.
[12]C. E. Osgood, G. J. Suci and P. Tannenbaum, The Measurement of Meaning, University of Illinois Press, 1957.
[13]J. F. Petiot and B. Yannou, “Measuring consumer perceptions for a better comprehension, specification and assessment of product semantics,” International Journal of Industrial Ergonomics, vol. 33, no. 6, pp. 507-525, 2004.
[14]E. Alcantara, M. A. Artacho, J. C. Gonzalez and A. C. Garcia, “Application of product semantics to footwear design. Part I - Identification of footwear semantic space applying differential semantics,” International Journal of Industrial Ergonomics, vol. 35, pp. 713-725, 2005.
[15]K. A. Hsiao and L. L. Chen, “Fundamental dimensions of affective responses to product shapes,” International Journal of Industrial Ergonomics, vol. 36, pp. 553-564, 2006.
[16]H. You, T. Ryu, K. Oh, M. H. Yun and K. J. Kim, “Development of customer satisfaction models for automotive interior materials,” International Journal of Industrial Ergonomics, vol. 36, pp. 323-330, 2006. [17]Malaysian Automotive Association, Market Review
for 1st half 2012 Compared to 1st half 2011, Press Conference, (2012, July 19). Retrieved August 06, 2012:
Infogain Publication (Infogainpublication.com) ISSN : 2454-1311
[18]M. J. Chung, H. F. Lin and M. J. Wang, “The development of sizing systems for Taiwanese elementary- and high-school students,” International Journal of Industrial Ergonomics, vol. 37, no. 8, pp. 707-716, 2007.
[19]C. Smyth, D. Coomans, Y. Everingham and T. Hancock, “Auto-associative multivariate regression trees for cluster analysis,” Chemometrics and Intelligent Laboratory Systems, vol. 80, no. 1, pp. 120-129, 2006.
[20]K. Ogawa, “An approach to simultaneous estimation and segmentation in conjoint analysis,” Marketing Science, vol. 6, no. 1, pp. 66-81, 1987.
[21]N. Gorla, T. M. Somers and B. Wong, Organizational impact of system quality, information quality, and service quality,” The Journal of Strategic Information Systems, vol. 19, no. 3, pp. 207-228, 2010.