Analysis & Design of Algorithms for the
Pulmonary Function Test
Avani Kalathiya Ghanshyam D. Parmar
Department of Biomedical Engineering Department of Biomedical Engineering
Government Engineering College, Sector 28, Gandhinagar Government Engineering College, Sector 28, Gandhinagar
Abstract
Spirometer measures the amount of volume and flow rate of air that is inhaled & exhaled. Spirometer is a noninvasive diagnostic instrument. [1][2] This paper represents the comparison of three different spirometer sensor designs. 1st design of spirometer sensor is made up with using Infra Red Transmitter – Receiver. 2nd design is made up by using LED (Light Emitting Diode) – LDR (Light dependent resistor) pair as visible light Transmitter – Receiver. 3rd design uses differential pressure sensor which senses difference in air flow pressure. This differential pressure sensor is used for the further processing. The microcontroller, MAX232, and USB to 232 converters are used to display the output of sensor. MATLAB display the real time graph of spirometer. Flow rate and volume of the air flow are calculated in MATLAB software. Then bias removal algorithm has being applied to reduce the bias seen in the flow graph. Also expiration and inspiration graph has been separated from the complete flow graph. Parameters such as tidal volume, inspiratory volume, FEV1 and FVC can be calculated from this flow rate and volume graph. This paper also provides these parameter values of the persons of different age also.
Keywords: IR Transmitter-Receiver, LED, Differential Pressure Sensor, Atmega8, Flow Rate, Volume, Bias
________________________________________________________________________________________________________
I.
I
NTRODUCTIONThese sensors are made to design the digital spirometer with PC interface. Spirometry takes measurements of the quantity of air inhaled & exhaled by the lungs during a certain period of time to determine the pulmonary capacity. The spirometry test includes parameters like MEF (Maximum Expiratory Flow), FEV1 (Forced Expiratory Volume in 1 sec.), FVC (Forced Vital Capacity), Forced Expiratory flow at 25% (FEF25%). [5] The spirometer is the ideal instrument for pulmonary the function test that allow the analysis, determination and monitoring of lung diseases like COPD (Chronic Obstructive Pulmonary Disease), asthma, respiratory bronchitis etc. [3]
The sensor made up of Infra Red transmitter- receiver [10] gives output in terms of square pulses. These square pulses count can be converted in to air flow rate and volume. The sensor design using LED-LDR [17] pair gives pulses which then be counted and can be calculated to measure flow rate and volume of air. Differential pressure based spirometer sensor measure the pressure differences between inlet and outlet pressure port. [9] This sensor outputs in terms of voltage which is proportional to pressure difference ranges from -7 KPa to +7 KPa. [13]
Differential pressure sensor is used in this design of digital spirometer. This pressure sensor has linear output in the range of 0 to 5 volt. MATlAB software display the real time signal of the air flow.
II.
S
ENSOR DESIGNFlow Sensor Using Infra Red Transmitter Receiver [10]: A.
Block Diagram: 1)
Fig. 1: Block Diagram of Flow Sensor Using IR Light
Here, 555 Timer IC is used as an Astable Multivibrator. R1, R2 & C1 decide the frequency of the multivibrator. Here R1, R2 & C1 is decided such as to have 38 KHz frequency. The following equations are used to calculate desired frequency.
( ) (1.1)
(1.2)
(1.3) (1.4)
This generated frequency is driven to IR LED & thus IR LED emits 38 KHz frequency. This frequency is detected by TSOP1738 IR detector. TSOP1738 is an active low output detector. This output driven to the negative triggered monostable multivibrator. When there is a fan in between IR LED & TSOP1738 detector, TSOP1738 gives low output & hence monostable multivibrator gives output high. The HIGH & LOW output of monostable multivibrator indicates the detection & absence of IR rays respectively.
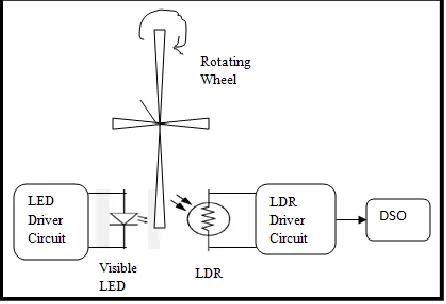
Flow Sensor using LED-LDR Pair: B.
This type of sensor is designed using visible LED & LDR. LDR is a light dependent resistor which gives change in resistance when exposed to light. [17] Resistance of LDR decreases with increase in light intensity. The dark resistance (resistance of LDR in darkness) is in the range of few mega ohms. The spectral response of LDR depends on the wavelength of visible spectrum. LDR gives high response having wavelength ranges 530 nm to 560 nm. Green visible light have wavelength range of 495nm to 570 nm which cover the highest spectral response range of LDR hence it would be better to use green visible light LED.
Block Diagram: 1)
Fig. 2: Block Diagram of Flow Sensor using LED – LDR
Visible LED is driven by 5 volt power supply and it is a green light LED. LDR is also driven by 5V power supply. Inside LDR circuit, LDR is connected to a transistor which is working as a switching devise. Transistor switching is depends on light falls on LDR or LDR is in darkness. When fan of rotating wheel is in between LED & LDR, LDR is in darkness & at that time transistor is in OFF condition. The output of transistor is given to DSO.
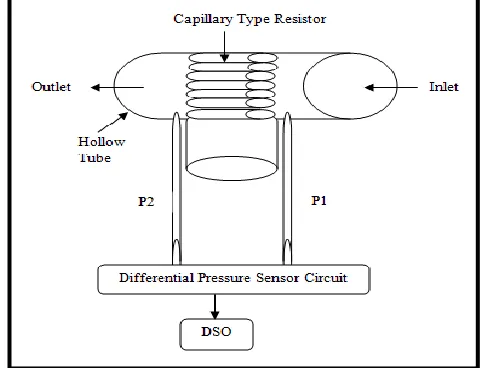
Flow Sensor using Differential Pressure Sensor: C.
Block Diagram: 1)
This flow sensor consists of one hollow tube having capillary type resistor between inlet & outlet of air flow. Pressure at port P1 is higher than the Pressure at port P2 which is created by the resistance between inlet & outlet & is measured by the integrated differential pressure sensor. [9] [11].
Fig. 3: Block Diagram of Flow Sensor using Differential Pressure Sensor
III.
M
ICROCONTROLLER,
MAX232
&
USB TO232
CONVERTERThe microcontroller ATmega8 [19] is used which is 8 bit microcontroller and has inbuilt ADC (Analog to digital converter) of 10 bit and oscillator operates on 16 MHz crystal frequency. Also the USART used for the serial communication. MAX232 [18] and BAFO are used to communicate with the PC
IV.
COMPLETE HARDWAREV.
S
OFTWARE IMPLEMENTATIONReal Time Signal Acquisition Flowchart: A.
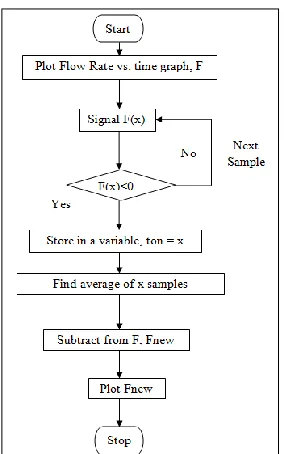
Fig. 5: Flowchart of Real Time Signal Acquisition
Initialize COM port configuration (set baud rate and define COM port). The baud rate should match with baud rate of the controller you are using for serial communication. Plot the signal received by serially to the PC. Calculate flow rate by dividing pressure difference to the resistance. Flow rate is in terms of liter per second. Now calculate the volume by integrating the flow rate signal. Plot the flow rate vs. volume graph. Flow rate is measured in liter per second and volume is measured in liter. Also FIR filter is used to remove noise from the flow graph.
Bias Removal Flowchart: B.
VI.
P
ARAMETER DESCRIPTIONFEV1
A.
FEV1 is the volume of forceful exhalation in 1 second. First find out the sample value from expiration volume vs. time graph at 1 second by multiplying 1 second to Fs (sampling frequency). Then find value of volume at that sample value. This is the volume at 1 second. Normal value is considered as 70% of FVC. Less than 70% is considered as abnormality.
IC B.
It can be calculated by finding the peak of the volume graph of forceful exhalation. Compare the value of next sample to the previous one. If the value of next sample is less than the previous one than continue the process otherwise store the value in a variable when condition is not satisfied.
TV C.
It is defined as the volume of air coming in and out of lung during normal breathing. It can be measured by finding out the volume of any 1 inhalation or exhalation flow rate loop. Normal tidal volume is 500ml. Diseased person have tidal volume less than 500 ml.
FVC D.
It is defined as the volume of expired air after full inhalation. It is calculated by doing summation of tidal volume, inspiratory reserve volume and expiratory reserve volume.
FEV1/FVC Ratio
E.
It is the ratio of the FEV1 and FVC. It is very useful parameter in the diagnosis of the respiratory disease. Its normal value considered as 80%. Below that percentage the person is considered as abnormal.
VII.
R
ESULTS&
DISCUSSIONFig. 7: Output of Flow Sensor Using IR Light
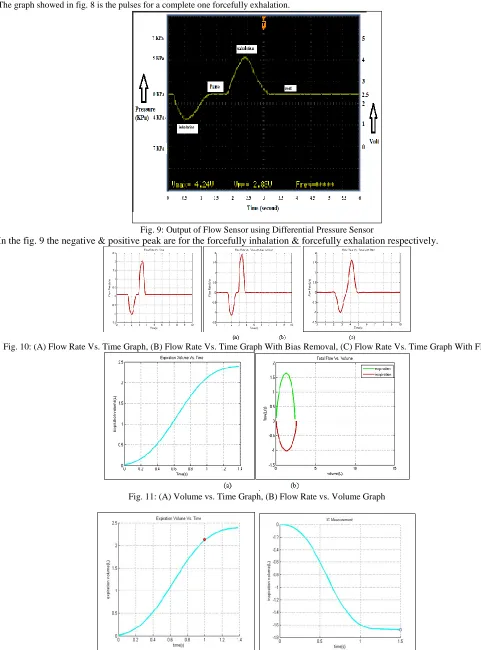
The graph showed in fig. 8 is the pulses for a complete one forcefully exhalation.
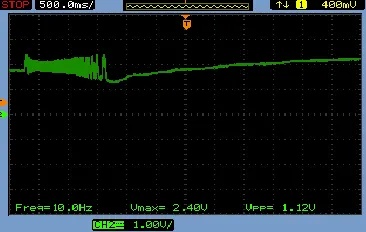
Fig. 9: Output of Flow Sensor using Differential Pressure Sensor
In the fig. 9 the negative & positive peak are for the forcefully inhalation & forcefully exhalation respectively.
Fig. 10: (A) Flow Rate Vs. Time Graph, (B) Flow Rate Vs. Time Graph With Bias Removal, (C) Flow Rate Vs. Time Graph With FIR Filter
Fig. 11: (A) Volume vs. Time Graph, (B) Flow Rate vs. Volume Graph
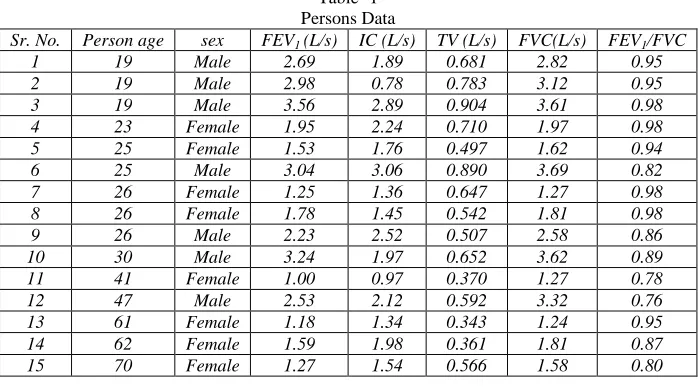
Table -1 Persons Data
Sr. No. Person age sex FEV1 (L/s) IC (L/s) TV (L/s) FVC(L/s) FEV1/FVC
1 19 Male 2.69 1.89 0.681 2.82 0.95
2 19 Male 2.98 0.78 0.783 3.12 0.95
3 19 Male 3.56 2.89 0.904 3.61 0.98
4 23 Female 1.95 2.24 0.710 1.97 0.98
5 25 Female 1.53 1.76 0.497 1.62 0.94
6 25 Male 3.04 3.06 0.890 3.69 0.82
7 26 Female 1.25 1.36 0.647 1.27 0.98
8 26 Female 1.78 1.45 0.542 1.81 0.98
9 26 Male 2.23 2.52 0.507 2.58 0.86
10 30 Male 3.24 1.97 0.652 3.62 0.89
11 41 Female 1.00 0.97 0.370 1.27 0.78
12 47 Male 2.53 2.12 0.592 3.32 0.76
13 61 Female 1.18 1.34 0.343 1.24 0.95
14 62 Female 1.59 1.98 0.361 1.81 0.87
15 70 Female 1.27 1.54 0.566 1.58 0.80
VIII.
C
ONCLUSIONThe IR based flow sensor has one biggest advantage is that it is not affected by ambient light but has one drawback is that it gives too much less count pulses (8 to 10) for a complete one revolution which is very less for further calculation.
The LED – LDR based flow sensor solve the problem faced by IR based flow sensor that it has more count pulses which ranges 80 to 90 pulses per one exhalation which is better for further signal processing. But this sensor is too much sensitive to ambient light so as to be placed in darkness & also it is difficult to calibrate.
The differential pressure type pressure sensor works on different principle than other two sensors. It measures pressure difference between two ports and gives voltage out equivalent to pressure difference. One biggest advantage is that it is internally calibrated & also has temperature compensation over 0ºC to 85ºC.
This spirometer can measure upto 10 liter per second. The resistance is 0.8 KPa*s/L. The result is accurately measures because of bias removal and use of FIR filter.
This spirometer costs upto 1400 rupee only. This is the biggest advantage as it is of low cost.
R
EFERENCES[1] Rudiger Kramme, Klaus-Peter Hoffmann, Robert Pozos, “ Handbook of Medical Technology”, springer, 2011 [2] Respiratory System Austin Community College District
[3] Global Surveillance, Prevention and Control of Chronic Respiratory Diseases, A comprehensive approach by World Health Organization [4] Pulmonary function test, Patient information series by American Thoracic society.
[5] R S Khandpur, “Hadbook of biomedical Instrumentation”, Tata McGraw-Hill Education, 2003.
[6] Timothy J. Barreiro, D.O. , & Irene Perillo, M.D., “An approach to interpreting spirometry”, University of Rochester School of Medicine & Dentistry, Rochester, Newyork.
[7] Fluid Flow Viscosity Poiseuille’s Law, Visual Physics, School of Physics University of Sydney, Australia.
[8] Lee Waite, Rose-Hulman Institute of Technology, Terre Haute, Indiana, “Bio Fluid Mechanics in Cardiovascular Systems”, McGraw-Hill Education, 2006. [9] Jack Wanger, “Pulmonary Function Testing”, Jones & Bartlett Learning, 3rd edition.
[10] Ajinkya Chouthai1, Rathin Karhu2, Soham Kulkarni3, UG Student, Dept. of E&TC Engineering, PVG’s COET, Pune, Maharashtra, India, “Rpm Measurement and Calculations Using TSOP IR Receiver1” in International Journal of Advanced Research in Electrical, Electronics and Instrumentation Engineering, Vol. 2, Issue 7, July 2013
[11] Andrew Bremer, Andrew Dias, Jeremy Glynn, Jeremy Schaefer, BME 301, “Low-cost Spirometer”, University of Wisconsin - Madison , 2010. [12] © 2011 Welch Allyn SM2863 Rev C, “Welch Allyn PC-Based SpiroPerfect Spirometer”
[13] C. William Carspecken, Carlos Arteta, Gari D. Clifford, Institute of Biomedical Engineering, Dept. of Engineering Science, University of Oxford, Oxford, UK, department of Medical Education, Harvard Medical School, Boston MA, United States “Telespiro: A Low-cost Mobile Spirometer For Resource-limited Settings” in IEEE Point-of-Care Healthcare Technologies (PHT) Bangalore, India, 16 - 18 January, 2013
[14] Ahmad Abushakra and Miad Faezipour, Department of Computer Science & Engineering University of Bridgeport, Bridgeport, CT 06604, IEEE 12th International Conference on Bioinformatics & Bioengineering (BIBE), Larnaca, Cyprus, 11-13 November 2012, “Lung Capacity Estimation Through Acoustic Signal of Breath”
[15] Muhammad H. Rashid, “Microelectronic Circuits- analysis & Design”, 2nd edition, 2011. [16] LM 555 Timer, Texas Instruments
[17] V.Ryan, “Electronics index”, © 2002.
[18] Muhammad Ali Mazidi, Janice Gillispie Mazidi, Rolin D.Mckinlay, “The 8051 Microcontroller And Embedded Systems Using Assembly And C”, 2ND Edition, Prentice-Hall Of India Pvt. Limited.
![EHB_-AP.1B[1].pdf](data:image/gif;base64,R0lGODlhAQABAIAAAP///wAAACH5BAEAAAAALAAAAAABAAEAAAICRAEAOw==)