A Video Learning Analytics System for Students’ Learning
Behavior Collection and Visualization
Qiusha Min*, Yating Chen, Dan Xia
School of Educational Information Technology, Central China Normal University, No.152 Luoyu Road, Wuhan, Hubei, China.
* Corresponding author. Tel.: 18971461590; email: [email protected] Manuscript submitted March 10, 2019; accepted May 20, 2019.
doi: 10.17706/jcp.14.6 381-388.
Abstract: Nowadays, the flipped classroom or blended-learning models have been widely implemented in school settings. In these teaching models, students are provided with online materials to gain necessary knowledge before or after class. The instructional videos are often the main learning materials which students spend much time on watching. During their learning process, large amount of interaction data of students with their video system are generated. Therefore, this paper presents a video learning analytics system to collect and visualize these behavior data. This system has five main modules, which are login, video, quiz, visualization, and database. The system can collect students' learning behavior data in the background when students watch video in the video module and gather their learning results in the quiz module. Consequently, the visualization module is used to present students' video watching tracks and learning results. Using this system, it is easy for educators and researchers to evaluate the learning effect of students via video. These evaluation results can be used to improve the quality of student learning and teacher instruction.
Key words: Behavior collection, behavior visualization, learning analytics, online video.
1.
Introduction
With the development of technology, the way people learn has changed a lot. People are no longer limited to learning from traditional classrooms. The arrival of online learning has provided new ways of learning for many people, and more and more people are learning through online classrooms. In online learning, instructional video is often the main learning material provided by the learning platform, and it is also a module that learners spend more time on [1]. However, due to the separation of teachers and students in online learning, it is difficult for teachers to know the video viewing process of students. Therefore, it is particularly important to collect the video watching behavior of students and to analyze students' learning process during video viewing.
To solve above problems, this paper develops a video learning analytics system that collects and visualize students' learning behaviors related to instructional videos. The analysis of these behaviors allows teachers to understand students' learning effects via video and hence adjust teaching strategies in time. The following sections presents this system in details and gives an initial evaluation of the system.
2.
Literature Review
are adopting the flipped classroom model or the blended learning model, combining online learning and face-to-face teaching, to improve students' engagement and participation [2]. In these teaching models, videos are used as the main teaching materials. Therefore, it is extremely important to collect and analyze the video behaviors of students to understand their learning effects.
The existing ways of collecting students' behaviors for watching videos include eye tracking technology, brain-computer interaction technology and web log analysis. Eye tracking technology uses eye tracker to track students' eye movement while watching videos, and collects the monitoring data of their eye movement during the learning process to analyze their learning effects [3]. Brain-Computer interaction (BCI) technology analyzes students' attention to video content by collecting EEG data from their learning process [4]. The way of web log analysis helps teachers understand the video viewing of students through the video module data recorded in the system log, such as the user watched a video at a certain time [5]-[10].
However, these ways of collecting students' video behaviors have some shortcomings in the implementation process. For example, eye tracking technology and brain-computer interaction technology need to install relevant equipment before data collection, which is costly and has higher requirements for equipment. The way to collect student video behavior data through web logs is not very optimistic in the collection results. What the server log records are some basic user data and some overall behavior data. There are no detailed records about the interaction between students and the videos. Therefore, teachers or researchers cannot know the learning effects of students clearly. Additionally, this collection method called web log analysis also has certain requirements for the platform used in the teaching process.
Because many existing platforms do not share the collected behavior data to others, there are also some researchers have designed their own system for collecting students' video watching behavior to study the behavior data of video module specifically. Giannakos, Chorianopoulos and Chrisochoides (2015) designed a system to collect and analyze video behavior of students [11]. This system mainly collected and analyzed the clickstream interactive data of the video module and studied the relationship between video clickstream data and students' attitude and learning effect. Ma and Xu (2014) designed a system that used the web video technology to collect video interactive behavior data of students [12]. This system was based on the JWPlayer video player and used JavaScript to collect behavior data, such as the number of times a user clicked on the play or pause button while watching a video, and the progress of the video when the user leaved the page.
It can be seen that compared with traditional ways of collecting video behavior data, the data collection through the video learning analysis system has the following advantages: 1) there is no need of hardware support and its application is simple; 2) it can collect detailed interactive data between students and videos and the data are objective; 3) it can be easily embedded into existing online learning platforms. However, many existing video learning analysis systems can only analyze collective data, lack the function of individual analysis, and cannot provide personalized services. Therefore, this paper designs a video learning analytics system that teachers can not only view the overall video watching behavior of the whole class, but also clearly understand the video watching track of each student. Through the analysis of these tracks, personalized teaching services can be provided with students.
3.
Method
3.1.
System Design
visualization and database. The architecture of this system is presented in Fig. 1.
User data
(user name, password, student number, student name )
Learning materials
(instructional videos, questions of quiz)
Video
(watch instructional videos)
Quiz
(answer questions in the quiz)
Teachers
Students Login
(input user name and password)
Visualization
(the visualization of video interaction data)
Select a video
Select a video Learning behavior data
(interaction behavior, quiz result)
Database
Database
Jump to
Behavior data
Results
Fig. 1. The architecture of the video learning analytics system.
To ensure the validity of learning behavior collection, the login module is firstly introduced in this system. Only students who are enrolled in the course and teachers who teach the class can log in to this system successfully. For students, they can select an instructional video to watch in the video module and finish related quiz in the quiz module to evaluate their learning outcomes. In the process of learning, their video behavior data and quiz results are collected and stored in the database. For teachers, they can select a video to view related video watching tracks of students through the visualization module. The video watching tracks are the visualization of collected video behavior data in the database.
3.2.
System Implementation
The system was built on a cloud virtual machine (CVM) and used the Windows + Apache + MySQL + PHP integrated environment as the development environment. It was developed based on a ThinkPHP framework, which is a free, open source, fast and simple object-oriented lightweight PHP development framework. The following presents the implementation of this video learning analytics system in five modules.
3.2.1.
Login module
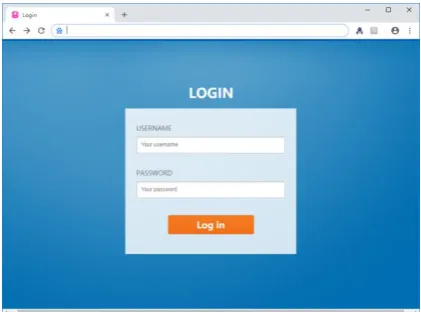
In this module, the username and password of registered users are their student number or teacher number. The webpage of login module is shown in Fig. 2. After users input their username and password and click the login button in their browsers, the client will send asynchronous request to the server using the AJAX technique. The server receives the request, compares the received username and password with user information in the database and gives a corresponding response.
Fig. 3. Screenshot of the video player webpage.
3.2.2.
Video module
The video module is the core module of this system. The webpage of video module is shown in Fig. 3. This module mainly responsible for the play of instructional videos and the collection of students' video behavior data. It is based on the VideoJS video player and uses JavaScript to collect the behavior data of students. The JavaScript technology gets current time of the video every second and post collected time data to the sever when students watched the video. The server receives these data and stores them in the database for the visualization module.
3.2.3.
Quiz module
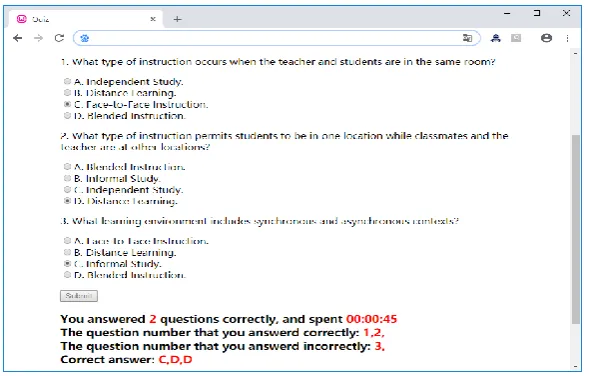
The quiz module in the system is used to evaluate the video watching effect of students. After the video ending, it automatically jumps to the quiz module to detect students' mastery of the knowledge points in the instructional video. The webpage of quiz module is shown in Fig. 4.
After students choosing the answer and clicking the submit button, the results are showed at the bottom of the webpage and recorded in the database simultaneously. Therefore, teachers can know students' results in the quiz module through the data recorded in the database and give a detail presentation of the knowledge points involved in the questions which have a high error rate.
Fig. 5. Screenshot of the visualization webpage.
3.2.4.
Visualization module
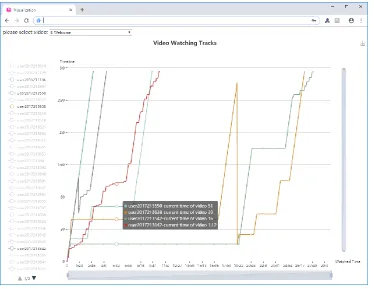
The visualization module mainly presents the students' video watching behavior data through their video watching tracks. It is developed based on the ECharts, which is a powerful charting and visualization library offering an easy way of adding interactive and highly customizable charts to some products. The webpage of visualization module is shown in Fig. 5. Since the amount of data is too large, Fig. 5 presents a part of users' video watching tracks.
At the top of the webpage, teachers can select an instructional video to query behavior data of the selected video from database and displayed queried results in the graph. On the left is the username of queried data, that is, the student’s student number. The username can be clicked to show or hide the watching track of the user. The horizontal axis of the graph indicates the watched time that students watched this video; the vertical axis indicates the timeline of this video. When the mouse is over it, the current time of videos on the specified horizontal coordinate is displayed. Both the horizontal axis and the vertical axis can be dragged and arbitrarily zoomed, and can also be scaled by the mouse wheel, which can enlarge a part of the chart to analyze users' behavior data in detail.
3.2.5.
Database module
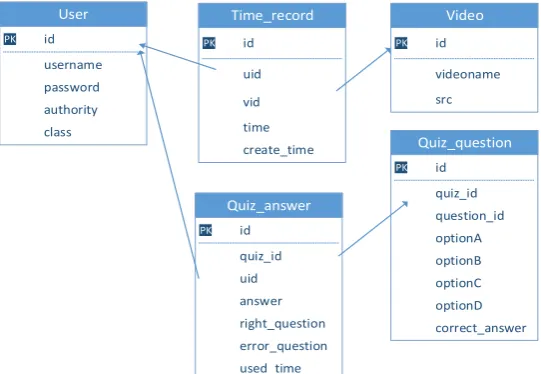
Database plays a very important role in this system. A database of MySQL is integrated into this system and there are five major tables in this database. Any one of the tables has a key, which is shown in Fig. 6.
collection table (Quiz_answer). The User table stores the information of students and teachers of this course, and sets different authority values for them to define the operating range of different users for this system. The Video table records the name of videos in this course as well as the corresponding link of playing videos. The Quiz_question table stores the questions and options of quizzes and the correct answer of each question. The Time_record table stores the collected interaction behavior data when students watch videos, which is convenient for the visualization module to read these collected data and visualize it. The Quiz_answer table records students' answers and their used time to complete the quiz questions.
User Time_record Video
Quiz_answer
Quiz_question
id
PK
username password authority class
id
PK
videoname src id
PK
uid
vid time create_time
id
PK
quiz_id uid answer right_question error_question used_time
id
PK
quiz_id question_id optionA optionB optionC optionD correct_answer
Fig. 6. Structure of the database used in our system.
4.
Results
A total of 89 second-year undergraduate students from a Chinese university have used the video learning analytics system. The students were enrolled in the course “Instructional Technology and Media” which was taught in a blended learning model. After more than a month usage, approximately 1,000 learning behavior data were collected.
From the visualization module in the system, teachers basically learned about students' pre-study situation of instructional videos. For example, at around 16, 39 and 51seconds of the selected video in Fig. 5, students have the pause behavior; at one minute and seventeen seconds (1:17) of the selected video in Fig. 7, there has a seeking backward behavior. It can be seen from the Figure 5 that the watching track is a horizontal straight line at around 16, 39 and 51seconds, which means the current time of the video has been 16, 39 and 51 seconds during corresponding watched time of students. Additionally, it can be seen from the Fig. 7 that the watching track drops to the 45 second at the turning point of one minute and seventeen seconds (1:17), which means the user whose student number is 2017213553 goes back to the 45 second at this time. The teaching contents around this time are potentially difficult for this student to understand.
Therefore, teachers should give a further explanation of the corresponding knowledge points during these periods in the classroom. At the same time, for the questions with high error rates in the quiz module, teachers should analyze and discuss these questions with students in class and give solutions to them.
5.
Conclusion
With the widespread application of flipped classroom and the blended teaching, more and more students are learning via online video. In the process of students watching videos, a large amount of behavior data is generated which can be used to analyze students' learning. Once teachers understand the process of students watching videos, they can analyze the difficulties of teaching contents. The video learning analytics system presented in this paper has the ability to collect detailed behavior data of the interaction between students and videos. More importantly, the visualization function provided by this system can present students' video learning tracks clearly and hence assists teachers to find out learning difficulties. Integration of this system with existing online learning platforms, such as Moodle, could provide higher-quality services for students.
Acknowledgment
This work was supported by the MOE (Ministry of Education in China) Project of Humanities and Social Sciences(Project No.17YJC880081), and self-determined research funds of CCNU from the colleges’ basic research and operation of MOE(CCNU19QN020).
References
[1] Li, L. Y., & Tsai, C. C. (2017). Accessing online learning material: Quantitative behavior patterns and their effects on motivation and learning performance. Computers & Education, 114, 286-297.
[2] Maarop, A. H., & Embi, M. A. (2016). Implementation of blended learning in higher learning institutions: A review of literature. International Education Studies, 9(3).
[3] Contier, A. T., & Torres, L. B. (2017). Using eye tracking to map behaviors in an online course prototype about epilepsy. Proceedings of International Conference on Distributed, Ambient, and Pervasive
Interactions (pp. 505-513). Vancouver, Canada.
[4] Galway, L., Mccullagh, P., Lightbody, G., Brennan, C., & Trainor, D. (2015). The potential of the Brain-computer interface for learning: A technology review. Proceedings of IEEE International Conference on Computer and Information Technology; Ubiquitous Computing and Communications;
Dependable, Autonomic and Secure Computing; Pervasive Intelligence and Computing (pp. 1554-1559).
Liverpool, UK.
Industries, 9(1), 27-47.
[6] Shi, C., Fu, S., Chen, Q., & Qu, H. (2014). VisMOOC: Visualizing video clickstream data from massive open online courses. Visual Analytics Science & Technology (pp. 277-278). Paris, France.
[7] Brinton, C. G., & Chiang, M. (2015). MOOC performance prediction via clickstream data and social learning networks. Computer Communications, 2299-2307, Kowloon, Hong Kong.
[8] Brinton, C. G., Buccapatnam, S., Chiang, M., & Poor, H. V. (2015). Mining MOOC clickstreams: On the relationship between learner behavior and performance. Computer Science, 64(14), 1-1.
[9] Kaur, N., & Aggarwal, H. (2015). Web log analysis for identifying the number of visitors and their behavior to enhance the accessibility and usability of website. International Journal of Computer
Applications, 110(4), 25-30.
[10]Brinton, C. G., Buccapatnam, S., Chiang, M., & Poor, H. V. (2016). Mining MOOC clickstreams: Video-watching behavior vs. in-video quiz performance. IEEE Transactions on Signal Processing, 64(14), 3677-3692.
[11]Giannakos, M. N., Chorianopoulos, K., & Chrisochoides, N. (2015). Making sense of video analytics: Lessons learned from clickstream interactions, attitudes, and learning outcome in a video-assisted course. International Review of Research in Open & Distance Learning, 16(1), 260-283.
[12]Ma, C. H., & Xu, Y. Y. (2014). Research and solution on data collection of learning analytics based on collecting the behavior data of learners when watching online video. China Higher Education
Information Academy, Shanghai, China.
Qiusha Min received the B.S degree in educational technology from Jianghan University, Wuhan, China, in 2007, and the Ph.D degree in engineering from Dublin City University, Dublin, Ireland, in 2013.
She is currently a lecture in the School of Educational Information Technology, Central China Normal University. Her main research interests include learning analytics, web / mobile application development, and multimedia systems.
Yating Chen received the B.E degree from HuBei Normal University, HuangShi, China, in 2017.
She is currently a postgraduate in the School of Educational Information Technology, Central China Normal University. Her main areas of research are learning analytics and machine learning.
Dan Xia received the Ph.D degree from Huazhong University of Science and Technology, China, in 2012.