Examining the Predictive Validity of Emotional-Social Intelligence on Project Management Success in Software Development Teams
Michael G. Brizek, Ph.D.
Associate Professor Department of Management
College of Business Lander University Carnell Learning Center M62
Phone: (864) 388-8753 Email: [email protected]
USA
Mark R. Murphy, Ph.D. Project Management Institute
Albuquerque, New Mexico
Abstract
The problem addressed in this study was the high failure rate in technology projects due to interpersonal issues among team members. According to the Standish Group CHAOS Report, over half of all technology projects fail due to the break down in interpersonal relationships in software development teams. These failures may threaten business survivability. An emerging view among project managers is that although tools and specific processes are important, interpersonal team dynamics and emotional-social intelligence (ESI) may make a difference in successful project outcomes. In this quantitative, correlational study, emotional-social intelligent (ESI) competencies communication, motivation, and conflict resolution were investigated as predictors of project success. Participants from 53 agile and 51 traditional software development teams from a major IT organization (N=104), completed online questionnaires to measure ESI competencies and project success. ESI levels were measured using the Team Emotional and Social Intelligence 2.0 (TESI) survey, and project success was measured with the Project Implementation Profile (PIP) assessment. The relationship between communication, motivation, and conflict resolution and project success in agile project teams were not statistically significant (p >.05). The relationship between communication, motivation, conflict resolution and project success in traditional project teams was not statistically significant (p >.05). The findings of this study indicate further research using an experimental design with the TESI using a pre and post intervention testing after coaching to develop ESI core competencies, to include emotional awareness, stress tolerance, and team identity. Further evaluation of social environment factors to determine project success is also recommended.
Keywords: Project management, Emotional Social Intelligence, competency, project success, agile project teams Introduction
Software development projects are frequently failing due to cost overruns (Edmondson & Nembhard, 2009; Sigmar, Hynes, & Hill,2012). Researchers have indicated two primary causal factors in the cost overruns: interpersonal issues between team members throughout the entire project process and uncertainty in customer expectations (Gunsel & Acikgoz, 2013; Lui, Chen, Chen,
& Sheu,2011; Sharp&Ryan,2011).Organizational success depends on a number of nontechnical issues that are cultural in nature, such as emotional-social intelligence (ESI) competencies among employees in the corporate sector (Cesare, Lycett, Macredie, Patel, & Paul, 2010; Ghosh, Shuck, & Petrosko, 2012).
important factor in determining success in teams by addressing interpersonal conflict through understanding and managing human emotions (Mayer, Salovey,& Caruso,2008). Unlike intelligence quotient (IQ), which is resistant to change, emotional-social intelligence can be acquired, learned and developed through performance management (Arghode,20 13, Ghosh et al., 2012;
Methot, Crawford, LePine, &Buckman,2011).
Performance management is a systematic process by which an organization monitors team performance in planning, setting expectations and developing the capacity to perform (Barczak, Lassk, & Mulki,2010; Nielsen, 2014). A growing body of literature shows increasing interest in emotional-social intelligence team-based assessments as a basis for managing project performance to improve organizational productivity and success (Turner & Walker, 2008; Mayer et al., 2008).
Agile project methodologies are challenging
traditional methods by implementing iterative
development in which requirements and solutions evolve through cross-functional teams to meet customer needs in software development (technology) projects (Gunsel & Acikgoz, 2013; Naseer, Chishti, Rahman, & Jumani, 2011). Agile project management is a series of rapid iterative cycles to plan, design, build, and test software with immediate feedback required from the customer or stakeholders for successful development (Nwachukwu, 2010). In contrast, traditional software project methods involve discipline and deliberate planning and control methods performed in sequence, only moving to the next phase when the previous phase is complete (Blackstone, Cox, & Schleier, 2009;Müller & Turner, 2010). At the conclusion of this process, the customer may be dissatisfied with the product due to poor visualization at inception or underestimation of requirements that remain unseen until the product is delivered (Leybourne, 2009).
Goodpasture (2010) defined an agile team as a high-performance cross-functional group that has the ability and authority to define, build and test the software, in short iterations. Agile teams typically consist of 5 to 15 members, including programmers, testers, designers, and writers who have a hands-on role in product development with direct input from customers (Fernandez & Fernandez, 2009; Scott-Young & Samson, 2009). Agile methods tend to improve project performance over traditional teams due to naturally higher levels of team ESI, creating an upward spiral of
trust, group identity and group efficiency (Project Management Institute[PMI],2013).As a result of the acknowledged importance of understanding team processes, a growing body of literature has suggested
utilizing team-based emotional-social intelligence
assessments as a basis for managing project teams to improve organizational productivity and success (Turner & Walker, 2008; Mayer et al., 2008).
This study has furthered the body of knowledge and examined the relationship between agile and
traditional project team emotional-intelligence,
interpersonal competencies, and project success by utilizing one of the first team-based emotional-social intelligence assessments designed specifically for team performance (Barczak et al., 2010; May & Carter, 2012). Emotional-social intelligence is a human skill that engages the power to control self-awareness and social management of emotions to help influence important decisions in personal and professional aspects of life (Martin & Thomas, 2011).
Purpose of the Study
This quantitative correlational study examined team-based emotional-social intelligence and the relationship to project success by examining three interpersonal competencies of: (a) communication, (b) motivation, and (c) conflict resolution in agile and traditional software development teams. Considering the relationship between team emotional-social intelligence, interpersonal competence, and team performance, the findings can be used to maximize the productivity of organizations using agile methods (Adams & Anantatmula,2010; Gunsel & Acikgoz,2013; Scott-Young & Samson, 2009). Agile methods are based on the Agile Manifesto principles that focus on customer needs delivered by small iterative teams that specialize in
self-organization by lean production techniques
(Goodpasture,2010).Organizational leaders and managers can then design project teams using emotional-social intelligence assessments. As such, additional research is needed to verify if team-based emotional-social
intelligence assessments can improve project
performance and increase project success.
& Kuhn, 2011; Gunsel & Acikgoz, 2013).This study utilized two valid and reliable survey instruments to examine the level of emotional-social intelligence in each team and the relationship with project success factors that include performance measures in meeting budgets, schedules, and customer satisfaction. First, the Team Emotional and Social Intelligence (TESI) Survey developed by Hughes and Terrell measured the team emotional-social intelligence competencies of (a) communication, (b) motivation, and (c) conflict resolution (Hughes, Thompson, & Terrell, 2010). Research indicates that teams are more creative and productive when they achieve mutual trust and emotional identity (Adams & Anantatmula, 2010; Henderson & Stackman, 2010; Ghosh et al., 2012). Second, the Project Implementation Profile (PIP) assessment, developed by Pinto and Slevin (1992), measured project success as the outcome variable. An a priori power analysis was performed to determine the necessary sample size for conducting a multiple linear regression statistical model with three predictor variables and one outcome variable. A G*3.1.3 a priori power analysis predicted a minimum sample of 41participants are needed to achieve .80 power, .05 significance, and a medium effect size of 0.3. This analysis is based on 3 predictor variables. A stratified random sample represented 53 agile software development team members for RQ1. For RQ2, 51 traditional software development team members were examined. Analysis of the data collected from each team type completing the TESI and PIP involved two separate multiple linear regression analysis to determine whether a relationship existed between the predictor and outcome variables. The TESI Survey was used to examine team ESI skills utilizing the predictor variables of (a) communication (COM), (b) motivation (MOT), and (c) conflict resolution (CFR; Hughes, Thompson, & Terrell, 2009). The PIP assessment was used to collect and examine the outcome variable of project success. The quantitative correlational was the most appropriate for the study due to the necessity involving examining the possibility of a statistical association between the variables (Lemons, 2009). Finally, the data collected from each team completing the TESI and PIP was used to determine whether agile project teams possess higher levels of emotional-social intelligence than traditional project teams.
Emotional competence is what guides human choices and inspires behavior based on the level of positive or negative feelings. Mayer, Salovey, and Caruso (2008) described emotional-social intelligence as the aptitude to perceive, express, and logically process information provided by emotions in the self and others. Emotional-social intelligence offers the foundation for self-managed teams to develop competencies to help team members communicate and work together more efficiently, thus boosting project success rates and increasing profits (Adams & Anantatmula, 2010; Ghosh et al., 2012).
Research Questions
The research questions and associated hypotheses for the study are as follows:
Q1. To what extent, if any, is there a statistically significant correlation between the emotional-social intelligence competencies of communication, motivation, and conflict resolution as measured by the Team Emotional and Social Intelligence (TESI) Survey, and success in agile software teams, as measured by the Project Implementation Profile (PIP) assessment?
Q2.To what extent, if any, is there a statistically significant correlation between the emotional-social intelligence competencies of communication, motivation, and conflict resolution as measured by the Team Emotional and Social Intelligence (TESI) Survey, and success in traditional software teams, as measured by the Project Implementation Profile (PIP) assessment?
H10.There is no statistically significant correlation between the emotional-social intelligence competencies of communication, motivation, and conflict resolution as measured by the Team Emotional and Social Intelligence (TESI) Survey, and success in agile software teams, as measured by the Project Implementation Profile (PIP) assessment.
H1a.There is a statistically significant correlation between the emotional-social intelligence competencies of communication, motivation, and conflict resolution as measured by the Team Emotional and Social Intelligence (TESI) Survey, and success in agile software teams, as measured by the Project Implementation Profile (PIP) assessment.
measured by the Team Emotional and Social Intelligence (TESI) Survey, and success in traditional software teams, as measured by the Project Implementation Profile (PIP) assessment.
H2a. There is a statistically significant correlation between the emotional-social intelligence competencies of communication, motivation, and conflict resolution as measured by the Team Emotional and Social Intelligence (TESI) Survey, and success in traditional software teams, as measured by the Project Implementation Profile (PIP) assessment. Literature Review
There is growing research to support the value of emotional-social intelligence in the business and organizational environments(Bakker,2013;Ybarra, Kross, & Sanchez-Burks, 2013). For more than a decade, the concept of emotional-social intelligence as a way to
manage personalities has gained attention in
organizational and industrial psychology literature, indicating its utility for managing team dynamics (Bakker, 2013). Researchers have found that individuals were adept at identifying their own emotions and those of their colleagues showed increased interpersonal skills, and were more successful at work (Barczak et al., 2010; May & Carter, 2012).
Further, numerous studies examined emotional-social intelligence role in organizational management to determine if there was a positive impact on profitability (Adams & Anantatmula, 2010; Ghosh et al., 2012; Henderson & Stackman, 2010). Millikin et al. (2010) investigated how intrapersonal cohesion impacts self-managed team functioning through the use of performance management, although few scholars have tested how team cohesion moderates the influence of
team members’ self-regulation. Performance
management was found to be effective in measuring individual or group work behaviors. Additionally, teams that have shown good communication skills, both oral and written, resolve inter-team conflicts, minimizing impact on productivity and moral (Cesare et al., 2010). Effective communication is instrumental in creating effective and collaborative interaction, coordination among project team members, and the lack of effective communication leads to major problems in the project workplace and project outcome (Meredith & Mantel, 2009). Pant and Baroudi (2008) contended that project managers in companies with successful projects spend as much as 90% of their time communicating with their
teams. Sound interpersonal skills held by a project professional creates a working environment in which team members trust each other and feel comfortable to communicate freely. The primary importance of
Goleman’s research and findings provides an opportunity
to further investigate and gain new knowledge about possible applications for ESI behaviors in organizational management (Cote, Lopes, Salovey, & Miners, 2010).
Theoretical knowledge of ESI provides a strong foundation for understanding the concept of soft skills (Thompson,2008). Modern organizations are experiencing rapid business transformations to stay competitive in the globalization of the workforce and constant evolutions of technology in the information age (Edmondson & Nembhard,2009). Business trends such as increased privatization, outsourcing, and workforce diversity have required organizational leaders to implement innovative approaches, such as creativity through knowledge of social and emotional competencies (Methot et al, 2011).
The progression of theories about the role of ESI has opened the door for research on the influence of ESI not only on individuals, but on teams and organizations. According to Goleman(2007), social interactions and human behavior have advanced with increasing educational levels and organizational complexities of self-managed concepts in businesses. Similarly, Goleman (2007) reported that perceptions of ESI have gradually altered neurological research, along with investigations into the factors that contribute the ability to manage emotions.
2007). Continuing efforts to explore the variables related to ESI bridged the gap in the construction of theories for ESI and the impact of interpersonal relationships on human behavior and social interaction among project teams. While interpersonal skills have been considered critical to the performance of managers and supervisors, recent trends in the workplace have extended the importance of these skills to virtually everyone in the organization (Tsai, Chen, & Chin, 2010).
Software development methodologies are
continually evolving from the deficiencies of traditional project management methods (Standing, Guilfoyle, Lin, & Love, 2008). Agile project methods provide a viable way to enhance project performance (Fernandez & Fernandez,2009; Ghosh et al.,2012).Agile methodologies began in software development to provide frequent, incremental releases of innovative functions and features, prioritized for need and affordability (Williams, 2012). This methodology evolved iteratively from direct customer reflection and feedback (Goodpasture, 2010). These self-managed teams are small compared to traditional waterfall-style project teams and are inherently adaptable. Leaders of organizations in software development have strived since the 1960s to address the problems of cost, time, and quality, which were lost in traditional project management practices (Cesare et al., 2010). The philosophy behind traditional project initiatives had been questioned by the agile movement, which emphasizes the human aspect of software development above the engineering aspects (Cesare et al., 2010).
The primary importance of Mayer’s and
Salovey’s (2008) research and findings provides an
opportunity to further investigate and gain new knowledge about possible applications for
emotional-social intelligence behaviors within the team
environment (Cote, Lopes, Salovey, & Miners, 2010). Ribeiro and Fernandes (2010) examined and validated organizational constructs relating to the adoption of agile values and principles in order to measure and conceptualize their adoption in medium-sized business. Twelve case studies involving European business enterprises, 99.3% of which are classified as medium-size organizations, were successfully explored for
comparison (Ribeiro & Fernandes, 2010). The
researchers gained new insight through an interpretive case study that subjectively assessed the adoption of
agile methods to improve business processes and increase profitability. In manufacturing contexts, the distinctive features of agile organizations include responding more effectively and speedily to changing circumstances by adapting existing products or developing new ones to meet changing market demands (Gillies, 2011). Moreover, agile methods require an investment by team-based organizations to manage their employees by team-based emotional and social competencies. Agile methodologies are taking hold throughout the product development industry by rapidly changing the landscapes by delivering customer value quickly (Danner et al., 2011; Goodpasture, 2010).
Emotional-social intelligence is a dynamic system, and on a macro level it can be described as a person’s innate ability to perceive and manage his or her own emotions to achieve successful interpersonal interactions (Hughes et al., 2009). For the past 25 years, Mayer and colleagues (2008) have reported that perceptions of emotional intelligence had gradually altered neurological research, along with investigations into the factors that contribute to the ability to manage
emotions. Exploring and developing emotional
intelligence within teams may increase the ability to manage stress and sustain motivation (Hughes & Terrell, 2007).
A quantitative correlational design was used to examine the relationship among the three predictor
variables of team emotional-social intelligence
competencies: (a) communication, (b) motivation, and (c) conflict resolution, and the outcome variable of project success in agile and traditional software development teams. The correlational design was chosen to examine whether a relationship exists between emotional-social intelligence and performance in traditional and agile teams. When examining relationships among variables, researchers typically use a quantitative research method (Johnson & Christensen,2008). Thus, the quantitative method was most appropriate to collect, analyze, and report findings regarding the relationship between emotional-social intelligence skills and project success (Truscott et al., 2010).
Population
The population for this study consisted of agile and traditional project team members working in the computer software development industry. The population was limited to certified project professionals recruited through a major IT organization. The sample drawn from this population consisted of two types of project management team members, agile and traditional project professions. The majority of the members are PMI certified practitioners, PMI Agile Certified Practitioner (PMI-ACP), Certified Associates in Project Management (CAPM), and Project Management Professionals(PMP) the latter of which consists of traditional team members. In quantitative studies, representativeness is an important characteristic of the sample population selection (PMI, 2013).
The Project Management Institute (PMI)
membership consists of more than 700,000 technical project managers and practitioners in the United States, using various project methods for accomplishment (PMI, 2013). Additionally, PMI is a non-profit organization that has globally recognized standards and certification program, extensive academic and market research programs, chapters and communities of practice, and professional development opportunities (Meredith & Mantel, 2009).
While the trends of adapting and tailoring software development processes in the past have failed, many organizations are now turning to educating the teams on emotional intelligence principles to increase competitiveness among the software development
industry(Davis,2011; Leimbach & Maringka,2010;
Ribeiro & Fernandes, 2010). Cesare et al.(2010) focused on communication and collaboration, team involvement, reflection among team members, and design in their research survey. The participants indicated a poor understanding of the principles and their application in the team environment (Cesare, 2010). These results indicate the rational for determining the role of team emotional-social intelligence in software development team success by exploring three critical interpersonal competencies, communication, motivation, and conflict resolution.
Agile and traditional team members were selected for this study to determine if emotional-social intelligence affects project success in technology projects. A high level of congruence exists in the software development industry with agile and traditional teams, which allows the best probability of identifying potential correlations (Davis, 2011; Leimbach & Maringka,2010). Agile project teams support software development teams by providing the ability to change direction in scope and project operations throughout the life-cycle of the project which may foster success (Meredith & Mantel, 2009; Sharp & Ryan, 2011). Traditional project teams use a linear style of process of completing stages in sequence to accomplish a defined set of task (Ghoniem, Khouly, Mohsen, & Ibrahim, 2011; Johnson, 2011).
Sample
Purposive sampling is a non-probability sampling technique (Teddlie & Yu, 2007). In purposive sampling, the sampling units within the population have the most preferred characteristics containing the information needed for research (Johnson,2011). Participants were selected based on specific characteristics, including participation as a software development team member with a PMI certification. Quantitative studies use purposive sampling to establish a representative sample for the intended study.
type. The sample represented the highest qualified project management practitioners working on agile and
traditional project teams meeting PMI’s minimum
standards for PMI-ACP, CAPM, and PMI certifications (Kember & Leung,2008). Furthermore, this method of selection facilitated replication of the study and strengthens the external validity. The participants were contacted for research through a corporate sponsor as a professional courtesy after receiving written permission from the selected IT organization.The participants completed the surveys online at their convenience during the month-long time frame allotted for survey completion. This method minimized the negative effect encountered by routine work requirements and deadlines.The participants have no business or personal relationship with the researcher. To increase external validity and understanding of the Team Emotional and Social Intelligence instrument, the researcher has passed certification training facilitated by Collaborative Growth, LLC for administering and grading the results of the team assessment.
An a priori power analysis was performed to determine the necessary sample size for conducting a multiple linear regression statistical model with three predictor variables and one outcome variable. A G*3.1.3 a priori power analysis predicted a minimum sample of 41participants is needed to achieve .80 power, .05 significance, and a medium effect size of 0.3. This analysis is based on 3 predictor variables. Effect size helps readers understand the magnitude of differences found, whereas statistical significance examines whether the findings are likely to be due to chance (Vogt, 2007). Both are essential for readers to understand the full impact of the study. According to Vogt (2012) a medium effect of .5 is visible to the naked eye of a careful observer. A small effect of .2 is noticeably smaller than medium but not so small as to be trivial. Similarly, a large effect of .8 is the same distance above the medium as small is below it.
A multiple linear regression was conducted for each research question (RQ). A stratified random sample representing participants from a minimum sample of 41 agile software development team member participants were examined for RQ1. For RQ2, a minimum of 41 traditional software development team members were examined. Analysis of the data collected from each team member completing the TESI and PIP involved multiple
linear regression analysis to determine whether a relationship existed between the predictor and outcome variables. The TESI Survey will examine team ESI skills utilizing the predictor variables of (a) communication (COM), (b) motivation (MOT), and (c) conflict resolution (CFR; Hughes, Thompson, & Terrell, 2009). The PIP assessment was used to collect and examine the outcome variable of project success. The quantitative correlational was the most appropriate for the study due to the necessity involving examining the possibility of statistical association between the variables (Lemons, 2009).
The quantitative correlational design examined the existence of a relationship between the predictor and outcome variables. This study collected data from participants using two different instruments, Team Emotional and Social Intelligence Survey and Project Implementation Profile assessment. A survey was the appropriate data collection method, providing an economical and efficient means of assessing information from the target population (Zikmund et al., 2010).
conflict resolution subscales were included in the data analysis of the study. The research indicates these are the critical aspects of emotional-social intelligence in team environments (Davis, 2011; Leimbach & Maringka, 2010). Nevertheless, data for all seven TESI subscale variables were collected to accomplish future research in this field. Additionally, demographic information was collected and presented in future research: (a) gender, (b) age, (c) years in the team (Hughes et al., 2010).
The validity of the TESI was tested for psychometric soundness with basic and advanced statistical analyses. Inter scale correlations were determined, ranging from .75 to .88, all significant at the .05 level (Hughes et al., 2010). The most strongly correlated scales were positive mood (POM) and motivation (MOT); and awareness (AWA) and communication (COM) (Hughes et al., 2010). The TESI was formed on a sample of teams throughout the United States and Canada (Hughes et al.,2010). The participants were composed of 1,342 team members, 42% male and 58% female, ranging in age from 20 to 80 years of age with an average age of 44.3 years (Hughes et al., 2010). Three primary interval variables (communication, motivation, and conflict resolution) addressed specific research interest in agile and traditional project teams (see Table 1 below). The TESI construct validity was accomplished by comparing nominal variables to the TESI scales, which measured the correlation strength
between the team member’s performance and response to
the three interval scales included in the assessment (Hughes et al., 2010).
Additionally, three validity indices are included with the TESI assessment: missing items, response consistency, and response conformity (Hughes et al., 2010).To demonstrate the plausibility of the instrument’s reliability, the TESI provides feedback to the average number of items the participants have not provided a response and compensate for missing data in order to provide accurate and valid results (Hughes et al., 2010). Furthermore, the response consistency indices monitor the level of congruence in the answers by each team member (Hughes et al., 2010). Any deviation from this response pattern is identified by the response
inconsistency percentage value. Lastly, response
conformity has 10 built-in monitors for deviations from the normal average, listed as either high or low non-conformity percentage (Hughes et al., 2010). If the
averages exceed 15%, the results should be placed in context to the circumstance the team is encountering and may not be used for interpreting the results for that team.
Discrepancies, such as missing data on individual assessments, were excluded from the analysis. The TESI 2.0 is a computer based assessment, requiring participants to answer the question fully prior to advancing. The TESI was designed to measure interval Likert-type scale responses, described by Castellan (2010) as an ascertainment of attitudes in which the total score in the 5-point scale quantifies the trait or attitude in order to achieve maximum reliability and validity. Permission was granted (see Appendix A) and a license purchased from Collaborative Growth, LLC to use the TESI 2.0 Survey in the analysis of the study.
Various team participants across North America were sampled in the instrument validation process, including, large and small corporations, public school systems, local and state and federal government agencies, privately held companies, non-profit organizations, and consulting agencies (Hughes et al., 2010). The descriptive statistics revealed the average team index (team average) percentage score for the sample was 69.0%, with a standard deviation of 15.40 to 17.58, and skewness, measuring the asymmetry of the probability distribution of a random variable, of -0.41 to -0.82 (Hughes et al., 2010).In addition, variability is characterized by Pearson’s measure of kurtosis, which is used to identify whether the data is peaked or flat relative to a normal distribution and the tails’ weight in relation to the distribution (Black, 2005).
The results of the kurtosis analysis ranged from 0.42 to 0.78, while a uniform distribution will fall between -0.3 to 3.0 depending on the population size
(Black,2005). Construct validity indicated high
alpha was used to measure reliability of the constructs in the study. The stress tolerance and conflict has Cronbach alphas of .84 and .86 respectively, which is considered excellent. A reliability coefficient of .70 and higher is considered acceptable, the overall Cronbach alpha score for the TESI is .98, which is also considered strong and reliable (Cozby, 2009; Hughes et al., 2010).
Project Implementation Profile
The second instrument, the Project Implementation Profile (PIP), developed by Pinto and Slevin and published and licensed by Xicom Inc., was used to collect data for the outcome variable, project success (Pinto & Slevin, 1992). The Project Implementation Profile instrument was chosen for the current research study based on its validity and wide range of empirical research studies and commercial applications to measure project success (Finch,2003; Hyvari,2006; Jones 2007). Project success or failure is contingent upon a variety of criteria, to include adherence to schedule, budget, and client satisfaction (Pinto and Slevin,1988). From their extensive research, Pinto and Slevin (1989) were able to validate the PIP in measuring project success and factors that support project implementation.This validated assessment addressed the two research questions in terms of measuring project success in agile and traditional teams presented in a series of statements related to the factor whereby the participants can rate each statement on a 7-point Likert scales (Slevin & Pinto, 1987).
The Performance Implementation Profile
instrument will measure project success, using questions related to 12 performance factors (PF; Pinto & Slevin, 1992). Examples of the 12 questions are: (1) “This project has/will come in on schedule”, (2) “This project has/will come in on budget”, (3) “The project that has been developed looks as if it will work”, (4) “The project will be used by the intended clients.” In addition to measuring the project success factors, Slevin’s and Pinto’s (1986) instrument is able to categorize 10 critical success factors (CSF) to determine whether successful project implementation exists from planning through post-implementation stage. The critical success factors are: (a) client acceptance, (b) client consultation, (c) communications, (d) monitoring and feedback, (e) personnel, (f) project mission, (g) project schedule or plan, (h) technical tasks, (i) top management support, and (j) troubleshooting (Slevin & Pinto, 1991). In addition to the project success scales the participants will complete
10 CSF identified in the PIP for future research. The 12 performance factors and 10 CSFs provide feedback on the projects health, the performance factors allows the project manager to assess human behavior (soft skills) aspects of the team. The CSFs provide project monitoring based on 400 projects, for which percentile scores have been developed to compare critical dynamics during the project lifecycle (Pinto, 1990).
Twelve primary interval variables address specific research interest in agile and traditional project team members (Table 2). The PIP construct validity was accomplished by comparing nominal variable to the EQ-i scales, which measures the correlation strength between the team members’ performance and response to the critical success factors related to project success (Pinto and Slevin,1988). Pinto and Slevin (1986) validated the PIP from project participants over a 2-year period to capture suggestions on project success. During this period, Pinto and Slevin (1989) collected data from 159 projects among several industries using the PIP instrument. Pinto and Slevin (1989) used regression analysis on the collected data to research important project success predictors and in the individual factor importance with each project phase. Rosacker and Olson (2008) successfully used the PIP survey to test IT project critical success factors. Data extracted for the study helped to improve produce sustainable productivity. Hyvari (2006) used the PIP as a comparison to a primary survey to examine the success factors of project management in organizations and how need and expectations can be presented to ensure project success.
Pinto and Slevin validated the PIP using several
studies to determine construct, predictive, and
Nwachukwu (2010) utilized the PIP instrument to study critical success factor relationships among high-level information technology project management consulting firms. Nwachukwu collected data from 69 technology projects, focused on software planning, scheduling, and tracking using the PIP (Nwachukwu, 2010). Nwachukwu (2010) performed correlation
analysis to establish factors predicting project
performance. The correlation analysis identified
relationships among critical success factors with project success, with the exception of top management support (Nwachukwu, 2010).
The Cronbach alpha scores, used to assess and measure reliabilities for the 10 critical factors and success measures, ranged from .79 to .90 (Pinto & Prescott, 1988). A confirmatory factor analysis was conducted separately for each of the 10 critical success factors and in every case only one factor emerged, suggesting construct validity for each of the 10 factors in the PIP (Finch, 2003). Further, the factor loadings ranged
from .49 to .90 with average being .64
(Pinto&Prescott,1990). Evidence exists for the reliability of the Project Implementation Profile instrument. Cronbach’s coefficient alpha is the measure of reliability considered adequate for psychometric studies focused on emotional and social intelligence assessments (Multon & Coleman, 2010). Gattiker and Larwood (1986) assessed the reliability using Cronbach’s coefficient alpha and found four dimensions of project management ranged from .65 to .79. For this reliability test, the four dimensions measured were: (a) conceptual (phase 1), (b) planning (phase 2), (c) execution (phase 3), and (d) termination (phase 4; Pinto & Slevin,1989). The overall reliability average was .73, which is the above recommended .70 minimum desired (Peterson &
Kim,2013). To decrease the chance of missing data, the use of digital web based assessments were provided to
participants. Additionally, the researcher closely
monitored the completeness of the data during collection to identify whether missing items were random or non-random.
Results
A total of 1,028 software development employees received email invitations to participate in the study.
Potential participants completed two online
questionnaires along with the questions regarding demographics such as age, gender, and years on the team. In all, 225 (21.89% response rate) surveys were collected. Out of 225 completed surveys, 121 TESI surveys and 104 PIP were completed in their entirety. Of the 121 TESI completed surveys, 17 respondents failed to complete the PIP in its entirety. As the research design required a complete datasets from all participants, the data associated with these 17 respondents were removed, leaving 104 valid respondents. As a result, the team break down for the 104 respondents was 53 agile team members and 51 traditional team members who participated in the study.
Tables 1, 2, and 3 display the cumulative aggregated demographic data for both team types. Three
demographic factors were collected from the
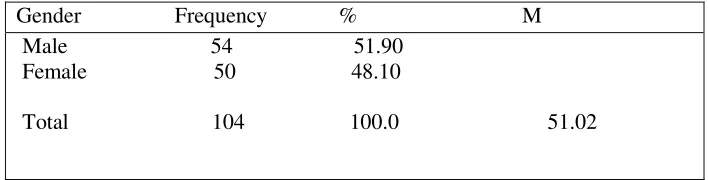
participants: gender, age, and years of experience on the current project team. The majority of the participants (51.90%) were male and slightly less than half (48.10%) were females. The ages ranged from 30 years to 66 years (M = 51.02, SD = 7.7), with the largest group (7.7%) at age 55 years. The mean age of participants was 51 years as shown in Table 1, with more specific age breakdown is shown in Table 2.
Table 1
Descriptive Statistics for Gender and Age (N=104) Gender Frequency % M
Male 54 51.90 Female 50 48.10
Table 2
Frequency and Percent for Age (N=104)
Frequency Percent
Valid Percent
Cumulative Percent
Valid 30 1 1.0 1.0 1.0
33 1 1.0 1.0 1.9
35 4 3.8 3.8 5.8
36 1 1.0 1.0 6.7
38 2 1.9 1.9 8.7
40 2 1.9 1.9 10.6
41 1 1.0 1.0 11.5
42 2 1.9 1.9 13.5
43 2 1.9 1.9 15.4
44 3 2.9 2.9 18.3
45 5 4.8 4.8 23.1
46 5 4.8 4.8 27.9
47 5 4.8 4.8 32.7
48 2 1.9 1.9 34.6
49 2 1.9 1.9 36.5
50 5 4.8 4.8 41.3
51 5 4.8 4.8 46.2
52 6 5.8 5.8 51.9
53 5 4.8 4.8 56.7
54 7 6.7 6.7 63.5
55 8 7.7 7.7 71.2
56 2 1.9 1.9 73.1
57 7 6.7 6.7 79.8
58 4 3.8 3.8 83.7
59 3 2.9 2.9 86.5
60 5 4.8 4.8 91.3
61 3 2.9 2.9 94.2
62 2 1.9 1.9 96.2
63 1 1.0 1.0 97.1
64 2 1.9 1.9 99.0
66 1 1.0 1.0 100.0
Total 104 100.0 100.0
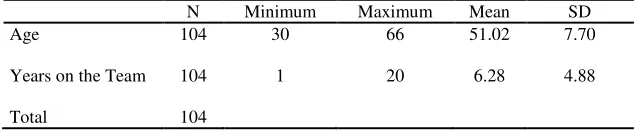
Minimum, maximum, mean, and standard deviation were computed for the respondents’ ages and years on the current teams. The results are shown in Table 6. The mean overall for years on the team was 6.28 (SD =
4.88). Longevity can be an indicator to a manager regarding the member’s current motivation level and perspective in terms of the team’s functionality (Lee et al., 2013).
Table 3
Descriptive Statistics for Age and Years on the Team (N=104)
N Minimum Maximum Mean SD
Age 104 30 66 51.02 7.70
Years on the Team 104 1 20 6.28 4.88
Prior to performing the regression analyses to answer the research questions of this study, the assumptions of the multiple linear regression models were tested. The assumptions tested included linearity, homoscedasticity, independence, and normality (Field, 2013). According to Field (2013), violation of the assumptions changes the interpretation of the results and the conclusion of the research.
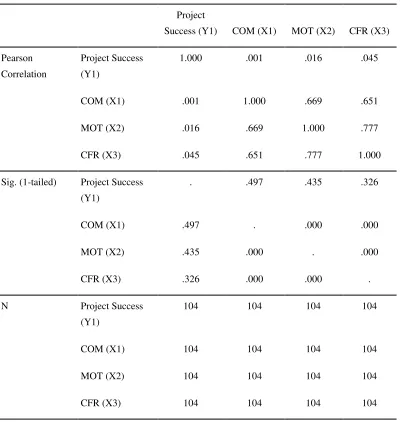
The preliminary analysis using the correlation matrix to determine if a relationship exists between the variables (Field,2013). Table 4 displays the correlations
for each of the three predictor variables in the study in relation to the outcome variable. As exhibited in Table 7, no significant correlation exists (r = .001, p > .01) between communication and project success. Also, there is no significant correlations (r = .016, p > .01, r = .045, p > .01) between competencies motivation and conflict resolution in Table 4. Although, Table 4 reveals a positive relationship between the variables, the highest between motivation and conflict resolution (.777).
Table 4
Correlations (N=104)
Project
Success (Y1) COM (X1) MOT (X2) CFR (X3)
Pearson
Correlation
Project Success
(Y1)
1.000 .001 .016 .045
COM (X1) .001 1.000 .669 .651
MOT (X2) .016 .669 1.000 .777
CFR (X3) .045 .651 .777 1.000
Sig. (1-tailed) Project Success
(Y1)
. .497 .435 .326
COM (X1) .497 . .000 .000
MOT (X2) .435 .000 . .000
CFR (X3) .326 .000 .000 .
N Project Success
(Y1)
104 104 104 104
COM (X1) 104 104 104 104
MOT (X2) 104 104 104 104
The second assumption tested was that the relationships between the outcome variable and predictor variables were linear. None of the scatter plots showed any evidence of nonlinear relationship. It is crucial with multiple regressions that the values of the outcome variable form a linear relationship and lie in a straight line when plotted on a graph (Field, 2013). A scatter plot was used to test the assumptions of linearity and homoscedascity. The spread of the residuals was approximately the same regardless of the predicted values, which were indicative of homoscedasticity. The scatter plots of the scores appear as roughly a straight line, rather than a curve. Therefore the assumptions of linearity and homoscedasticity were not violated (Pallant, 2013).
Assessing the assumptions is critical in evaluation of the model. The assumptions ensure the residuals are normal by analyzing the normal probability plot (P-P) of the regression. Furthermore the standardized residuals
and the scatter plot must be analyzed. The normal P-P plot showed that the points were in a reasonably straight diagonal line, suggesting that there were no major deviations from normality. Next, the scatter plot of the standardized residuals, indicated the scores were rectangular in distribution, with a majority of scores concentrated in the center, which supports the normality of residuals (Field, 2013). The presence of univariate outliers was checked from the scatter plot with standardized values no more than 3.3 or less than -3.3 (Tabachnick & Fidell, 2007).
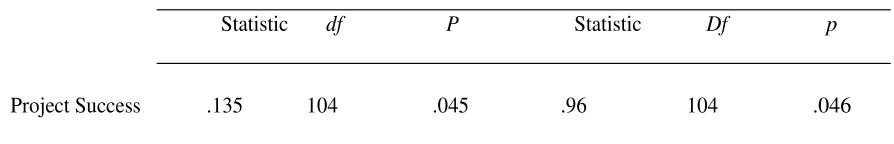
In addition, the Kolmogorov-Smirnov and Shapiro-Wilk statistics were also conducted on the total population. The p values of both tests were less than .05 (p< .05), suggesting that the assumption of normality may have been violated (see Table 4).A graphing method was used to test the normality assumption of the outcome variable.
Table 5
Tests of Normality using the K-S and Shapiro-Wilk Statistic
Kolmogorov-Smirnov Shapiro-Wilk
Statistic df P Statistic Df p
Project Success .135 104 .045 .96 104 .046
Histograms, normal Q-Q plot, normal P-P plot, andboxplotwereperformedtotestthenormalityoftheoutcom evariableof project success. The histograms, normal Q-Q, and P-P plots indicated that the normality assumption of the outcome variable(project success)was not violated. The box plot only suggested two outliers. According to Dawson (2011), sample sizes larger than 100 may have two outliers and be considered normal. As indicated in the previous section, the assumption of normality of the outcome variable (project success) was not violated. Another assumption of regression is independence of observations. The data for this study was collected individually, and suggested that the observations collected for the data were independent with one another.
Table 6
Descriptive Statistics of Project Success, Communication, Motivation, and Conflict Resolution (N=104)
M SD
Project Success 67.06 8.792
Communication 29.55 4.36
Motivation 32.68 4.38
Conflict Resolution
32.19 4.71
For RQ 1 the data was evaluated for normality and equality of variances. The distributions of the residuals of the outcome variable were normal, as shown by P-P plots. The linearity between the variables was confirmed with a scatterplots, indicating not significant outliers. The scatterplots of the scores are roughly a straight line, not a curve. The scatter plot also shows a rectangular shape. Therefore, the assumptions of linearity and homoscedascity were not violated.
The residual statistics for project success in agile teams is presented in Table 9. The Mahalanobis distances
were computed to assess possible multivariate outliers. The critical value for three predictor variables is 11.34 (Pallant,2013). The maximum value of the Mahalanobis distance was 8.21, which is less than the critical value of 11.34, suggesting there were no outliers. Additionally, the Cook’s distance was examined to test the outliers
(Pallant,2013). The maximum Cook’s distance was 0.276,
which is less than 1, indicating there were no major problems with this outlier as presented in Table 6 (Field, 2013).
Table 7
Residual Statistics for Project Success in Agile Teams (N = 53)
Minimum Maximum M SD
Predicted value 64.34 68.19 66.66 .899
Std. predicted value -2.579 1.697 .000 1.000
Standard error of 1.286 3.849 2.412 .721
Predicted Value
Adjusted predicted value 63.13 68.71 66.63 1.254
Residual -26.044 17.514 .000 8.888
Std. residual -2.844 1.913 .000 .971
Deleted residual -29.215 19.875 .035 9.670
Stud. Deleted residual -3.303 2.108 .000 1.037
Mahal. Distance .045 8.209 2.943 2.324
Cook's Distance .000 .276 .022 .045
Collinearity diagnostics were performed to determine the Multicollinearity of the predictor variables with two values, tolerance and Variance Inflation Factor (VIF; Pallant,2013). Multicollinearity is determined to be present if the tolerance is less than 0.10 and the VIF is greater than 10 (Field,2013). For this analysis the tolerance values were greater than 0.10 and the VIF values were less than 10 (see Table 7). For the purpose of
this study, the VIF value of 10 was used as a set value for
magnitude of Multicollinearity (West, Welch, &
Galecki,2015). Furthermore, assumptions were not violated and absent in the analysis.Assumptions were based on no perfect Multicollinearity; predictors were uncorrelated with external variables, and homoscedasticity (Field, 2013).
Table 8
Collinearity Statistics of Independent Variables
Variable Collinearity Statistics
Tolerance VIF
Communication .509 1.964
Motivation
Conflict Resolution
.351
.366
2.853
2.735
Next, a multiple linear regression analysis was performed to determine whether the interpersonal competencies of emotional-social intelligence significantly predicted project success in agile software development teams. The model summary and coefficients output of the multiple linear regression analysis were used to test the null hypothesis (Table 9 and Table 10). The combination of three variables
explained only 1% of the variance of project success, R2=.01, F (3, 49) = .167, p=> .05. The interaction between the three predictor variables was not a statistically significant predictor of project success with agile teams. Specifically, communication was not a statistically
significant predictor of project success in agile teams, β = -.249, p=.650. After accounting for communication in the regression analysis, motivation was not a statistically significant predictor of project success in agile teams, β =.169, p =.792. The third predictor variable, conflict resolution, was not a statistically significant predictor of project success in agile teams, β =.170, p =.800. This suggested that the ESI competencies of communication, motivation, and conflict resolution, as measured by the TESI Survey, were not a statistically significant predictor of project success in agile teams. The null hypothesis (H10) was not rejected.
Table 9
Model Summary of Multiple Regression
Predictors R R2 Adjusted R2 Std. error of the estimate
Table 10
Coefficient Table for Communication, Motivation, and Conflict Resolution in Agile Teams and Project Success (N = 53)
Unstandardized
Coefficients Standardized Coefficients
B Std.error Beta t P
(Constant) 63.09 9.65 6.541 .000
Communication Motivation
Conflict Resolution -.249 .169 .170
.545 .637 .667
-.114 .087 .088
-.456 .265 .255
.650 .792 .800
For RQ 2 the data was evaluated for normality and equality of variances. The distributions of the residuals of the outcome variable were normal, as shown by P-P plots. The linearity between the variables was confirmed with a scatterplots, indicating not significant outliers. The scatterplots of the scores are roughly a straight line, not a curve. The scatter plot also shows a rectangular shape. Therefore, the assumptions of linearity and homoscedascity were not violated.
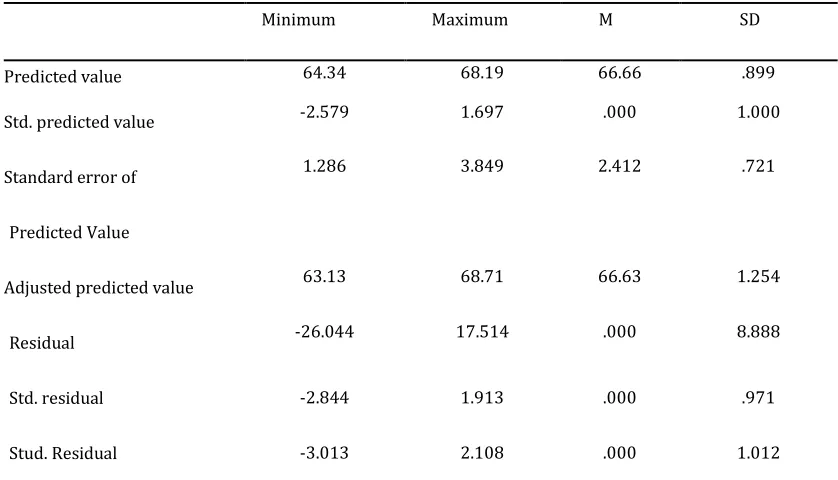
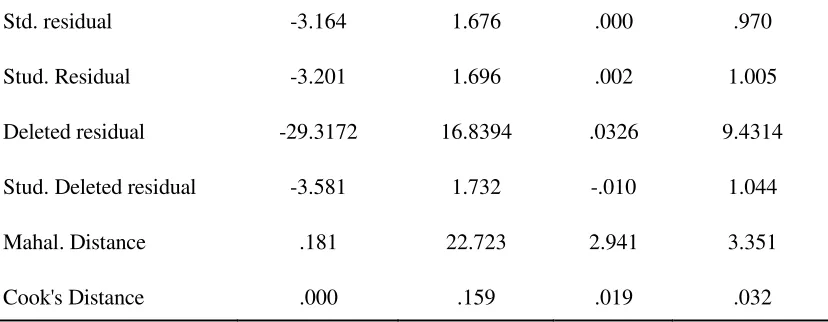
The residual statistics for project success in traditional teams is presented in Table 13. The Mahalanobis
distances were computed to assess multivariate outliers. The critical value for three predictor variables is 11.34 (Pallant,2013). The maximum value of the Mahalanobis distance was 22.72, which is greater than the critical value of 11.34, suggesting there were outliers. Additionally, the Cook’s distance was examined to test
the outliers (Pallant,2013).The maximum Cook’s distance
was 0.159, a value higher than 1 is determined to be outside the normal range. These results indicated there were no major problems with outliers as presented in Table 10 (Field, 2013).
Table 11
Residual Statistics for Project Success in Traditional Teams (N=51)
Minimum Maximum M SD
Predicted value 65.696 71.423 67.373 1.0334
Std. predicted value -1.622 3.919 .000 1.000
Standard error of 1.380 6.232 2.411 .792
Predicted Value
Adjusted predicted value 64.957 71.804 67.340 1.2461
Std. residual -3.164 1.676 .000 .970
Stud. Residual -3.201 1.696 .002 1.005
Deleted residual -29.3172 16.8394 .0326 9.4314
Stud. Deleted residual -3.581 1.732 -.010 1.044
Mahal. Distance .181 22.723 2.941 3.351
Cook's Distance .000 .159 .019 .032
Collinearity diagnostics were performed to determine the Multicollinearity of the predictor variables with two values, tolerance and Variance Inflation Factor (VIF; Pallant, 2013). Multicollinearity is determined if
the tolerance is less than 0.10 and the VIF is greater than 10 (Field, 2013). The tolerance values were greater than 0.10 and the VIF values were less than 10 (see Table 12).
Table 12
Collinearity Statistics of Outcome Variables
Variable Collinearity Statistics Tolerance VIF
Communication .450 2.222
Motivation
Conflict Resolution
.336
.342
2.980
2.927
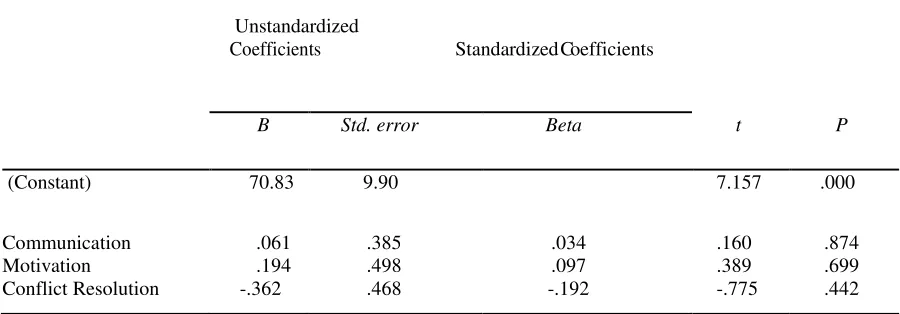
Similarly, a multiple linear regression analysis was performed to determine whether the interpersonal competencies of emotional-social intelligence significantly predicted project success in traditional software development teams.The model summary and coefficients output of the multiple linear regression analysis were used to test the null hypothesis (see Table 12 and Table 13). The combination of three variables only explained
1.4% of the variance of project success, R2=.014, F (3, 47) = .217, p=> .05. The interaction between the three predictor variables was not a statistically significant predictor of project success in traditional teams. Specifically, communication was not a statistically
significant predictor of project success in traditional teams, β = .061, p=.874. After accounting for communication, motivation was not a statistically significant predictor of project success in traditional teams, β =.194, p =.699. Next, the third predictor variable conflict resolution was not a statistically significant predictor of project success in traditional teams, β = -.362, p =.442. This suggested that the ESI competencies of communication, motivation, and conflict resolution, measured by the TESI Survey, were not a statistically significant predictor of project success in traditional teams. The null hypothesis (H20) was not
Table 13
Model Summary of Multiple Regression
Predictors R R2 Adjusted R2 Std. error of the estimate
COM, MOT, CFR
.117 .014 -.049 9.051
Table 14
Coefficient Table for Communication, Motivation, and Conflict Resolution in Traditional Teams and Project Success (N = 51)
Unstandardized
Coefficients Standardized Coefficients
B Std. error Beta t P
(Constant) 70.83 9.90 7.157 .000
Communication Motivation
Conflict Resolution
.061 .194 -.362
.385 .498 .468
.034 .097 -.192
.160 .389 -.775
.874 .699 .442
Evaluation of Findings
The purpose of the study, a quantitative correlational design was used to examine team-based emotional-social intelligence and the relationship to project success in agile and traditional software development teams. The correlational design met the objective by examining the possible existence of a relationship between the predictor and outcome variables. Likewise, the regression analysis methods demonstrated the strength and direction in the relationships between the variables in a clear manner (Lemons, 2009; Vogt, 2005). In previous studies, Examining Perceptions of Agility in Software Development Practice (Cesare et al., 2010), A review of Research on Personality in Teams: Accounting for Pathways Spanning Levels of Theory and Analysis (Methot et al., 2011), and The effects of Team Flexibility and Emotional
Intelligence on Software Development
Performance(Gunsel & Acikgoz, 2013) have found team performance improvements in software development.
In the current study, there was not a statistically significant relationship between three interpersonal competencies of emotional-social intelligence, communication, motivation, and conflict resolution. This result was unexpected based on the current literature and research in the field of team development and dynamics. The effect of emotional-social intelligence is supported as an import role of team success and ultimately organization success (Bakker, 2013; Barczak et al.,2010; May & Carter,2012;Ybarra, Kross, & Sanchez-Burks,2013).
cognitive processes (Kember & Leung,2008). The unexpected finding may also pertain to the teams being geographically separated in some cases, giving unrealistic expectations for team performance.
Researchers have also found that personality types lead to dysfunctional team interactions and negative emotions (Eysenck,1992; Ogbebor,2012).Personality research on the relationship between team member characteristics and team functioning was conducted by clinical psychologists in the 1950s and 1960s (Tang & Wang, 2010). However, it was not until the 1990s that the five factor model (FFM) became the personality taxonomy of choice (Fiske, 1994; Roose et al., 2012). Research results have indicated a significant relationship between FFM and job performance in teams (Chapman et al., 2012; Fiske, 1994). In the first half of the twentieth century, research on personality theories, such as trait theory, dominated formal education subjects such as neurology, social psychology, and economics, and offered relevant theories to explain business problems (Colbert et al., 2012). The application of personality theory goes beyond the claims based on its reliance on statistical and objective data (Eysenck, 1992; Johnson, 2011). Unlike many other theories, the subjectivity or personal experience does not play a role in by theorists in business management. Personality theory has been used to develop emotional intelligence and social intelligence assessments, providing information such as individual personality traits, human interaction skills, and social skill development inputs (Edmondson & Nembhard, 2009).
Summary
The purpose of this quantitative correlational study was to examine team-based emotional-social intelligence and its relationship to project success by
examining three interpersonal competencies: (a)
communication, (b) motivation, and (c) conflict
resolution, and project success in agile and traditional software development teams. The analytical framework used for this study was the multiple linear regressions. A stratified random sample of agile and traditional project team software developers for Hewlett-Packard working in the United States completed surveys involving questions about emotional-social intelligence interpersonal competencies and project success factors. The three ESI competencies were measured with Team Emotional-Social Intelligence Survey, and project success was measured with the Project Implementation Profile (PIP) among agile software development teams. Emotional-social intelligence competencies communication, motivation, and conflict resolution were not correlated with project success in both agile and traditional teams.
The findings from this study found that there was
no statistically significant relationship between
emotional-social intelligence interpersonal competencies and project success in agile and traditions software development teams. Although no prior research has specifically examined the predictor variables presented in this study, emotional intelligence has been linked to improved human performance in teams. The results contradict previous studies on the positive correlations
between communication in successful project
execution(Cesare et al.,2010; Davis, 2011), team motivation facilitation of project success in cost, schedule, and scope (Ghosh et al., 2012; Mayer et al., 2008; Müller & Turner,2010), and the effect of team conflict on team synergy and motivation (DeChurch et al., 2013; Le Corff & Toupin,2010). The stronger correlation agile teams in ESI competencies to project success in the current study lends support to existing research (Davis, 2011; Gunsel & Acikgoz, 2013; Methot et al., 2011), but contradicts other research in this field (Turner & Walker, 2008; Mayer et al., 2008).Further research into emotional-social interpersonal competencies using additional 360 degree assessments could prove to be interesting and significant for team development practices.
References
Adams, S. L., & Anantatmula, V. (2010). Social and behavioral influences on team process. Project Management
Journal, 41(4), 89-98.
Arghode, V. (2013). Emotional and social intelligence competence: Implications for instruction. International Journal
Atta, M., Ather, M., & Bano, M. (2013). Emotional intelligence and personality traits among university teachers:
Relationship and gender differences. International Journal of Business and Social Science, 4(17), 253-259.
Retrieved from http://www.ijbssnet.com
Bakker, A. B. (2013). Toward a more contextual, psychological, and dynamic model of emotional intelligence. Advances in Positive Organizational Psychology, 1(3), 167-187. doi:10.1108/S2046-410X(2013)0000001010
Barczak, G., Lassk, F., & Mulki, J. (2010). Antecedents of team creativity: An examination of team emotional intelligence, team trust and collaborative culture. Creativity and Innovation Management, 19(4), 332-345. doi:10.1111/ j.1467-8691.2010.00574.x
Binder, J., Aillaud, L., & Schilli, L. (2014). The project management cocktail model: An approach for balancing agile
and ISO 21500. Procedia Social and Behavioral Sciences, 119(2), 182-191. doi:10.1016/j.sbspro.2014.03.022
Black, T. R. (2005). Doing quantitative research in the social sciences: An integrated approach to research design
measurement and statistics. Thousand Oaks, CA: Sage.
Blackstone, J., Cox, J. & Schleier, J. (2009). A tutorial on project management from a theory of constraints perspective. International Journal of Production Research, 47(24), 7029-7046. doi:10.1080/00207540802392551
Cabello, R., & Fernandez-Berrocal, P. (2015). Implicit theories and ability emotional intelligence. Frontiers in Psychology, 6, 700. Doi:10.3389/fpsyg.2015.00700
Cerpa, N., & Verner, J. M. (2009). Why Did Your Project Fail? Communications of the ACM, 52(12), 130-134.
Cesare, S. D., Lycett, M., Macredie, R. D., Patel, C., & Paul, R. (2010). Examining perceptions of agility in software
development practice. Communications of the ACM, 53(6), 126-130. doi:10.1145/.1743580
Chapman, K. E., Bowler, M. C., Bowler, J. L., & Cope, J. G. (2012). The impact of cognitive complexity on
frequency-based measurement big five measures. International Journal of Business and Social Science, 3(7), Retrieved
from http://www.ijbssnet.com/update/
Cherniss, C., & Adler, M. (2000). Promoting emotional intelligence in organizations. Alexandria, VA: American Society for Training and Development (ASTD)
Charness, G., Gneezy, U., & Kuhn, M. A. (2011). Experimental methods: Between-subject and within-subject design. Journal of Economic Behavior and Organization, 81, 1-8. doi:10.1016/.jebo.2011.08.009
Christensen, D., & Walker, D. H. T. (2008). Understanding the role of “vision” in project success. Project Management Journal, 35(3), 39. Retrieved from http://www.pmi.org/Knowledge-Center.aspx
Clarke, N. (2010). Developing emotional intelligence abilities through team-based learning. Human Resources
Development Quarterly, 21(2), 119-138. doi:10.1002/hrdq.20036
Cogliser, C. C., Gardner, W. L., Gavin, M. B., & Broberg, C. (2012). Big five personality factors and leader emergence in virtual teams: Relationship with team trustworthiness, member performance contributions, and team
performance. Sage Journal, 37(6), 752-784. doi:10.1177/1059601112464266
Collyer, S., & Warren, C. M. (2009). Project management approaches for dynamic environments. International Journal
of Project Management, 27(4), 355-364. doi:10.1016/j.ijproman.2008.04.004
Cote, S., Lopes, P. N., Salovey, P., & Miners, C. T. (2010). Emotional intelligence and leadership emergence in small groups. The Leadership Quarterly, 21(4), 496-508. doi:10.1016/j.leaqua.2010.03.012
Cozby, P. C. (2009). Methods in behavioral research. (10th ed.). New York, NY: McGraw-Hill.
Crowne, K. A. (2013). An empirical analysis of three intelligences. Canadian Journal of Behavioral Science, 45(2),
105-114. doi:10.1037/a0029110
Cunliffe, A. L. (2008). Organization theory. Thousand Oaks, CA: Sage.
Danner, D., Hagemann, D., Schankin, A., Hager, M., & Funke, J. (2011). Beyond IQ: A latent state-trait analysis of general intelligence, dynamic decision making, and implicit learning. Intelligence Journal, 39(5), 323-334. doi:10.1016/j.intell.2011.06.004
Dawson, R. (2011). How significant is a boxplot outlier? Journal of Statistics Education, 19(2), 1-13. Retrieved from http://www.amstat.org
Davis, S. A. (2011). Investigating the impact of project managers' emotional Intelligence on their interpersonal
competence. Project Management Journal, 42(4), 37-57. doi:10.1002/pmj.20247
Deci, E. (1971). Effects of externally mediated rewards on intrinsic motivation. Journal of Personality and Social Psychology, 18(1), 105-115. doi:10.1037/h0030644.
DeChurch, L. A., Doty, D., & Mesmer-Magnus, J. R. (2013). Moving beyond relationship and task conflict: Toward a
process-state perspective. Journal of Applied Psychology, 98(4), 559-578. doi:10.1037/a0032896
De Clercq, D. d., Bouckenooghe, D. d., Raja, U. u., & Matsyborska, G. h. (2014). Unpacking the Goal
Congruence-Organizational Deviance Relationship: The Roles of Work Engagement and Emotional Intelligence. Journal of
Business Ethics, 124(4), 695-711. Retrieved from http://www. ejbo.jyu.fi/rg/
Edmondson, A. C., & Nembhard, I. M. (2009). Product development and learning in project teams: The challenges are
the benefits. The Journal of Product Innovation Management, 26(2), 123-138.
doi:10.1111/j.1540-5885.2009.00341.x
Ellis, T., & Levy, Y. (2008). Framework of problem-based research: A guide for novice researchers on the
envelopment of a research-worthy problem. Informing Science: The International Journal of an Emerging
ransdiscipline,11(1), 17-33. Retrieved from http://www.informingscience.us/icarus/journals/informingscij/