Design of A Tampering Localization technique in
Image Forensics
S. Priyadarshini Dr. S. Miruna Joe Amali
PG Scholar Associate Professor
Department of Computer Science & Engineering Department of Computer Science & Engineering KLNCE, Sivagangai - 630612, Tamil Nadu, India KLNCE, Sivagangai - 630612, Tamil Nadu, India
Abstract
A Digital image is a two dimensional numeric representation. They are composed of picture elements called pixels, and of it represent the intensity information at a single point in the image. Thus digital images with such a massive data are mostly prone to attacks and forgeries. The term tampering or image forgery relates to the image modification by adding or removing certain regions in the image. This easy-to-tamper target i.e. the digital images are modified for various intentions, mostly for illegal activities. Analysis and investigation of this process is the Digital Image Forensics (DIF). Detecting and localizing such tampering in digital images are posing a great challenge and to face it, an effective method is proposed. With the widespread usage of digital images in storage and transfer of visual information, vulnerabilities against them are also increasing. MERW, Maximal Entropy Random Walk, method is taken for conforming to the aforementioned analysis. The input images are initially over segmented using the SLIC algorithm, Simple Linear Iterative Clustering. Features are extracted from each blocks based on Scale Invariant feature extraction algorithm (SIFT). From the extracted features the forgery is detected based on MERW method, applied in co-alliance with the block matching and labeled feature point matching. The performance of the process is measured with the help of values of Precision, Recall and F-Measure related to the input image.
Keywords: Digital Image Forensics, Precision, Random walk, Tampering
________________________________________________________________________________________________________
I. INTRODUCTION
Digital image processing, indulge manipulations in the digital image using technology to deviate the image from its originality. Mostly involves enhancement process, sharpening i.e. edges are often sharpened for better clarity in printing; Removal of noise, often called de-noising, is also done to eliminate the random errors in the digital image.
Motion blur removal can also be done. Image edges are obtained for object measurement in that image. This edge obtaining process is done from the spread and the contained area within the image can be done easily. Digital Image Processing is done in one of such ways and manipulations are towards unlawful consequences. The trustworthiness of the digital images is assessed by analyzing the susceptibility of manipulations of the digital images. It also projects on to another fluctuation surrounded in the digital imagery paradigm. Digital images are both easily prone to vulnerabilities and also extend the analysis methods to overcome the mankind perceptions. Two principal research areas advance under DIF, and they are: foremost area include approaches for expounding whether the captured image is acquired by the device or to determine which device has acquired it. These methods fall under techniques of source device identification. Other technique aims at revealing the traces of manipulations that are semantically done, by learning the inconsistencies in natural image statistics.
II. APPLICATIONS OF DIF
Digital Image Forensics is the analytic field that analyses the digital images of a particular scenario under a necessary, to establish the authenticity and originality of the test object through a varied means. Its applicability areas are wide like medical imaging, sports, intelligence, reporting news, insurance-claim investigation departments.
Med-Field: X-rays, CAT scans results are in image format and they have to be introspected and interpreted.
Agriculture: Helps to identify various views of land images, like from satellite or any other aerial sources so as to learn the crop suitability of the regions. Also in scrutinizing the agro products to distinguish the aged and fresh products.
Industries and Factories: Programmed assessment of production line items, examination of samples etc.,
Law and legal activities: Analysis of Fingerprints and other biometric features, manipulations with digital images. The main focus in digital image forensics investigations is on recovering objective evidence of a criminal activity [3]. However, the varied series of data acquired using digital devices extends to other areas of inquiry.
III. PROBLEM DESCRIPTION
the tampered regions, yet those methods could not arrive at a satisfied position due to the reasons like, lag in performance in post-processing of the response map, difficulty in localizing the tampered region in an image, inaccuracy and tediousness in detecting the tampered regions in a noisy response map.
Certain existing methods are formulated in such a way that they can be used to detect the tampering only based on certain criteria[7] like the one focusing only on objects under trajectory motion, images of people and images tampered only by rotation, only splicing attacks etc., cannot be used extensively, as they are concerned with only such restricted criteria.
Also, the existing processes are based on block matching process and hence when the image size increases the time complexity and algorithm complexity increased. Also the features extracted based on the block based approaches.
If there are some transformations in the copy move regions, the block based methods cannot exactly identify the copy move areas. The shape regions cannot be exactly identified by approaches based on blocks. Performance of the process measured based on performance metrics indicates that the approaches needs improvement further.
IV. METHODOLOGY
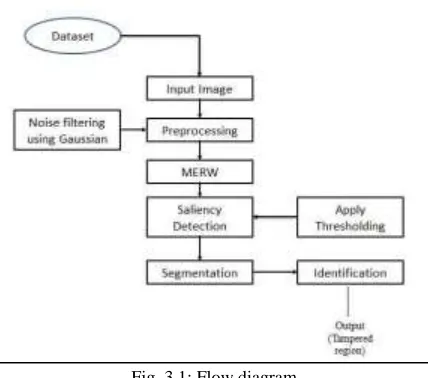
The process of forgery detection in images is employed based on the feature point based and block based matching process. The block size of the images is calculated based on the input image’s DCT transformation. The image is over segmented with the help of SLIC Algorithm. The Simple Linear Iterative Clustering, SLIC, algorithm fragments image based on block size determined using DCT transformation. Figure 3.1 represents the flow of the process.
Fig. 3.1: Flow diagram
SLIC utilizes the similar compactness parameter (selected by the user) for every super-pixel in the image. If a region in an image contains certain smooth regions yet with highly textured regions in the other regions, then the algorithm results in smooth super pixels which are regular sized in smooth areas and intensively irregular super pixels in the textured areas, when the image is smooth in limited regions and with high textures.
The block features (BF) are then extracted based on Scale Invariant Feature Transformation (SIFT) process. The image derivatives are calculated. These values provide the color and gray scale value changes of the image, indicating the image information.
The values are then arranged in order in a matrix format. The values in a particular circle region are first chosen. The values in the chosen region are dilated. In the dilation process the values are compared and the values that have the lowest values are combined.
Then the values that have the minimum values are removed. The resulting points are saved as the HRLpoints. The Obtained HRLpoints are then used along with the image so as to find the central orientation points included in the image. Then optimal values are selected from the given set of values based on the gradient calculation and max value and max intensity value calculation. Finally the calculated values are padded with the image pixels and their corresponding ids were obtained and then the values are saved as the main orientation points.
The saliency points on the image are revealed to describe the features and it is used for identifying the object while tending to detect the test image object along with many related objects. Other promising fact of the feature is that the relative position among the pristine scene should not deviate.
V. MODULES
The work is divided into the following modules,
Preprocessing
SLIC Segmentation
Maximal Entropy Random Walk, MERW
Feature point extraction Label point creation
Saliency Detection and Segmentation
Applying Threshold Merged regions
Segmentation identification by contour and indication
Post Processing
Localization display Performance measures
Preprocessing
The input image to be analyzed is given through the conventional sliding window analysis. The output of this process would be referred as the response map, c. The map consists of the detection scores for individual authentication units, ci ϵ [0, 1], 0 and 1 being the values which represent the presence or absence of the forensic features in the image. The image is then over segmented with the help of SLIC Algorithm, Simple Linear Iterative Clustering. This algorithm is capable of segmenting the images based on the block size determined using Discrete Cosine Transformation, DCT transformation. Also, this algorithm makes use of similar compactness feature as decided by the user, for every super pixel in the image. The algorithm results in smooth super pixels which are regular sized in smooth areas and intensively irregular super pixels in the textured areas, when the image is smooth in limited regions and with high textures. They are dependent upon k-means clustering which is a spatially localized version. Each pixel is related to a vector feature and then k-means clustering is done on them.
SLIC is a gradient ascent method growing superpixels from initial super-pixel centers using color similarity and spatial proximity. In particular, SLIC performs local K-means clustering where the search space for each super-pixel is restricted to a local neighborhood around its center. The approach is easily implemented and adapted to custom needs. In addition, it can naturally be extended to depth or video data and is commonly used for comparison.
The SLIC operation lays the foundation for the Maximal Entropy Random Walk, MERW [1],[12] approach. 1) Initialize centers for the cluster by using Ck = [lk, ak, bk, xk, yk].
2) Agitate centers of cluster in n × n neighborhood fashion, to the least gradient. 3) Repeat
4) loop begins
For each Ck do
Assign best matched pixels of 2S × 2S neighborhood with respect to the measure of distance. End loop
5) Estimate new centers for cluster and residual error denoted by E. 6) Repeat till E ≤ threshold.
7) Impose connections.
Maximal Entropy Random Walk
Block feature extraction process is employed for the estimation of the similarity among the extracted features of the block regions based on SIFT process. This step identifies the key points from the images. The key points extracted from the blocks are matches based on distance calculated. The process of extraction of SIFT features is as follows.
The derivative of the images is calculated. The calculated values give the changes in the color and the gray scale values of the image which indicates the information in the image. The values are then arranged in order in a matrix format. The values in a particular circle region are first chosen. The values in the chosen region are dilated. In the dilation process the values are compared and the values that have the lowest values are combined. The values that have the minimum values are then removed. The resulting points are saved as the HRLpoints. The Obtained HRLpoints are then used along with the image so as to find the central orientation points in image.
Saliency Detection and Segmentation
Saliency is the attractive region that is found relative to the neighborhood pixels at various scales. And this can be detected by estimating the pixel average feature vector distance from the same with respect to the neighborhood pixels. This results in combined feature map generation. Threshold is set for detecting the salient regions.
Regions that are exceeding the set threshold values in the identified salient region are considered to be the tampered regions. This is represented in a grey scale image. This image may contain certain salt – pepper noise in it, which is refined and merged regions are presented. The then presented regions are segmented and represented as merged regions.
The close operation is used here in the merged regions to fill the gaps and as well as to retain the unchanged regions’ shape and it gives out the representation of the segmented tampered regions in binaries; whereas the black representing regions are the pristine part of the image and white designates the tampered regions.
Post Processing
In regions with higher values, there may be scattering of the low noise values due to the reason that it is not necessary for tampered regions to be in high frequency part. The following function Equation 3.1 is used for normalizing the noise with high frequency value t, to P(t) limited within [0,1].
P(t) = 1/(1+e-a(t-b)) --- (3.1)
Where the shape of the function is denoted by ‘a’ and the value of ‘b’ is determined by noise of high frequency. The post processing step includes map normalization, brightness correction, binarization (optional) and morphological cleaning.
The performance measuring is done in terms based on the estimation of F-Measure, Precision and Recall values. Precision can be estimated as the ratio of intensity sum in the captured saliency map inside the user annotated region to the saliency in aggregate estimated for the image. Recall value estimation is done by calculating the ratio of the aggregate saliency that is captured inside the annotated window to the region of the annotated window. And the F-Measure value is calculated as given below, and it is the overall performance measurement.
F-Measureα = (1+α).Precision.Recall/(α.Precision+Recall) --- (3.2)
VI. EXPERIMENTAL SETUP
The experiment is setup on Uncompressed Color Image Dataset, UCID dataset and it testing is done on a dataset of 1000 response maps. The spatial resolution of the images varies between 512 × 512 and 800 × 800. The UCID dataset contains a wide range of tampered image set and which is preprocessed using the conventional window analysis method.
Result Analysis
The method MERW [12] leaves behind the threshold-based decision with ad-hoc post-processing and optimization-based approach with a Markovian prior methods. In certain methods there may be presence of noise in the detected tampered regions which are overcome by applying this method. The average running time is 0.71 seconds.
As in Jin-Gang Yu et al (2014), running time with respect to the models used is compared and tabulated in Table 1. Table – 1
Average Running Time (In Seconds) Comparison Image Size 400 × 300 Models CA FT GBVS RC MERW
Time 18.94 0.016 1.71 0.26 0.71
The Running time of the implemented work, MERW, Maximal Entropy Random Walk is compared against the following models,
CA : Context Aware based Saliency Detection FT : Frequency Tuned saliency Detection GBVS : Graph Based Visual Saliency Detection RC : Region based computation in Saliency detection
MERW : Maximal Entropy Random Walk
VII. CONCLUSION
process of combinations of the block based approaches and the feature point based approach reduces the time consumption and the algorithm complexity of the process.
Performance is high when compared to the Markovian prior method and threshold-based decision method and it is especially beneficial for the noisy response maps. With the implementation of MERW method, it is not feasible for dealing with full-resolution photographs. Use of larger image blocks or segments, adaptation of sparse matrix representation also addresses the limitation of its use.
Future scope may include, reducing the computation time of the process, as working with image may generally require more computation power and time; Image restoration and rectification can be done without any loss of information; Extending this method for various file types like gif, avi and other video files can be done; Tampering detection in full-resolution photographs can be concentrated about; Histogram based and Mean Square Errors may be also considered.
REFERENCES
[1] Pawel Korus and Jiwu Huang , ‘Improved Tampering Localization in Digital Image Forensics Based on Maximal Entropy Random Walk’, IEEE Signal Processing Letters, Vol. 23, No. 1, pp. 169-173, 2016.
[2] Andrea Del Mastio, Irene Amerini, Rudy Becarelli, Roberto Caldelli , ‘Splicing Forgeries Localization Through The Use Of First Digit Features’, IEEE International Workshop on Information Forensics and Security (WIFS), pp. 143-148, 2014.
[3] Bartolini. F., Tefas, A., Barni, M., Pitas. I , ‘Image authentication techniques for surveillance applications’, Proceedings of the IEEE, Vol. 89, No. 10, pp. 1403–1418,2001.
[4] Chang-TsunLi and Yue Li , ‘Color-Decoupled Photo Response Non-Uniformity For Digital Image Forensics’, IEEE Transactions on circuits and systems for video technology, Vol. 22, No. 2, pp. 260-271,2012.
[5] Chen. M, Fridrich, J, Goljan M, Lukas J , ‘Determining image origin and integrity using sensor noise’, IEEE Transactions Information Forensics Security, Vol. 3, No. 1, pp. 74-90, 2008.
[6] Jin-Gang Yu,Ji Zhao, Jinwen Tian, and Yihua Tan , ‘Maximal Entropy Random Walk For Region-Based Visual Saliency’, IEEE Transactions on cybernetics, Vol. 44, No. 9, pp. 1661-1672, 2014.
[7] Ju. W, D. Xiang, B. Zhang, L. Wang, I. Kopriva, and X. Chen, ‘Random walk and graph cut for co-segmentation of lung tumor on pet-ctimages’, IEEE Transactions Image Processing, Vol. 24, No. 12, pp. 5854-5867, 2014.
[8] Liu. T, J. Sun, N. Zheng , ‘Learning to detect a salient object’, in Proceeding IEEE Conference Computer Visual Pattern Recognition, pp.1-8, 2007. [9] Saeed Sarreshtedari and Mohammad Ali Akhaee , ‘A Source Channel Coding Approach To Digital Image Protection And Self-Recovery’, IEEE
Transactions on image processing, Vol. 24, No.7, pp. 2266-2277, 2015.
[10] Sevinç Bayram, Husrev Taha Sencar, and Nasir Memon , ‘Sensor Fingerprint Identification Through Composite Fingerprints and Group Testing’, IEEE Transactions on information forensics and security, Vol. 10, No. 3, pp. 597-612, 2015.
[11] Valentina Conotter, James F. O’Brien, and Hany Farid , ‘Exposing Digital Forgeries In Ballistic Motion’, IEEE Transactions on information forensics and security, Vol. 7, No. 1, pp. 283-296, 2012.
[12] Viswanath Gopalakrishnan, Yiqun Hu, and DeepuRajan , ’Random Walks on Graphs for Salient Object Detection in Images’, IEEE Transactions On Image Processing, Vol. 19, No. 12, pp. 3232 – 3242, 2010.