Vol. 09, Issue 1 (January. 2019), ||V (III) || PP 86-92
Modeling Of Soil Phosphorous Depletion in Crude Oil
Contaminated Soil
N. L Nwakwasi
1, B. C Okoro
1, B. U Dike
1,
A. N Nwachukwu& J. C. Agunwamba
2 1Department of Civil Engineering, Federal University of Technology Owerri, P. M. B 1526, Owerri, Nigeria 2Department of Civil Engineering, University of Nigeria Nsukka
Correspondence: N. L Nwakwasi
Abstract:
Environmental degradation issues are of topical concern to communities in the Niger Delta region of Nigeria. Over the years, there has been strong agitation over polluted farm lands in the Niger Delta region by oil companies operating in the area. This is as a result of oil exploration and exploitation in the region. The people in the region can no longer expect good harvest from their farm lands due to oil pollution. This paper is set to investigate the effect of crude oil pollution on soil phosphorus nutrient with time. The soil sample collected from the university research farm was artificially polluted with 0.05, 0.1, 0.15, 0.2, and 0.25 liters perkg of soil. The polluted soils were tested using standard methods at 14days interval.The panel Data Regression model (PDRM) was used to analyze the data. The result reveal that the phosphorus content of the soil at various level of crude oil pollution varied with time.This can be attributed to mineralization and immobilization processes in the polluted soil environment. Over time, the phosphorus content of the control sample was five (5) times higher than the values of phosphorus content at various level of crude oil pollution (2.59/0.492). The low content of phosphorus at various crude oil pollution level could also be due to reduced microbial activity and depressed phosphorus mineralization occasioned by toxic and deleterious effects of crude oil on soil organism. Amodel which can be used as a predictive tool to determine the level of soil phosphorus depletion in crude oil polluted soil has been developed.Keywords:
Soil nutrient, Pollution, Phosphorus, depletion model.--- Date of Submission: 12-01-2019 Date of acceptance: 29-01-2018 ---
I.
INTRODUCTION
Globally there is a growing concern over environmental pollution and it’s management. The three major areas of environmental pollution include water, air and land. One of the major causes of this environment pollution in Nigeria especially the Niger Delta region is as a result of hydrocarbon exploration and exploitation (Okwuosha, 2000). This has led to the degradation of farm lands, pollution of air, surface and ground waters due to gas flaring. The natural recovery of crude oil polluted land is slow. Communities affected are denied meaningful and economic use of their lands a long time. Hence modeling soil phosphorus nutrient depletion over time as a result of oil pollution has become imperative. The prediction will help to determine the level of degradation and possible bioremediation work to be carried out. A model may help to explain a system and to study the effect of different component and to make predictions about behavior. Modeling is a process of generating abstract, conceptual, graphical and or mathematical model. (Nwaogazie, 2006) defined modeling as the act of constructing or fashioning a model of something or finding a relationship between variables. The trend in modeling is to collect existing records (data), establish relations through mathematical equations,calibrate such equations in the way of assigning values of associated constant and adopting such equations for forecasting or prediction. Prediction takesus into the future for decision making as we examine different responses arising from changes in control variables. The panel data multiple regression analysis was chosen after considering some other engineering tools like finite element method, finite differences, neural network and Matlab due to its capacity to analyze data with several variables.It also gives the researcher a large number of data points by increasing the degree of freedom and reducing the collinearity among explanatory variables hence improving the capacity to produce the expected results in this research work. Analysis of the linear regression can be extended to cover situations in which the dependent variable is affected by several controlled variables (independent variables). In this case, the question is how soil phosphorous is affected by crude oil pollution at various levels in the soil during the duration of pollution.
Given n sets of measurements,
𝑌 = 𝐵0+ 𝐵1𝑋1+ 𝐵2𝑋2+ 𝐵3𝑋3 . . . +𝐵𝑛𝑋𝑛 1.0
The least square estimates for B0, B1 and B3 can be obtained using Panel Data Computer Software.
Phosphorus is one of the major soil nutrient needed in crop production. The depletion of this nutrient over time as a result of oil pollution is now a growing concern in the Niger Delta region of Nigeria. The objective of the study is to carry out a laboratory investigation using crude oil and soil samples collected from the region to determine the effect of crude oil pollution on the soil phosphorus nutrient over a period of time.Other authours whose publications were reviewed in respect to this research work include: Abii, et al., (2009), Akinrede, et al., (2000), Akpan, (2014), Dobermann, et al, (2002), Johnson et al., (2001), Jones, (2001), Krishnakumar, et al.,(2000) and Lewbel, (1979).
1.1 Study Area
The study area is located in Owerri, Imo State and lies between latitude 5022’ 51.5”N and longitude 6059’ 39’3”E, with an elevation of 61m. It is a humid tropical environment with average annual rainfall of 2400mm. The mean daily temperature is about 270C. The geological formation in the area shows that the soils are derived from coastal plain sands called acid sands – Benin formation (Orajaka, 1975).
II.
METHODS
The study was carried out over a period of sixteen (16) weeks using different containers measuring 17cm (height) by 18.5cm (diameter). Samples measuring 10kg polluted soil were placed in each of the containers and exposed to the same atmospheric and environmental conditions.
Table 1: Layout of experimental design
Polluted Soil Sample A B C D E F
Vol. of crude oil in Liters/kg of soil 0 0.05 0.10 0.15 0.2 0.25 Variable monitored for ABCDEF was: Phosphorus (P)
The soil used in the study was collected from the Federal University of Technology Owerri (FUTO) Research Farm from 15cm to 20cm depth with shovel. The soil was measured into containers and taken to the laboratory for treatment (greenhouse treatment).
The soil was air dried for two weeks and sieved through 2.0cm sieve. The soil samples tabled B, C, D, E, F, each weighing 10kg were polluted with 0.5, 1.0, 2.0, 2.5liters of crude oil (Bony light) respectively, and thoroughly mixed on a polythene sheet and put in a labeled container.
Sample A was not polluted and was used as the control. To maintain the moisture content of the soil, 50cl of water was sprinkled on each polluted soil sample at two weeks intervals.
The polluted samples were allowed to stay 14 days before commencement of analysis. The representative samples from (A, B, C, D, E, F) containers were taken at two weeks intervals to the soil science laboratory of Department of Crop, Soil and Pest Management, School of Agriculture and Agricultural Technology, FUTO for analysis to determine the depletion of soil phosphorous nutrient with time at various levels of pollution with crude oil. The concentration remaining after 14, 28, 42, 56, 70, 84, 98 and 112 days intervals were obtained.
For the determination of phosphorus, one (1) gramof air-dried soil sample was put into 15m centrifuge tube and 7ml extracting solution was added. The suspension was allowed to centrifuge for 15minutes at 2000.rpm. 5ml distilled water and 2ml of ammonium molybdate solution were added to 2ml of the clear supernatant in a 20ml test tube. One (1) ml of SnCl2.2H2O dilute solution was added and the content properly
mixed. The percentage (%) transmitted on the electro photometer at 660mm wave length was measured after 20minutes. The standard curve within the range 0-1ppm was prepared and plotted against the optical density (OD) standard solution. The content of extractable phosphorous in soil was determined and recorded. This was repeated for various levels of crude oil pollution of the soil samples.
The Panel Data Computer Software called Stata 13 version was used to obtain the regression coefficients B0, B1, B2, B3 and B4 and the model equation for phosphorous using the data obtained from the
laboratory. The model equation for the soil phosphorous is expressed as:
𝑌𝑖𝑡 = 𝐵0+ 𝐵1𝐶𝑣𝑖𝑡+ 𝐵2𝑇𝑖𝑡 + 𝐵3𝑇𝑖𝑡2+ 𝐵4 𝐶𝑣𝑖𝑡+ 𝑈𝑖𝑡 (2.0)
Where,
Yit = soilphosphorous
B0 B1, B2, B3 and B4 = model coefficients
Tit = Number of days
Cvit = Crude oil volume in litres
i = crude oil pollution levels (0, 0.5, 1.0, 1.5, 2.0) t = contact time for pollution (days)
3.0 Results and Discussions
Table 2: The Variation of phosphorous values (ppm) with time after pollution.
Table 2 shows the phosphorus value in parts per million (ppm) remaining in the soil after any given time (t = 14 to 112 days), for values of soil samples with crude oil pollution volume ranging from 0 to 2.5L per 10Kg of soil.
Table 3: Regression Model Coefficient for the proposed model
The R2 for the determination for the proposed model is 0.9321 with a root mean square error of 0.15309 as shown in table 3. The root mean square error is small, hence the adopted model fits (Chang, 2015). The P value of 0.00 shows that there is a strong relationship between phosphorus and concentration of crude oil spilled at any given time. The equation for prediction of phosphorous depletion in crude oil depleted soil is therefore 𝑝 = 30.1 + 19.71𝐶𝑣𝑖𝑡 + 0.0686𝑇𝑖𝑡– 0.0004𝑇𝑖𝑡2− 48.4 𝐶𝑣𝑖𝑡 + 0.15309
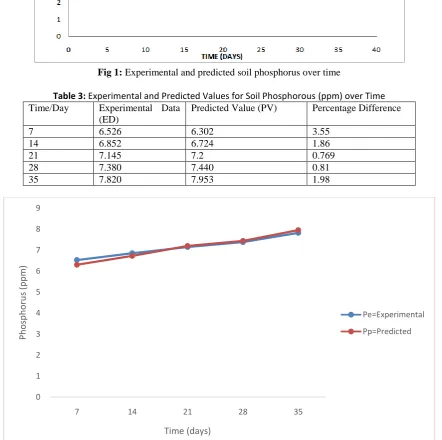
The model was checked and adjusted using another set of experimental data.The model validation is represented in fig 1 and table 3 respectively. The values indicate closeness of the predicted values with the observed values, thus confirming the validity of the model developed (Essington, 2005).
MODEL RESULTS
Time
(days)
0 0.5 1 1.5 2 2.5 source ss df Ms14
35.500 6.7500 5.650 4.570 5.450 7.060 Model 5349.146 4 1337.2828
35.980 7.4552 6.420 5.340 6.200 7.720 Residual 258.1359 43 6.0031642
36.230 8.5142 6.870 6.000 6.550 8.351 Total 5607.272 47 119.30456
37.600 8.4350 7.340 6.300 7.200 8.70270
37.200 8.6524 7.590 6.460 7.220 9.000 P Coef Std Err t P > |t| 95% Conf. Interval84
36.900 8.7871 7.680 6.670 7.251 9.000 Conc 19.71109 1.403061 14.05 0 16.88155 22.5406398
37.260 8.7282 7.540 6.690 7.120 9.100 time 0.068644 0.050821 1.35 0.184 -0.03385 0.1711335112
26.940 8.5124 7.310 6.450 7.121 8.710 time2 -0.000415 0.000394 -1.05 0.299 -0.00121 0.0003801conc1/2 -48.46306 2.288342 -21.18 0 -53.0779 -43.84818
_cons 30.1 1.599236 20.92 0 30.23616 36.68649
NOTE: E -06 Means, X10
-6 WHERE, X IS ORDINARY MULTIPLICATIONF(4, 43) = 147.45
Prob > F = 0.0000
R- Squared = 0.9321
Adj R-Squared = 0.9257
Root MSE = 0.15309
PHOSPHORUS (P) Number of Obs = 48
Table 4.3 : Panel Data Regression model Results for Soil Phosphorus.
Fig 1: Experimental and predicted soil phosphorus over time
Table 3: Experimental and Predicted Values for Soil Phosphorous (ppm) over Time
Time/Day Experimental Data (ED)
Predicted Value (PV) Percentage Difference
7 6.526 6.302 3.55
14 6.852 6.724 1.86
21 7.145 7.2 0.769
28 7.380 7.440 0.81
35 7.820 7.953 1.98
0 1 2 3 4 5 6 7 8 9
7 14 21 28 35
Ph
o
sp
h
o
ru
s
(p
p
m
)
Time (days)
Pe=Experimental
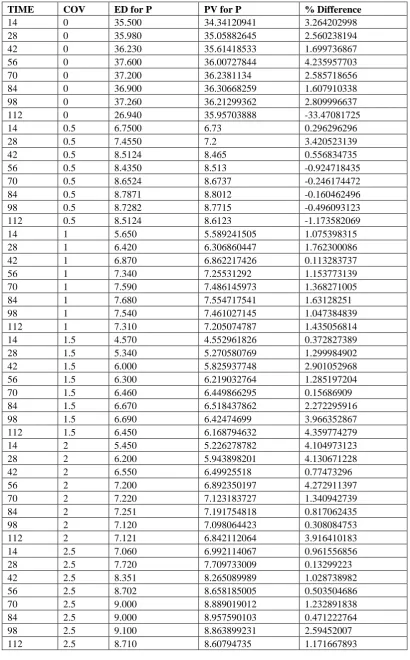
Table 4: Experimental and Predicted Values of Soil Phosphorus at Various Pollution Levels Using Model Equation
TIME COV ED for P PV for P % Difference
14 0 35.500 34.34120941 3.264202998
28 0 35.980 35.05882645 2.560238194
42 0 36.230 35.61418533 1.699736867
56 0 37.600 36.00727844 4.235957703
70 0 37.200 36.2381134 2.585718656
84 0 36.900 36.30668259 1.607910338
98 0 37.260 36.21299362 2.809996637
112 0 26.940 35.95703888 -33.47081725
14 0.5 6.7500 6.73 0.296296296
28 0.5 7.4550 7.2 3.420523139
42 0.5 8.5124 8.465 0.556834735
56 0.5 8.4350 8.513 -0.924718435
70 0.5 8.6524 8.6737 -0.246174472
84 0.5 8.7871 8.8012 -0.160462496
98 0.5 8.7282 8.7715 -0.496093123
112 0.5 8.5124 8.6123 -1.173582069
14 1 5.650 5.589241505 1.075398315
28 1 6.420 6.306860447 1.762300086
42 1 6.870 6.862217426 0.113283737
56 1 7.340 7.25531292 1.153773139
70 1 7.590 7.486145973 1.368271005
84 1 7.680 7.554717541 1.63128251
98 1 7.540 7.461027145 1.047384839
112 1 7.310 7.205074787 1.435056814
14 1.5 4.570 4.552961826 0.372827389
28 1.5 5.340 5.270580769 1.299984902
42 1.5 6.000 5.825937748 2.901052968
56 1.5 6.300 6.219032764 1.285197204
70 1.5 6.460 6.449866295 0.15686909
84 1.5 6.670 6.518437862 2.272295916
98 1.5 6.690 6.42474699 3.966352867
112 1.5 6.450 6.168794632 4.359774279
14 2 5.450 5.226278782 4.104973123
28 2 6.200 5.943898201 4.130671228
42 2 6.550 6.49925518 0.77473296
56 2 7.200 6.892350197 4.272911397
70 2 7.220 7.123183727 1.340942739
84 2 7.251 7.191754818 0.817062435
98 2 7.120 7.098064423 0.308084753
112 2 7.121 6.842112064 3.916410183
14 2.5 7.060 6.992114067 0.961556856
28 2.5 7.720 7.709733009 0.13299223
42 2.5 8.351 8.265089989 1.028738982
56 2.5 8.702 8.658185005 0.503504686
70 2.5 9.000 8.889019012 1.232891838
84 2.5 9.000 8.957590103 0.471222764
98 2.5 9.100 8.863899231 2.59452007
Where
COV = Crude oil Volume
ED for P = Experimental Data for Phosphuros PV for p = Predicted value for Phosphuros
Fig 2: Soil Phosphorus content at various crude oil levels with time
Figure 2 shows the graph of the control sample in comparism with the soil phosphorus content at various levels of crude oil pollution with time
The phosphorous content of the soil at various level of crude oil pollution varied with time of pollution as shown in Fig. 2. For the control (sample), soil phosphorous decreased with time after 28 days the value increased and was best at 96 days (37.5ppm). The fluctuation in values also could be attributed to mineralization and immobilization processes in the soil. For the sample containing 0.5 litres of crude oil level (equivalent to 629 barrels per hectare), the phosphorous content increased gradually and was best at 84 days with a value of 8.787ppm. For the samples with 1.0 and 1.5 litres pollution level respectively, the phosphorous value increased gradually and was best at 112 days (9.990ppm). Similarly, the phosphorous of soil content for samples containing 2.0 and 2.5 litres of crude oil, phosphorus values increased with time and was best at 112 days with a value of 8.400ppm.
Generally, the highest phosphorous content recorded for various crude oil pollution levels was obtained for the control sample (38.90pp) while the lowest values of P was recorded at concentration level of 2.5 litres/10kg of soil at 14 days (4.70ppm). On the average the phosphorous content of the control sample was five (5) times higher than values of phosphorous content at various levels of crude oil pollution (2.59/0.492). The low content of phosphorous at various crude oil pollution levels could be due to reduced microbial activity and depressed phosphorous mineralization, occasioned by toxic and deleterious effects of crude oil on soil organism. The deleterious influence decreased with time, resulting to improved phosphorous concentration with time.
Soil phosphorous content at all levels of crude oil pollution and time were also below the critical limit (8 – 12mg/kg) for tropical soils (Enwezor et. al., 1990). This showed that crude oil pollution at various levels affected the phosphorous content of the soil so badly that P-values obtained can hardly sustain crop Production.
4.0 Conclusion
The impact of crude oil pollution on the physcio-chemical properties of soil in relation to soil fertility in the Niger Delta Region of Nigeria has been reviewed. Modelling of phosphorus nutrient depletion in crude oil contaminated soil over a period of time was carried out. Thesoil phosphorus content for various crude oil levels of pollution increased with time being highest (8.787ppm)at 84days. However over time, the phosphorus content of the control sample was about five (5) times higher than the value of phosphorus content at various levels of crude oil pollution.
0 5 10 15 20 25 30 35 40
1 4 2 8 4 2 5 6 7 0 8 4 9 8 1 1 2
PH
US
PH
O
R
US
(
PP
M)
TIME (DAYS)
C = 0
C= 0.5
C=1.0
c=1.5
c=2
The phosphorus content of soil contaminated with crude oil over time loses its phosphorus content and thereby deficient for crop production in tropical soils.
REFERENCES
[1]. Abii, T.A. &Nwosu, P.C. (2009). The Effect of oil Spillage on the soil of Eleme in Rivers State of the Niger-Delta Area of Nigeria. Research Journal Environmental Science, 3:316 – 320.
[2]. Akinrinde, E.A. &Obigbesan, G.O. (2000). Evaluation of Fertility Status of Selected Soils for Crop Production in five Ecological Areas of Nigeria.Proc. 26th Annual Conf. Soil Sci. Soc. Nig. Ibadan, Oyo State. Pp. 279 – 288.
[3]. Akpan, I.E. (2014). Data requirements for modeling nutrient depletion in crude oil contaminated soil (Final year student project).
[4]. Dobermann, A.; Witt, C. &Dawe, C. (2002). Site-specific Nutrient Management for Intensive Rice Cropping Systems in Asia. Field Crops Research 74(1), 24.
[5]. Enwezor, W.O., Ohiri, A.C., Opowaribo, E.E. & E.J. Udo (1990). A review of soil fertilizer use in crops in Southern zone of Nigeria (in five volumes). Produced by the Fed. Min. of Agric. and National Research, Lagos.
[6]. Johnson, A.E.; Poulton, P.R. &Syers, J.K. (2001). Phosphorus Potassium and Sulphur Cycles in Agricultural Soils. Proceedings No. 465. The International Fertilizer Society, York, UK, pp. 241 – 251. [7]. Jones, B. Jr (2001). Laboratory Guide for Conducting Soil Test and Plant Analysis, Wisconsin U.S.A, pp.
5 – 7.
[8]. Krishnakumar, J. &Ronchetti, E. (2000). Panel Data Econometrics: Future Directions, Papers in Honor of Professor PietroBalestra. Amsterdam: North Holland, pp. 6 – 13.
[9]. Lewbel, A. (1979). “Efficient Estimation of Dynamic Error Components Models with Panel Data,” Discussion Paper No. 79 – 118. Center for Economic Research, University of Minnesota.
[10]. Nwaogazie, L.L. (2006). Probability and Statistics for Science and Engineering Practice. University of Portharcourt press, Portharcourt Nigeria, pp. 1 – 12.
[11]. Okwuosha S. C. (2000) Physico-chemical characterization of soil under the influence of gas flaring. A thesis submitted to the department of Crop and Soil Technology (pp 74 -88). Federal University of technology Owerri Imo State.
[12]. Orajaka, S. O. (1975). Geology in ofomata, GEK (ed), Nigeria in Maps: eastern states, Benin City ethiope publishing house. Pp 5-7