Implementation of Directory based Cache Coherency Model to
Analyze the Network Performance in Distributed Applications
Subrahmanya B
1, Dr. V. Vijayakumar
21(Research Scholar(PPCOMP.SCI 0343), Dept CS, Rayalaseema University, A.P, India) 2(Dean, Dept CSE&IT, Anurag Group of Institutions, Hydrabad, Telangana, India)
Corresponding Author: Subrahmanya B
Abstract: Cache is a smaller static memory, that is used in the systems to store data as well as instructions which are immediately required by the CPU. Keeping the objective of High Performance Computation(HPC), cache modeling has undergone different phases in the field of computation. In case of Multiprocessor Systems, there will be multiple levels of cache memory with in each of the cores of the system. This design approach has lead towards a new problem called Cache Coherency Problem. This problem is basically on maintaining consistency among the cache and memory contents, while several processors are allowed to read and manipulate a given data item. Directory based Cache Coherency Protocol is one of the solution for this problem and has been widely used in case of Distributed Systems.
This work is on design of a Distributed System in hierarchical fashion to implement the Directory Based Cache Coherency Protocol and analyze its performance. Performance analysis has been done by considering different network related metrics like, Dropped Packets, Out Throughput, In Throughput, and In Out Throughput values recorded at an interface of given Home Node. For the simulation a steady network load has been applied by using UDP traffic. Performance analysis has been done for different Bandwidth as well as different Bit Error Rates on the
network links. Network simulator NCTUns 5.0 has been used for the implementation and analyzing its results in terms of identified metrics.
Keywords : Distributed System, High Performance Computation, Coherency Problem, Computational, Multiprocessor Systems, In Throughput, Out Throughput, In Ou, In Out Throughput.
---Date of Submission: 13-09-2018 ---Date of acceptance: 28-09-2018
---I. INTRODUCTION
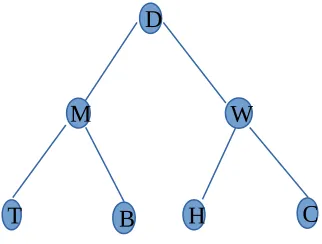
NCTUns 5.0 – a network simulator has been used to design a Distributed Computing System in hierarchical fashion, as depicted in the Figure 1. With this approach, the different fragments of large database can be stored with in the respective nodes of the computing system to improve Locality of Reference. As the applications locality of reference improves, it directly reflects in the systems performance. The different nodes here symbolically represents States/Capitals in India – Delhi(D), Mumbai(M), West Bengal(W), Trivandrum(T), Bangaluru(B), Hydrabad(H) and Chennai(C).
Figure 1. Hierarchical Distributed System
So as to implement cache coherency in the system, the Directory Based Coherency Protocol has been deployed. Hence, every node here going to maintain a directory as a look up table for its data items. A given node, will be identified in any of the following five states as illustrated below.
Read Requesting Node: The node sending a request message to read any given data
Readx Requesting Node: The node sending a Readx request (Exclusive Read) message on any given data
Home Node: The node which happen to store the data being requested.
Owner Node: The node which has copied the data from some Home Node and modified.
Sharing Node: The node which has a copy of the data from some Home Node, for reading it.
The different cases of data requests which could be identified as - Case 1, Case 2, Case 3 and Case 4 as explained below.
Case 1: Read Request to a Clean Block
For the Cache Coherency, following messages are required in Case 1. 1---> {r.DATA} - Read Request from a node to Home Node 2---> {DATA} - Data reply from Home Node
Case 2: Readx Request to a Clean Block
For the Cache Coherency, following messages required in Case 2.
1---> {rx.DATA} - Readx Request from requesting node to Home Node 2---> {DATA} - Data reply from Home Node
Case 3: Read Request to a Dirty Block
For the Cache Coherency, following messages required in Case 3.
1---> {r.DATA} - Read Request from requesting node to Home Node 2---> {r.DATA} - Read Request from Home Node to Owner Node 3---> {DATA} - Data Reply from Owner Node to Home Node 4---> {DATA} - Data Reply from Home Node to the requesting node (Note: Message 3 will be sent after the completion of transaction at the Owner Node)
Case 4: Readx Request to a Sharing Block
For the Cache Coherency, following messages required in Case 4. 1---> {rx.DATA} - Readx Request from a node to Home Node
2---> {i.DATA} - Invalidation Request from Home Node to Sharing Nodes 3---> {ACK} - Invalidation Ack from Sharing Nodes to Home Node 4---> {DATA} - Data from Home Node to requesting node
B
T
H
C
M
D
III. IMPLEMENTATION
Using the network simulator NCTUns 5.0, a Distributed System has been designed as per the Figure 1. Directory based Cache Coherency Protocol has been enforced as per the four cases explained in section II. Performance of the network is measured in terms of Dropped Packets, In Throughput, Out Throughput and In Out Throughput at a interface of given Home Node. Results are analyzed for different Bit Error Rate (BER) values and Bandwidth values. For this implementation, the node C will be Readx/Read Requesting Node, where as node M will be the Home Node in all four cases. In Case 3, node W will be the Owner Node and in Case 4, node B as well as node W will be the Sharer Nodes. A data packet size of 1024 Bytes is assigned for all payload messages like {DATA} and packet size of 128 Bytes for all sync messages like {R.DATA}, {I.DATA} has been considered. Results are got for different Bandwidth values as well as different Bit Error Rates (BER) on the network link. Initially the bandwidth value of 10 Mbps and BER value 0 is kept and performance is analyzed, at the Home Node M. Observations are made by changing the bandwidth value to 5 Mbps and later at 2.5 Mbps. Latter the BER value has been changed to
0.04, and similar performance analysis has been made at all the three bandwidth values. A steady network load has been applied using UDP traffic on both left as well as right sub tree of the Distributed System.
Figure 2. NCTUns 5.0 Simulator
IV. RESULTS
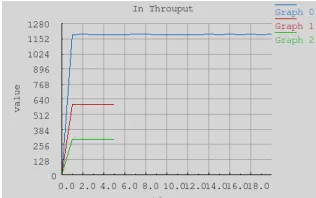
Figure 3 to Figure 9 depicts the analysis of results got with this implementation, as per the simulator out put. In these plots, X axis represents time in seconds and Y axis represents total transfer of data packets in kilo bytes per second (kbps). Here, the plot in blue corresponds to bandwidth vale 10 Mbps where as plot in red corresponds to bandwidth value 5 Mbps and green plot corresponds to bandwidth value 2.5 Mbps.
Figure 3. In Throughput Analysis @ 0 BER.
Figure 4. In Throughput Analysis @ 0.04 BER
Results shows a drop of 50% on In Throughput value for the reduction of bandwidth value by 50%, at 0.04 BER value.
Figure 5. Out Throughput Analysis @ 0 BER
Results shows a drop of 9.1% on Out Throughput value for the reduction of bandwidth value by 50%, at 0 BER value.
Figure 6. Out Throughput Analysis @ 0.04 BER
Results shows a drop of 4.8% on Out Throughput value for the reduction of bandwidth value by 50%, at 0.04 BER value.
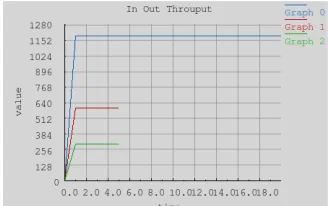
Figure 7. In Out Throughput Analysis @ 0 BER
Figure 8. In Out Throughput Analysis @ 0.04 BER
Results shows a drop of 7.8% on In Out Throughput value for the reduction of bandwidth value by 50%, at 0.04 BER value.
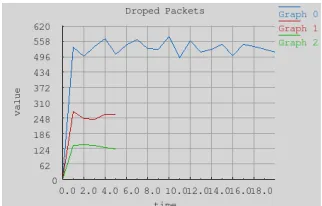
Figure 9. Dropped Packets Analysis @ 0.04 BER
Results shows a drop of 49.5% on Dropped Packets value for the reduction of bandwidth value by 50%, at 0.04 BER value.
V. CONCLUSION
After analyzing the simulation results following conclusions can be made on four identified network metrics. The In Throughput value has been dropped to 50% for the reduction on bandwidth value by same 50% irrespective of the links bit error rate. But on keeping a constant band width vale and changing the links bit error rate value from 0 to 0.04, then In Throughput value has been reduced to 92.9% for 10 Mbps bandwidth value, 91.4% for 5 Mbps bandwidth value and 92.2% for 2.5 Mbps bandwidth value respectively. The Out Throughput value has been dropped to 90.04% for the reduction on bandwidth value from 5 Mbps to 2.5 Mbps. But on keeping a constant band width vale and changing the links bit error rate value from 0 to 0.04, this Out Throughput value has been reduced to 95.4% for 10 Mbps bandwidth value as well as for 5 Mbps bandwidth value and dropped to 95% for 2.5 Mbps bandwidth value. The In Out Throughput value has been dropped to 50% for the reduction on bandwidth value by same 50%, irrespective of the links bit error rate. But on keeping a constant band width vale and changing the links bit error rate value from 0 to 0.04, this In Out Throughput value has been reduced to 92.9% for 10 Mbps bandwidth value, 91.6% for 5 Mbps bandwidth value and 92.2% for 2.5 Mbps bandwidth value respectively. The Dropped Packets value recorded at a given Home Nodes interface is 0 Kilobytes per second(KBS) for all the three bandwidth values when the Bit Error Rate value has been kept at 0 on the links between Home Node and Requesting Node. But when the links Bit Error Rate value kept at 0.04, Dropped Packets value also has been dropped to 49.5% for the reduction on bandwidth value by 50%.
REFERENCES
[1]. Subrahmanya B & Dr. V. Vijayakumar. “Adaptive Directory based Cache Coherency Model to Optimize the Network Bandwidth in Distributed Applications”. IOSR Journal of Engineering (IOSRJEN), September 2018, vol. 08, Issue 9, pp. 41-46, ISSN (e) 2250-3021, ISSN (p): 2278-8719
[2]. Shou-Chih Lo, Jhih-Sian Hu, Varsha A. Kshirsagar. “Neighborhood-Based In-Network Caching for Information-Centric Networks”. Int. J. Communications, Network and System Sciences, 2017, 10, 76-87 [3]. Sarah Tasneem 1 , Reda Ammar 2. “Performance Study of a Distributed Web Server: An Analytical
Approach”. Journal of Software Engineering and Applications, 2012, 5, 855-863
[4]. Rizik M. H. Al-Sayyed, Fawaz A. Al Zaghoul, Dima Suleiman, Mariam Itriq, Ismail Hababeh. “New Approach for Database Fragmentation and Allocation to Improve the Distributed Database Management System Performance”. Journal of Software Engineering and Applications, 2014, 7, 891-905
Network and System Sciences, 2015, 8, 471-482
[7]. Dimitris Tsaliagos. “Design and Implementation of a Directory based Cache Coherence Protocol”. Technical Report FORTH-ICS/TR-418 May 2011
[8]. Michel Dubois, Member- IEEE, and Faye A. Briggs, Member-IEEE. “Effects of cache coherency in Multiprocessors”. Technical Report FORTH-ICS/TR-206 May 2011
[9]. Subrahmanya Bhat & Dr. K. R. Kamath. “Directory Organizations in Cache Coherency Systems for High Performance Computation”. International Journal of Current Research and Modern Education (IJCRME), August 2016, I(I), 868-871, ISSN (Online): 2455 – 5428
[10]. Subrahmanya Bhat & Dr. K. R. Kamath. “Directory Based Cache Coherency Protocol In Multi-Core System For High Performance Computation”. International Journal of Current Research and Modern Education (IJCRME), May 2016, (I/I), 257-261, ISSN : 2455 – 5428
[11]. Subrahmanya Bhat B and Dr. K.R Kamath. “Cache Hierarchy In Modern Processors And Its Impact On
Computing”. International Journal of Management, IT and Engineering (IJMIE), July 2015, 5(7), 248-253,
ISSN: 2249-0558, I.F. 5. 299
[12]. Subrahmanya Bhat B and Dr. K.R Kamath. “Directory Based Cache Coherency, Organization, Operations And Challenges In Implementation –Study”. International Journal of Advanced Trends in Engineering and Technology (IJATET), 2015, ISSN (Online): 2456 - 4664 (www.dvpublication.com), 1(1), 30-33
[13]. Subrahmanya Bhat, & Dr. K. R. Kamath. “Effective Learning With Usage of Simulators – A Case of Nctuns Simulator In Computer Networks”. International journal of Scientific Research and Modern Education, 2016, I (I), 415-420. ISSN-2455 – 5630
[14]. S.Y. Wang and H.T. Kung. “A New Methodology for Easily Constructing Extensible and High-Fidelity TCP/IP Network Simulators,” Computer Networks, October 2002, Vol. 40, Issue 2, pp. 257-278.
[15]. S.Y. Wang. (July 2003). “NCTUns 1.0,” in the column “Software Tools for Networking,” IEEE Networks, Vol. 17, No. 4
[16]. S.Y. Wang, C.L. Chou, C.H. Huang, C.C. Hwang, Z.M. Yang, C.C. Chiou, and C.C. Lin. “The Design and Implementation of NCTUns 1.0 Network Simulator,” Computer Networks, June 2003, Vol. 42, Issue 2, pp.175-197
[17]. S.Y. Wang, C.L. Chou, C.C. Lin. “The Design and Implementation of the NCTUns Network Simulation Engine,” Elsevier Simulation Modelling Practice and Theory, 2007, 57 -81
International organization of Scientific Research 67 | P a g e
Subrahmanya B. " Implementation of Directory based Cache Coherency Model to Analyze the Network Performance in Distributed Applications” IOSR Journal of Engineering (IOSRJEN), vol. 08, no. 10, 2018, pp. 62-68.