Review Article
EFFICIENT ANALYSIS OF METEOROLOGICAL DATA BASED ON HUMIDITY LEVEL AND CYCLONE
LEVEL USING NAÏVE BAYES CLASSIFICATION ALGORITHM
1,*
Mayilvaganan, M. and
2Vanitha, P.
1
Department of Computer Science, PSG College of Arts and Science, Coimbatore, Tamil Nadu, India
2Department of Computer Science Karpagam University, Coimbatore, India
ARTICLE INFO ABSTRACT
The aim of this research work, focus meteorological data to analyses the monsoon seasons between twelve months to cluster the weather data based on Longitudinal and Latitudinal which can be used to analyze by the collection of Temperature, Humidity, Rainfall and Cyclone. In this research, Naïve Bayes Classification can be predicted the Meteorological condition of the region based on the cyclone and the humidity level in seasonally. It provides specific services for assessment of pollution impacts from various industries and thermal power plants. The atmospheric correlations play a significant role in determining the climate trends which are crucial in understanding the short and long-term trends in climate.
INTRODUCTION
Meteorological data analysis in the form of data mining is concerned to predict the knowledge of weather condition. To make an accurate prediction is one of the challenging of meteorologist to survey the weather condition efficiently. The atmospheric correlations play a significant role in determining the climate trends which are crucial in understanding the short and long-term trends in climate. The climate changes, so experienced today are mainly due to over ambitious strategies and actions of human beings on the eco-system. In this paper, the Naïve Bayes classification technique analyzes the meteorological data of five regions in various directions of Tamil Nadu.
Literature Survey
Folorunsho Olaiya and Adesesan Barnabas Adeyemo, reported
theforecasting of maximum temperature, rainfall, evaporation
and wind speed. This was carried out using Artificial Neural
*Corresponding author: Mayilvaganan, M.,
Department of Computer Science, PSG College of Arts and Science, Coimbatore, Tamil Nadu, India.
Network and Decision Tree algorithms and meteorological data collected between 2000 and 2009 from the city of Ibadan, Nigeria. A predictive Neural Network model was also discussed in the weather prediction program and the results compared with actual weather data for the predicted periods.
DATA ANALYSIS
In this research work, the datasets are taken in the real time weather and rainfall dataset under five regions such as Chennai, Coimbatore, Cuddalore, Trichy and Nilgiri during the period of 2000-2014 in Tamilnadu district. The present work analyses the rainfall information, temperature and humidity data during summer, and winter, northeast, southwest periods. Rainfall is measured by millimeter (mm), temperature is measured by Celsius and humidity is measured by percentage. The data sets are collected from the India Meteorological Department section websites, the domain structure of Seasonal Temperature, Humidity, Rainfall, cyclone occurring as shown in table II and Latitudinal and Longitudinal of several regions are taken as shown in Table 1.
Article History:
Received 21st May 2015
Received in revised form
28th June, 2015
Accepted 13th July, 2015
Published online 31st August, 2015
International Journal of Recent Advances in Multidisciplinary Research
Vol. 02, Issue 08, pp.0637-0642, August, 2015
Keywords:
Predict Meteorological Data, Humidity,
PROPOSED RESEARCH METHODOLOGY – To Cluster the seasonal Monsoon Data Using K- Means Algorithm
In the proposed methodology, from Fig 1, represents to collecting the meteorological weather analysis of temperature, humidity, rainfall and cyclone movements of the different region in Monsoon wise. The four divisions of monsoon seasonal data from the given dataset as Winter seasons in the month of January and February, Hot Summer Season in the
month of March, April and May, South West Monsoon in the
month of June, July, August and September and North East Monsoon of October, November and December month.
In this research, to Cluster the meteorological data based on the location of latitudinal and longitudinal, then to predict the rainfall level based on the level of changes in humidity and cyclone formation. The parameters along with Centroid Euclidean inter-cluster distance measure for the five clusters C0,C1,C2,C3 and C4 for grouping based on location using latitudinal and longitudinal to Cluster Centroid as given equation (2),
(2) Here Centroid based partition techniques are used the centroid of the cluster, Ci to represent that cluster distance measure based on longitudinal and latitudinal location Measured by dist (Ci, Cj) is Euclidean distance between two points. It can be clustered to different locations for analyzing temperature, humidity and rainfall level. From Fig2 represents, a longitudinal and Latitudinal data can be clustered into 5 clusters, which shows the distance to mean of inter cluster formation.
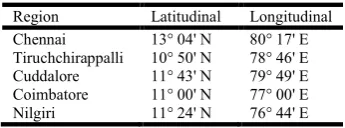
Table 1. Latitudinal And Longitudinal of Region
Region Latitudinal Longitudinal
Chennai 13° 04' N 80° 17' E
Tiruchchirappalli 10° 50' N 78° 46' E
Cuddalore 11° 43' N 79° 49' E
Coimbatore 11° 00' N 77° 00' E
Nilgiri 11° 24' N 76° 44' E
Table 2. Cyclone occurs in Monsoon
Year W Cyclone (Jan- Feb) Hot Sum Cyclone (Mar-May) SW Cyclone (June-Sep) NW Cyclone (Oct-Dec)
2000 0 1 1 0
2001 0 0 0 0
2002 0 0 0 3
2003 0 0 0 0
2004 0 0 0 0
2005 0 0 0 4
2006 0 0 0 0
2007 0 0 0 0
2008 0 1 4 5
2009 0 0 0 1
2010 0 0 0 1
2011 0 0 0 1
2012 0 0 0 1
2013 0 0 0 1
2014 0 0 0 0
PREDICTING THE MONSOON RAINFALL USING NAÏVE BAYES CLASSIFICATION
Given random variables X, Y and Z, where X is
conditionally independent of Y given Z, if and only if the
probability di stribution
governing X is independent of the value of Y given Z; that
is (∀i, j, k) P(X = xi |Y = yj ,Z = zk) = P(X = xi |Z = zk
Consider three Boolean random variables to describe the
current weather: Rain, Cyclone and Humidity. It might reasonably assert that cyclone is independent of Rain given Humidity. Because Cyclone causes Rainfall, once it know whether or not there is humidity, no additional information about cyclone is provided by the value of Rain.
Let us now derive the Naive Bayes algorithm, assuming in
general that Y is any discrete-valued variable, and the
attributes X1...Xn are any discrete or real valued attributes.
Our goal is to train a classifier that will output the probability distribution over the possible values of Y, for each new instance (class label) X that it to classify. The
expression for the probability that Y will take on its kth
possible value, according to Bayes rule (3), is
(3)
Computational Based on Training tuples such as P(Wintemp=High| Winhumidity=high|Cyclone=yes) P(WiPntemp=low| Winhumidity=high|Cyclone=no) P(Wintemp=High| Winhumidity=medium|Cyclone=no) P(Stemp=low|winhumdity=normal|cyclone=no) P(Stemp=high|winhumdity=normal|cyclone=no) P(Stemp=low|winhumdity=high|cyclone=no) P(SWTemp=High|SWHumidity=high|Cyclone=Yes) P(SWTemp=Low|SWHumidity=high|Cyclone=Yes) P(SWTemp=High|SWHumidity=Medium|Cyclone=no) P(NETemp=High|NEHumidity=high|Cyclone=Yes) P(NETemp=Low|NEHumidity=high|Cyclone=Yes) P(NETemp=High|NEHumidity=Medium|Cyclone=no)
RESULTS AND DISCUSSION
From the research, discussion can be analyzed the meteorological information can be experimented with classification techniques for predicting the level of rainfall based on the humidity level and cyclone levels from different
regions in seasonally. From Fig. 3 represents the humidity level can increase in North East Monsoon based on cyclone occurrence in Chennai region. From Fig. 4 shows, when cyclone occurs in the density of 0.4 the humidity level of was increased in 1.4 of South West Monsoon in a region of Chennai. From Fig.5 shows the cuddalore region, when cyclone occurs in the density of 0.35 the humidity level of was increased in 0.65 in North East Monsoon rainfall range can be shown in the normal level during the cyclone forms in the year of 2000.
Conclusion
In this research, it can be concluded that based on a Naïve Bayes Classification algorithm to identify the level of meteorological data of rainfall with respect to Cyclone and Humidity in seasonally to various region. From this analysis, the rainfall occurs in mostly Southwest and North East Monsoon in Coimbatore, Chennai, Trichy and Cuddalore. In Nilgiri, the most rainfall occurs in South West Monsoon. Thus the data mining provided a very accurate knowledge in a form of rules in classification techniques. This knowledge can be used to obtain useful prediction and support the decision making for support to the climatic environment in the ecosystem.
REFERENCES
Berkhin, Pavel. 2006. "A survey of clustering data mining
techniques."Grouping multidimensional data. Springer
Berlin Heidelberg, 25-71.
Gonzales. T.F. 1985. Clustering to minimize the maximum
inter cluster distance. Theoretical Computer Science,
38(2-3):293-306.
Kantardzic, 2011. Mehmed. Data mining: concepts, models, methods, and algorithms. John Wiley and Sons.
Kotsiantis, S. et al., 2007. “Using Data Mining Techniques for Estimating Minimum, Maximum and Average Daily
Temperature Values”, World Academy of Science,
Engineering and Technology, pp. 450-454
Lawrence and Mark G. 2005. "The relationship between relative humidity and the dew point temperature in moist air: A simple conversion and applications." Bulletin of the
American Meteorological Society, 86.2 225-233.
Manish Verma, MaulySrivastava, NehaChack, Atul Kumar Diswar and Nidhi Gupta, May-Jun 2012. “A Comparative Study of Various Clustering Algorithms in Data Mining”, International Journal of Engineering Research and Applications (IJERA) Vol. 2, Issue 3, pp.1379-
Nikhil Sethi, Dr.Kanwal Garg 2014. “Exploiting Data Mining
Technique for Rainfall prediction”, International Journal
of Computer Science and Information Technologies, Vol. 5
(3), 3982-3984.
Nkrintra, S. et al., 2005. “Seasonal Forecasting of Thailand
Summer Monsoon Rainfall”, in International Journal of
Climatology, Vol. 25, Issue 5, American Meteorological
Society, pp. 649-664.
Olaiya, Folorunsho, and Adesesan Barnabas Adeyemo. 2012. "Application of data mining techniques in weather prediction and climate change studies."International Journal of Information Engineering and Electronic Business (IJIEEB) 4.151.
Pasanen, A.L. et al. 1991. "Laboratory studies on the relationship between fungal growth and atmospheric temperature and humidity." Environment International17.4 225-228. Swinbank, W. CQJR. "Long wave radiation from clear skies." Quarterly Journal of the Royal Meteorological Society 89.381 (1963): 339-348.
Solomon, M. E. 1951. "Control of humidity with potassium hydroxide, sulphuric acid, or other solutions." Bulletin of Entomological Research 42.03 543-554
Thornton, Peter E., Steven W. Running, and Michael A. White. 1997. "Generating surfaces of daily meteorological variables over large regions of complex terrain."Journal of Hydrology 190.3 214-251.
Zhu, Xingquan, and Ian Davidson, eds. 2007. Knowledge Discovery and Data Mining: Challenges and Realities. Igi Global.