DUAL CHANNEL SPEECH
ENHANCEMENT USING
HADAMARD-LMS ALGORITHM WITH DCT
PREPROCESSING TECHNIQUE
D.DEEPA
Bannari Amman Institute of Technology, Sathyamangalam, Erode (Dt), Tamilnadu, 638401, India.
Dr. A. SHANMUGAM
Bannari Amman Institute of Technology, Sathyamangalam, Erode (Dt), Tamilnadu, 638401, India.
Abstract:
Speech enhancement and noise reduction have wide applications in speech processing. They are often employed as a pre-processing stage in various applications. Two points are often required to be considered in signal de-noising applications: eliminating the undesired noise from signal to improve the Signal to noise Ratio (SNR) and preserving the shape and characteristics of the original signal. Background noise in speech signal will reduce the speech intelligibility for people with hearing loss especially for sensorineural loss patients. The proposed algorithm describes Hadamard - Least Mean Square algorithm with DCT pre processing technique to improve the SNR and to reduce the mean square error (MSE). The DCT has separable, and energy compaction property. Although the DCT does not separate frequencies, it is a powerful signal decorrelator. It is a real valued function and thus can be effectively used in real-time operation.
Keywords: Sensorineural loss, SNR, MSE, Hadamard transform, DCT, LMS.
I. INTRODUCTION
Hearing impairment is the major chronic disability, affecting people in the world. Many people have great difficulty in understanding speech with background noise [5]. This especially true for a large number of elderly peoples and sensorineural impaired persons. This is a broad class of hearing impairments its origin is in the cochlea or auditory nervous system. Sensorineural loss disorders are difficulty to remedy. This type of defects may be due to congenital or hereditary factors, disease, tumors, old age, long-term exposure to industrial noise, acoustic trauma or the action of toxic agents etc. The hearing loss patient’s experiences difficulty in making fine distinction between speech sounds, particularly those having a predominance of high frequency Energy [5]. They may hear the speaker’s voice easily, but be unable to distinguish, for example, between the words ‘fat’ and ‘sat’ [6]. Two features of impairment particularly detrimental to the perception of speech are high tone loss and compression of the dynamic range of the ear.
II. PROPOSED ALGORITHM
The proposed method is composed of four stages, they are as follows Stage 1: Transformation
The input to the adaptive filter is
xk = [xk, xk-1,…….., xk-n+1] T (1)
The transformation operation is done with the help of Fast factored DCT uk(n) = Tn[ xk ] (2)
The transform outputs then form a vector
uk(n) = [uk(0), uk(1),……., uk(n-1)]T (3)
Stage 2: Hadamard transform:
In the second stage, the Hadamard transformation is applied,
1
0
) ( ) ( 2
/
1 0
) 1 )( ( )
2 / 1 ( )
( N
a
k b k a n
n
k
a x b
X (4)
With a ↔ a(n-1)…a(1)(a0), b ↔ b(n-1)…b(1)(b0), a(k), b(k) = 0,1
The speech signal is applied to the above equation, were the samples from the signal is arranged in a bit reversed order and the values of each sample is stored in hadamard matrix where the sign is altered. Here the variables ‘a’ and ‘b’ are the clean and noisy signal sample values.
Stage 3: Power Normalization
Transformation followed by a power normalization stage, causes the eigenvalues of the LMS filter inputs to cluster around one and speeds up the convergence of the adaptive weights. The output vector after power normalization is
T k
k k
k
n
v
v
v
n
v
(
)
[
(
0
),
(
1
),...
(
1
)]
(5) Stage 4: LMS filtering
The least mean square (LMS) algorithm is very popular because of its simplicity and easy of computations. LMS algorithm is generally the best choice for many different applications. This method can be effectively applied to reduce the noise i.e. to improve the SNR. Unfortunately, its convergence rate is highly dependent on the feedback coefficient μ and the input power to the adaptive filter. The resulting equal power signals vk(i) are applied as an input to an adaptive linear combiner whose weights wk(i) are adjusted using LMS
algorithm described below. The weight vector is defined as
wk(n) = [wk(0), wk(1),……., wk(n-1)]T (6)
Then the filter output is given by
yk(n) = wTn(n) vk(n) (7)
(8)
Where dk is the desired signal. This error ek is used to update the adaptive filter taps using a modified for of the
LMS algorithm
wk+1(i) = wk(i) + µ ek vk(i) (9)
for i = 0, 1… n-1.
Finally the same steps are reversed for original speech by calculating Inverse Transforms. The step size used in LMS is (µ) 0.25.
III. Objective measures for performance evaluation
Objective measures are based on a mathematical comparison of the original and processed speech signals. A). Signal-to-noise ratio (SNR)
The SNR is a popular method to measure speech quality.
n 2 (n) Sˆ S(n) n (n) 2 S 10 10log dBSNR
(10)
B). Itakura - Saito Distance
Itakura - Saito measure is one of the distance measures. It is based on the dissimilarity between the original and the enhanced
Ra a b a R b a b a d r
r ( )
) ( ) ,
( (11)
where a is the vector for the prediction coefficients of the clean speech signal, vector R is the autocorrelation matrix of the clean speech signal and vector b is the prediction coefficients of the enhanced signal. A typical range of results for the IS measure is 1 to 10, with lower values indicating lesser distance and better speech quality
C). Mean Square Error (MSE)
The Mean Square error (MSE) metric is frequently used in signal processing and is defined as:
2 1
))
(
)
(
(
1
S
i
S
i
L
MSE
L Enhancedi
original
(12)
Here SOriginal is the clean signal and SEnhanced is the noise removed signal. The smaller the MSE value,
the better the performance of the algorithm D). Mean Opinion Score measure (MOS)
The mean opinion score (MOS) provides a numerical measure of the quality of human speech. The scheme uses subjective tests (opinionated scores) that are mathematically averaged to obtain a quantitative indicator of the system performance. To determine MOS, a number of listeners rate the quality of test sentences read aloud over the communications circuit by male and female speakers. A listener gives each sentence a rating as follows:
(1) Bad (2) Poor (3) Fair (4) Good (5) Excellent.
Time domain results
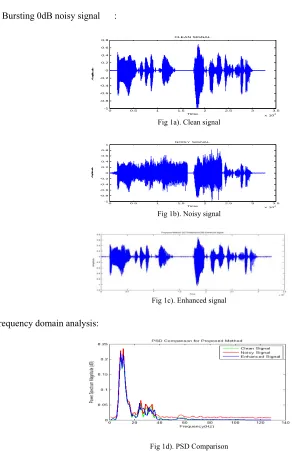
White Bursting 0dB noisy signal :
0 0.5 1 1.5 2 2.5 3 3.5
x 104 -1
-0.8 -0.6 -0.4 -0.2 0 0.2 0.4 0.6 0.8
Time
A
m
p
lit
u
d
e
CLEAN SIGNAL
Fig 1a). Clean signal
0 0.5 1 1.5 2 2.5 3 3.5
x 104 -1
-0.8 -0.6 -0.4 -0.2 0 0.2 0.4 0.6 0.8 1
Time
A
m
p
lit
u
d
e
NOISY SIGNAL
Fig 1b). Noisy signal
Fig 1c). Enhanced signal
Frequency domain analysis:
Fig 1d). PSD Comparison
Fig 2a: Spectrogram for Clean Signal
Fig 2b: Spectrogram for Noisy Signal
Fig 2c: Spectrogram for Enhanced Signal
TABLE I: Comparison between DCT-LMS and Hadamard LMS algorithm for SNR
S. No Type of Noisy Signal ALGORITHM DCT-LMS Proposed method
1 White Bursting 3 dB 16.9503 17.8620
2 White Bursting 0 dB 16.4431 15.2005
3 Cellular 16.6608 14.9018
4 White Stationary 0dB 15.7663 15.5764
5 Butter clean 14.4326 17.8370
6 Bigtips 14.3760 14.9210
7 Colored cockpit 4 dB 16.8327 19.3050
TABLE II: Comparison between DCT-LMS and Hadamard LMS algorithm for MSE
S. No
Type of Noisy Signal DCT-LMS
ALGORITHM PROPOSED METHOD
1 White Bursting 3 dB 0.0084 3.22E-07
2 White Bursting 0 dB 0.0096 2.70E-07
3 Cellular 0.0239 6.44E-07
4 White Stationary 0dB 0.0096 1.11E-07
5 Butter clean 0.0017 6.76E-07
6 Bigtips 0.0017 2.32E-07
Fig3. SNR Comparison between Spectral Subtraction method and Hadamard LMS algorithm
IV.Conclusion
Thus the above results shows different noise samples and their enhanced values. By introducing few more different values of μ, it may be possible to get further improvements. The added computational complexity of the algorithm is minimal and it adapts with non stationary noise environments. This algorithm can be implemented in real-time on a fixed point Digital Signal Processor (DSP) platform for evaluation in real-world conditions. This method can be used as a speech enhancement algorithm in digital hearing aids because of its definite improvement in SNR.
V. Reference
[1] Sunitha. S.L., and V. Udayashankara. “Fast Factored DCT-LMS Speech Enhancement for Performance Enhancement of Digital Hearing Aid”. World Academy of Science, Engineering and Technology 10 2005.
[2] Shaul Florian and Neil J Bershad. “A Weighted Normalized Frequency Domain LMS Adaptive Algorithm”. IEEE Transactions on Acoustics speech and signal processing. Vol. 36, no. 7, July 1998.
[3] Francosie Beaufays. “Transform domain adaptive filters: An analytical approach”. IEEE Transactions on Signal processing, vol. 43, no. 2, Feb 1995.
[4] Simon Haykin, Adaptive Filter Theory”, Pearson Education Asia, 4th Edition, 2002.
[5] V.Udayashankara, A.P.Shivaprasad., “Digital Hearing Aid a Review”, World congress on Medical physics & Biomedical Engineering. Brejil, Aug. 1994. pp. 21-26.
[6] Moore. B.C., Stainsby. T.H., Alcantara. J.I., Kuhnel. V., “The effect of speech intelligibility of varying compression time constants in a digital hearing aid”. International Journal on Audio logy. 2004 Jul-Aug: 43(7), pp. 399-409.
[7] Chug. “Challenges and recent developments in Hearing Aids”, Trends Amplif.2004:8(3). Pp. 83-124.
[8] Shanks. J.E., Wilson. R.H.Larson, Williams. D., “Speech recognition performance of patients with sensorineural hearing loss under unaided and aided conditions using linear and compression hearing aids”. Ear hear. 2002 Aug: 23(4), pp. 280-90.
[9] Shields.P.W., Campbell.B.R., “ Improvements in intelligibility of noisy reverberant speech using a binaural sub band adaptive noise-cancellation processing scheme”. Journal on Acoustics Soc Am. 2001Dec: 110(6). pp. 3232-42.
[10] Rankovic.C.M., “Factors governing speech reception benefits of adaptive linear filtering for listeners with sensorineural loss”. Journal on Acoustics Soc Am. 1998 Feb: 103(2). Pp. 1043-57.
[11] Baer. T., Moore.B.C., Gatechouse. S., “Spectral contrast enhancement of speech in noise for listeners with sensorineural hearing impairment: effects on intelligibility, quality, and response times”. Journal on Rehabilitation Res Dev. 1993:30(1). Pp... 49-72. [12] Sunitha S L and Dr.V Udayashankara, “DFT-LMS Speech Enhancement Technique for Sensorinueural loss Patients”. Journal of