Growth and Biochemical Markers of Growth in Children With Snoring
and Obstructive Sleep Apnea
Peter Nieminen, MD*; Tuija Lo¨ppo¨nen, MD, PhD‡§; Uolevi Tolonen, MD, PhD
储
; Peter Lanning, MD, PhD¶;
Mikael Knip, MD, PhD#; Heikki Lo¨ppo¨nen, MD, PhD*
ABSTRACT. Objective. The pathophysiological mecha-nisms of growth impairment frequently associated with the obstructive sleep apnea syndrome (OSAS) in chil-dren are poorly defined. The main objective of this study was to evaluate whether nighttime upper airway obstruc-tion attributable to adenotonsillar hypertrophy and sub-sequent surgical treatment affect the circulating concen-trations of insulin-like growth factor-I (I) and IGF-binding protein 3 (IGFBP-3) along with other growth parameters in children.
Patients and Methods. We initially studied 70 chil-dren (mean age: 5.8 years; range: 2.4 –10.5 years) admitted to a university hospital because of clinical symptoms of OSAS. Their sleep was monitored with a 6-channel com-puterized polygraph. Data on anthropometry and circu-lating concentrations of IGF-I and IGFBP-3 were gener-ated and compared with corresponding characteristics in control children (Nⴝ 35). Thirty children with an ob-structive apnea-hypopnea index (OAHI) of 1 or more were categorized as children with OSAS (mean OAHI: 5.4 [95% confidence interval for mean (CI): 3.8 – 6.9]), whereas 40 children with an OAHI of <1 were consid-ered as primary snorers (PS) (mean OAHI 0.13 [95% CI: 0.05– 0.21]). Nineteen children with OAHI>2 underwent adenotonsillectomy attributable to OSAS and were reas-sessed 6 months later together with 34 nonoperated chil-dren with OAHI<2.
Results. There were no initial differences in relative height and weight for height between the 3 groups of children. No differences were observed in peripheral IGF-I concentrations, but both OSAS and PS children had reduced peripheral IGFBP-3 levels. The operated children with initial OSAS experienced a highly signif-icant reduction in their OAHI from 7.1 (95% CI: 5.1–9.1) to 0.37 (95% CI: 0.2– 0.95). Weight-for-height, body mass index, body fat mass, and fat-free mass increased during the follow-up in the operated children with OSAS, whereas only fat-free mass and relative height increased in the PS children. Both the IGF-I and the IGFBP-3 con-centrations increased significantly in the operated chil-dren, whereas no significant changes were seen in the PS children.
Conclusions. These observations indicate that growth hormone secretion is impaired in children with OSAS and PS. Respiratory improvement after
adenotonsillec-tomy in children with OSAS results in weight gain and restored growth hormone secretion.Pediatrics2002;109(4). URL: http://www.pediatrics.org/cgi/content/full/109/4/e55; snoring, obstructive sleep apnea, growth hormone, insulin-like growth factor-I, insulin-insulin-like growth factor-binding pro-tein 3.
ABBREVIATIONS. OSAS, obstructive sleep apnea syndrome; GH, growth hormone; IGF-I, insullike growth factor-I; IGFBP-3, in-sulin-like growth factor-binding protein 3; PS, primary snorer; EMG, electromyogram; OAHI, obstructive sleep apnea-hypopnea index; SDS, standard deviation score; BMI, body mass index; SWS, slow-wave sleep.
S
noring is relatively common in children, with
the prevalence of regular snoring about 10% in
preschool-aged subjects.
1–3Obstructive sleep
apnea syndrome (OSAS), a condition related to
snor-ing, is estimated to affect 0.7% to 3.4% of all children
according to epidemiologic surveys.
1,2,4Pediatric
OSAS may occasionally lead to even life-threatening
complications,
5but less serious complications, such
as failure to thrive, are more commonly recognized.
Retarded weight and height gain as complications of
pediatric OSAS and “catch-up” growth after
treat-ment have been well-docutreat-mented.
6 –11The
preva-lence of this phenomenon is unknown. The cause of
poor growth is not known, although many different
reasons have been implicated. Abnormal nocturnal
growth hormone (GH) secretion has been suggested
as one possible cause.
5,9,12Circulating concentrations of insulin-like growth
factor-I (IGF-I) and IGF-binding protein 3 (IGFBP-3)
are strongly related to diurnal GH secretion,
reflect-ing mean daily GH levels, and seem to correlate well
with physiologic changes in GH secretion.
13,14IGF-1
is perceived as the main mediator of the
growth-promoting actions of GH,
15but its association with
growth in children with OSAS has been poorly
ex-plored.
The purpose of this study was to examine the
growth of children with symptoms of obstructive
sleep disorder, verified as OSAS or primary snoring
on overnight sleep monitoring. The main objective
was to analyze the relationship between obstructive
sleep disturbance and biochemical growth factors, as
well as the effect of surgical treatment
(adenotonsil-lectomy) on growth and growth factors.
From the Departments of *Otorhinolaryngology, ‡Pediatrics, §Clinical Ge-netics,储Clinical Neurophysiology, and ¶Diagnostic Radiology, Oulu Uni-versity Hospital, Oulu, Finland; and #Hospital for Children and Adoles-cents, University of Helsinki, Helsinki, Finland.
Received for publication Jul 11, 2001; accepted Dec 13, 2001.
Reprint requests to (P.N.) Hiirihaukankatu 3, FIN-65320 Vaasa, Finland. E-mail: peter.nieminen@pp.qnet.fi
PARTICIPANTS AND METHODS Participants
The study population comprised children referred from pri-mary health care to the Department of Otorhinolaryngology, Oulu University Hospital, during the period 1994 –1997 for an assess-ment of their need for treatassess-ment because of nighttime snoring, apneas, or difficult breathing, presumably secondary to adenoton-sillar hypertrophy. Children with known upper airway anomalies, any underlying disease predisposing to upper airway obstruction, asthma, or perennial allergy were excluded. The parents com-pleted a detailed questionnaire regarding their child’s day and nighttime symptoms. After a review of the questionnaires, the children with symptoms for⬎6 months were invited for an ear, nose, and throat evaluation and a thorough update of patient history. If upper airway anomalies or abnormal facial morphology were recognized, the children were excluded. Previous adenoid-ectomy did not lead to exclusion. Seventy-eight children fulfilled the inclusion criteria. They had all symptoms suggestive of OSAS, were regular snorers and/or were observed to have apneas during sleep, and were scheduled for 2 visits 6 months apart.
Eight families (8 children) of the 78 children did not agree to take part in the assessments other than overnight sleep monitor-ing. Seventy children (40 boys), mean age 5.8 years, range 2.4 to 10.5 years, completed all the first-visit examinations and com-prised the initial study group. At the follow-up study 6 months later, the same examinations were repeated. At this time, 6 chil-dren did not participate in the study. Four cases involved a protocol violation, and 1 case suffered from technical problems. In 6 cases, the laboratory or radiograph examinations could not be repeated. Thus, 53 children (27 boys), mean age 6.5 years, range 2.9 to 11.1 years, successfully completed the whole study protocol. For the anthropometric measurements and endocrinologic studies, 35 children (16 boys) with no health related complaints, mean age 6.45, range 1.5 to 10.2 years, recruited from child welfare clinics and schools, were used as control subjects.16,17
An assent from the children in addition to informed consent from the parents were obtained. The study protocol was approved by the Ethics Committee, Medical Faculty, University of Oulu. The study was conducted according to the Declaration of Helsinki.
Methods
Two visits were scheduled 6 months apart. Based on the results from the first visit, the children were recognized as OSAS children or primary snorers (PS). The children who were monitored to have abnormal sleep were treated surgically, whereas the others were observed without intervention. All the baseline measurements were repeated on the second visit to evaluate the effects of the interventional modalities on the measured parameters.
All children underwent overnight sleep monitoring in the De-partment of Otorhinolaryngology and a clinical examination for anthropometric measurements in the Department of Pediatrics on the following morning. Thereafter, the blood samples were drawn, and the radiograph for bone age assessment was taken.
The nocturnal sleep was monitored with a 6-channel comput-erized polygraph with leads for an oro-nasal thermistor, a thora-coabdominal strain gauge, pulse oximetry, a body position sensor, leg electromyogram (EMG) , and a static charge sensitive bed. Channels for electroencephalogram , electro-oculogram, or chin EMG tracing were not available. All recordings were manually checked by the same clinical neurophysiologist (U.T.).
An obstructive apnea-hypopnea index (OAHI) of 1 or higher, including episodes lasting for 10 seconds or more, was considered abnormal in this study based on earlier findings18and on our own reference data.19Although short obstructive apneas lasting for 5 to 10 seconds were not included into the criterion index, they were also scored. An obstructive apneic episode was defined as com-plete cessation of the oronasal airflow as detected by the ther-mistor in the presence of continuous breathing efforts revealed by the thoracoabdominal strain gauge or the static charge sensitive bed. Hypopnea was defined as a reduction of at least 50% in the airflow signal.20 Mixed apneas and hypopneas starting with a central and continuing with an obstructive component were clas-sified into the obstructive apnea/hypopnea category. Central ap-nea was defined as cessation of the airflow in the absence of breathing efforts. Central apneas were not included into the cri-terion index. Intervals of periodic obstructive hypopneas with a
⬍50% decrease in the oronasal signal amplitude linked to a pulse increase at the termination of the hypopneas were scored.
All the patients and controls were examined for anthropometric measurements. Height was measured to the nearest 1.0 mm with a Harpenden wall-mounted stadiometer (Holtain Limited, Crymtech, Dyfed, United Kingdom) and weight to the nearest 0.1 kg with an electronic scale. Relative height (standard deviation score [SDS]) and weight for height (%) were assessed from Finnish growth charts.21Target height representing the relative midpar-ental height was calculated as follows: TH (standard deviation score, SDS)⫽[(height (cm) of mother⫹height (cm) of father)/ 2–171]/10.22Target height deficit was target height minus relative height at the final evaluation. The data on parental height were collected by means of a questionnaire.17The biceps, triceps, and subscapular skin folds were measured to the nearest 0.1 mm with a Harpenden skinfold caliper (John Bull, British Indicators Ltd, St Albans, Herts, United Kingdom).23Body mass index (BMI) was calculated [weight (kg) divided by height squared (m2)]. Finnish age- and gender-matched references were used to assess the rel-ative BMI in SDS.24Body density was calculated from the com-bined triceps and subscapular skin fold thickness values according to the method described by Parizkova.25The percentage of body fat was calculated with the method described by Keys and Brozek.26All the anthropometric measurements were performed 3 times, and the mean value was subsequently used. The stage of puberty was ascertained according to Tanner and Whitehouse.27 Radiologic bone age was assessed from radiographs of the left hand and wrist according to Greulich and Pyle.28
Blood samples were taken on the morning following sleep monitoring. Plasma IGF-I concentrations were analyzed with a radioimmunoassay using commercial reagents (Incstar Corpora-tion, Stillwater, MN) with a sensitivity of 1.0 nmol/L. Serum IGFBP-3 concentrations were determined radioimmunologically (Diagnostic Systems Laboratories Inc, Webster, TX) with a sensi-tivity of 30 g/L. The methods have intra-assay coefficients of variation ⬍5%. Both samples from the same individual were analyzed in the same assay, to exclude the effect of interassay variation.
Within a fortnight after the first visit children with OAHIⱖ2 (19 children) underwent tonsillectomy (and adenoidectomy, if not previously performed). Children with OAHI⬍2 were observed without intervention (34 children), including those with mildly abnormal sleep monitoring (1⬍OAHI⬍2).
One child with an OAHI of 2.34 was included in the noninter-vention group; because of ongoing speech therapy, the speech therapist suggested that surgical therapy should be avoided. The children served as their own controls. The results from the first and the second visits were analyzed within and between the groups.
Statistics
The data were processed using the SPSS for Windows software (SPSS Inc, Chicago, IL). Studentttest for 2 independent samples and paired samples was applied for normally distributed data. The nonparametric Mann-Whitney Utest and Wilcoxon signed rank tests were used for data with skewed distribution. The Man-tel-Haenszel2test was used for ordinal data. Regression analysis was applied when the dependent and independent variables were continuous, and the residuals ranged from⫺3 to 3 without obvi-ous skewness.
RESULTS First Visit
Thirty of the children studied had OSAS (OAHI
Bone age was only available from 27 children in
the control group (Table 3). The children with OSAS
and PS had a retarded relative bone age, whereas the
controls had an advanced bone age.
The mean circulating concentrations of IGF-I were
of the same magnitude in the 3 groups (Table 2). Both
the OSAS and the PS children had lower IGFBP-3
concentrations than the control subjects (
P
⫽
.001)
(Table 2). This was also true after adjustment for age.
No significant correlation was found between the
OAHI and the IGF-1 and IGFBP-3 concentrations
after adjustment for age.
Follow-up Visit
On the second visit, significant improvements
could be seen in the respiratory parameters in the
surgically treated group of 19 children (OAHI
⬎
2;
Table 4). In the nonsurgery group of 34 children
(OAHI
⬍
2), no significant changes were observed.
Weight for height and BMI had increased
signifi-cantly in the operated group (
P
⫽
.001 and
P
⫽
.01,
respectively). The increase in the weight for height in
the operated group seemed to be primarily
attribut-able to an increase of body fat (
P
⫽
.02); because
although the mean fat-free mass increased more in
the operated group, the difference was not
signifi-cant according to the linear regression model with
age and intervention status as independent variables
(B
⫽
0.59;
r
2⫽
0.21;
P
⫽
.08). Relative height
in-creased significantly only in the nonsurgery group
(
P
⫽
.02). There were no significant changes in bone
age between the 2 visits in either group.
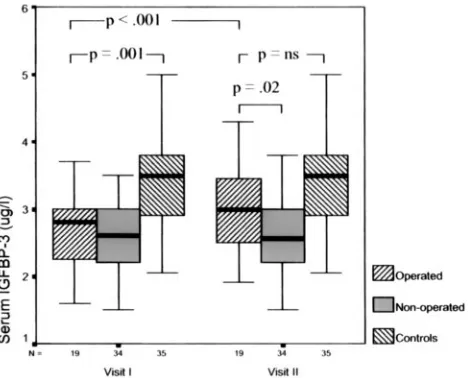
The peripheral concentrations of IGF-I and
IG-FBP-3 were significantly higher on the second
occa-sion in the operated children (
P
⫽
.002 and
P
⬍
.001;
Fig 1 and 2). In the nonsurgery group, the increases
in the circulating IGF-I and IGFBP-3 levels were
in-significant. The initially significant difference in
IG-FBP-3 levels between the operated children and the
controls (
P
⫽
.001) had disappeared at the second
visit (Fig 2). Only in 2 cases (10%) out of 19 were the
IGF-I and IGFBP-3 concentrations lower on the
sec-ond visit in the operated group, whereas in the
non-TABLE 1. Results of Sleep Monitoring on the First VisitVariable OSAS
(n⫽30)
P* Snorers (n⫽40)
Age (y) 5.67 (4.93–6.30) .40 6.04 (5.50–6.58) Earlier adenoidectomy 67% (20/30) .05 40% (16/40) Total apnea index,⬎10 s† 6.15 (4.52–7.77) .001 0.38 (0.28–0.49) OAHI,⬎10 s 5.40 (3.85–6.95) .001 0.13 (0.05–0.21) Obstructive apnea-hypopnea index,
⬎5 s
6.59 (4.81–8.38) .001 0.18 (0.09–0.26)
4% oxygen desaturation index 4.29 (1.70–6.88) ⬍.001 0.47 (0.19–0.74) Desaturation,⬎10% index 0.19 (0.05–0.34) .001 0.00 (0–0.01) Hypopneic episodes (⬍50%) with pulse
increases at the end of periods (min/h)
1.20 (0.79–1.61) .001 0.61 (0.40–0.81)
Children with an obstructive apnea-hypopnea indexⱖ1 were considered to have OSAS. The values are given as mean values and their 95% confidence intervals.
*Pindicates the statistical difference between the OSAS children and PSs. † Total apnea index includes obstructive and central apneas.
TABLE 2. Anthropometric Measurements on the First Visit in Children With OSAS
OSAS (n⫽30) P1 Snorers (n⫽40) P2 Controls (n⫽35) P3
Age (y) 5.67 (4.93–6.30) .40 6.04 (5.50–6.58) .37 6.45 (5.63–7.27) .15 Relative height (SDS) 0.23 (⫺0.15–0.61) .72 0.13 (⫺0.25–0.51) .39 0.36 (0.03–0.69) .60 Target height (SDS) 0.35 (0.15–0.55) .46 0.25 (0.07–0.43) .12 0.07 (⫺0.08–0.21) .02 Target height deficit (SDS) ⫺0.09 (⫺0.40–0.23) .92 ⫺0.13 (⫺0.44–0.17) .05 0.29 (⫺0.01–0.58) .07 Weight-for-height (%) 101.9 (97.2–106.7) .96 101.2 (98.2–104.2) .74 100.3 (97.2–103.3) .50 BMI (kg/m2) 15.9 (15.2–16.7) .92 15.7 (15.2–16.3) .51 16.0 (15.5–16.5) .86 Body fat mass (%) 18.1 (16.0–20.2) .17 16.5 (15.4–17.7) .95 16.6 (15.4–17.8) .18 IGF-I (nmol/L) 11.02 (9.79–12.23) .15 12.15 (11.14–13.16) .19 11.11 (9.81–12.41) .92 IGFBP-3 (g/L) 2.65 (2.46–2.85) .95 2.66 (2.49–2.83) .001 3.47 (3.17–3.78) .001
The children with primary snoring and the control group presented as mean values and their 95% confidence intervals.
P1 indicates the statistical difference between the OSAS children and primary snorers,P2 the difference between the primary snorers and normal controls, andP3 the difference between the OSAS children and controls.
TABLE 3. Bone Age According to Greulich and Pyle on the First Visit in the Children With OSAS, Those With Primary Snoring and the Controls
OSAS (n⫽29) P1 Snorers (n⫽40) P2 Controls (n⫽27) P3 Age (y) 5.54 (4.85–6.23) .37 6.04 (5.50–6.58) .001 7.46 (6.86–8.06) .001 Bone age (y) 5.46 (4.74–6.18) .42 5.82 (5.25–6.40) .001 7.73 (6.92–8.54) .001 Relative bone age (SDS) ⫺0.27 (⫺0.71–0.18) .84 ⫺0.33 (⫺0.72–0.03) .03 0.30 (⫺0.09–0.69) .06 The values are given as mean values and their 95% confidence intervals.
operated group the IGF-I and IGFBP-3 levels were
lower at the second visit in 44% (15/34) and 29%
(10/34) of the cases, respectively.
DISCUSSION
Improved growth, especially weight gain, after
re-solved OSAS was accompanied by a significant
in-crease in the circulating IGF-I and IGFBP-3
concen-trations. The pattern of growth improvement after
surgical treatment of OSAS was consistent with
ear-lier studies.
6 –11A detailed analysis of the different
body mass components showed that the weight
in-crease after treatment of OSAS was attributable to an
increased amount of fat rather than an increase in
fat-free mass.
The possible role of abnormal GH secretion in the
observed growth impairment in OSAS children has
been addressed in a series of studies.
5,7–11Recently,
Bar et al
9demonstrated a significant increase in
weight and serum IGF-1 concentrations after surgical
treatment of OSAS in 10 prepubertal children. In the
present study, this was confirmed in 19 children
operated on and assessed twice. Moreover, 34
chil-dren with similar symptoms without significant
OSAS were observed without surgical intervention.
At baseline, altogether 70 children with obstructive
sleep disorder were assessed for overnight sleep
monitoring, and their anthropometric data and
growth factor concentrations were compared with
those found in the control subjects.
16,17GH stimulates the synthesis of IGF-I in the liver
and other target tissues.
29IGF-I is considered as the
main mediator of the growth-promoting actions of
GH,
15reflecting the daily mean GH levels, and it has
been reported to correlate well with the physiologic
changes in GH secretion.
13Among prepubertal
chil-dren, IGF-I is not clearly sex-dependent.
30In this
study, the children remained in prepuberty, when
the peripheral IGF-I levels increase fairly slowly,
30so
the increase in age over the relatively short time
interval between the first and second measurements
must have very modestly affected the circulating
IGF-I concentrations, as shown by the insignificant
increase observed in the nonoperated children.
Ac-cordingly, the significant increase in peripheral
IGF-1 levels observed in the operated children
sug-gests that the alleviated airway obstruction resulted
in increased GH secretion.
IGFBP-3, the GH-dependent major carrier protein
of IGF-I, has also been shown to correlate
signifi-cantly with nocturnal GH secretion, but not as
strongly as in the case of IGF-I.
14Although IGFBP-3
probably exerts some functions of its own on cells, its
major role is to prolong the half-life of IGF-1.
31The
major advantage of IGFBP-3 determinations in
diag-nostics is its relative stability over time,
14and it may
therefore be a more reliable indicator of GH secretion
over a longer time span than IGF-I. It is also less
dependent of age than IGF-I.
31In contrast to the
findings of Bar et al,
9we observed that the IGFBP-3
concentrations increased significantly along with the
IGF-I levels in the operated children on the
follow-up, further strengthening the assumption of
in-creased GH secretion secondary to the relief of
air-way obstruction. The changes in circulating IGF-I
and IGFBP-3 concentrations in the follow-up study
were consistent in the sense that the peripheral
con-centrations only decreased slightly in 2 operated
in-dividuals.
Our findings are consistent with the findings in
adult OSAS patients, in whom it has been shown that
successful treatment results in a significant increase
in nocturnal GH secretion
32and peripheral IGF-I
levels.
33GH is released in a pulsatile fashion, with
the initial secretion probably synchronized with the
onset of slow-wave sleep (SWS), with a strong
cor-relation with
␦
-wave activity,
34within 90 to 120
min-utes from the onset of sleep.
29In adults, there is
convincing evidence of a consistent relationship
be-Fig 1. Plasma IGF-1 levels in children treated surgically for OSASand in nonoperated children at the first and second visits 6 months apart and in the control subjects. Each box-plot represents the median (thick black band) and the 25th and 75th centiles. The error bars represent the smallest and largest observed values except the outliers.
tween SWS and increased GH secretion and
de-creased GH secretion with awakenings.
35In OSAS
children, the sleep architecture is relatively
well-pre-served,
36and the distribution pattern of apneas over
the night is different from the profile of GH
secre-tion.
29,36One of the limitations of the methods used
in this study was the lack of electroencephalogram,
electro-oculogram, and chin EMG tracing, so the
dif-ferent sleep stages could not be difdif-ferentiated, but
changes in the proportion of SWS do not seem to be
significant after treatment of OSAS.
37Impaired GH secretion is probably not the only
cause for the failure to thrive, because OSAS children
may also be obese,
38,39but only the minority was
overweight in this study. The children classified as
having OSAS had a higher proportion of body fat,
but only 2 children had a BMI over 20, 1 girl with
OSAS (BMI: 21, OAHI: 11.8) and 1 boy who snored
(BMI: 20.2), and both the OSAS and PS children had
equal BMIs compared with the control group.
Increased appetite
11or reduced nighttime caloric
expenditure could explain some of the increase in fat
accumulation after the treatment of OSAS.
10How-ever, these do not explain the observed changes in
IGF-I and IGFBP-3 concentrations. The finding that
relative height increased significantly only in the
nonoperated group may be attributable to natural
variation in growth rate, as these children had lower
relative height at both visits than the OSAS children.
The fact that no significant differences could be
observed initially in the anthropometric data or the
circulating concentrations of IGF-I and IGFBP-3
be-tween the children with OSAS and those with
pri-mary snoring might be explained by sleep
abnormal-ities, which were also present in the children
considered PSs. The children in this study had all
symptoms suggestive of OSAS, although the
major-ity were found to be PSs. This is consistent with the
findings from other studies,
40,41where half or less of
the children with such symptoms were actually
con-firmed to have OSAS. The criterion for OSAS, OAHI
of 1 or higher, was based on normative data
estab-lished by others
18and our own findings in a group of
30 normal children.
19Coincident desaturation with
apnea/hypopnea was not a criterion for scoring in
this study. The mean 4% desaturation index was
significantly higher in the OSAS group than in the PS
group, whereas the PS children had a significantly
higher mean 4% desaturation index than the children
in our normative data group.
19The PS children had
also significantly more tachycardic episodes
associ-ated with prolonged partial obstructive
hypoventila-tion than the children in our normative data group,
19although significantly less than the children with
OSAS. Some of the PSs could perhaps have been
classified differently based on the hypoventilation
criterion,
18despite the lack of significant apneas and
hypopneas. The significantly reduced IGFBP-3
con-centrations in the PSs (as well as in the children with
OSAS) seem to indicate some longer-term
abnormal-ity in GH secretion also in the PS group. The
some-what younger age of the PSs than the controls is
hardly the explanation, because IGFBP-3 remained
stable in the nonsurgical group during the follow-up.
The fact that the snorers showed a similar target
height deficit and retarded bone age as the children
with OSAS further supports the idea of long-term
abnormality in growth regulation also in the PSs.
The selection of an OAHI of 2 or higher as the
criteria for surgery in the follow-up study was based
on the criteria of abnormal OAHI.
18,19The clinical
impact of mild OSAS is still unknown, which means
that children with OAHI
⬍
2 might well be observed
for a period of 6 months, whereas symptomatic
chil-dren with more abnormal sleep monitoring results
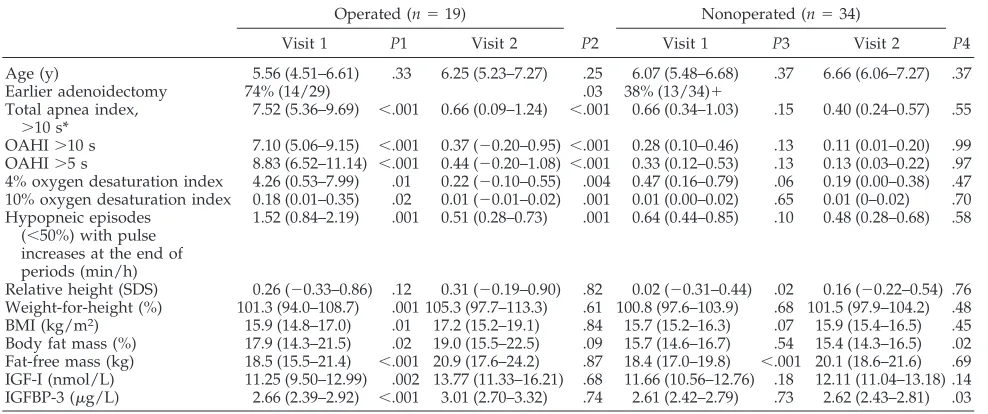
TABLE 4. Polysomnographic and Anthropometric Results on the 2 Visits in the Operated and Nonoperated Children Expressed as Means and Their 95% Confidence IntervalsOperated (n⫽19) Nonoperated (n⫽34)
Visit 1 P1 Visit 2 P2 Visit 1 P3 Visit 2 P4
Age (y) 5.56 (4.51–6.61) .33 6.25 (5.23–7.27) .25 6.07 (5.48–6.68) .37 6.66 (6.06–7.27) .37 Earlier adenoidectomy 74% (14/29) .03 38% (13/34)⫹
Total apnea index,
⬎10 s*
7.52 (5.36–9.69) ⬍.001 0.66 (0.09–1.24) ⬍.001 0.66 (0.34–1.03) .15 0.40 (0.24–0.57) .55
OAHI⬎10 s 7.10 (5.06–9.15) ⬍.001 0.37 (⫺0.20–0.95) ⬍.001 0.28 (0.10–0.46) .13 0.11 (0.01–0.20) .99 OAHI⬎5 s 8.83 (6.52–11.14) ⬍.001 0.44 (⫺0.20–1.08) ⬍.001 0.33 (0.12–0.53) .13 0.13 (0.03–0.22) .97 4% oxygen desaturation index 4.26 (0.53–7.99) .01 0.22 (⫺0.10–0.55) .004 0.47 (0.16–0.79) .06 0.19 (0.00–0.38) .47 10% oxygen desaturation index 0.18 (0.01–0.35) .02 0.01 (⫺0.01–0.02) .001 0.01 (0.00–0.02) .65 0.01 (0–0.02) .70 Hypopneic episodes
(⬍50%) with pulse increases at the end of periods (min/h)
1.52 (0.84–2.19) .001 0.51 (0.28–0.73) .001 0.64 (0.44–0.85) .10 0.48 (0.28–0.68) .58
Relative height (SDS) 0.26 (⫺0.33–0.86) .12 0.31 (⫺0.19–0.90) .82 0.02 (⫺0.31–0.44) .02 0.16 (⫺0.22–0.54) .76 Weight-for-height (%) 101.3 (94.0–108.7) .001 105.3 (97.7–113.3) .61 100.8 (97.6–103.9) .68 101.5 (97.9–104.2) .48 BMI (kg/m2) 15.9 (14.8–17.0) .01 17.2 (15.2–19.1) .84 15.7 (15.2–16.3) .07 15.9 (15.4–16.5) .45 Body fat mass (%) 17.9 (14.3–21.5) .02 19.0 (15.5–22.5) .09 15.7 (14.6–16.7) .54 15.4 (14.3–16.5) .02 Fat-free mass (kg) 18.5 (15.5–21.4) ⬍.001 20.9 (17.6–24.2) .87 18.4 (17.0–19.8) ⬍.001 20.1 (18.6–21.6) .69 IGF-I (nmol/L) 11.25 (9.50–12.99) .002 13.77 (11.33–16.21) .68 11.66 (10.56–12.76) .18 12.11 (11.04–13.18) .14 IGFBP-3 (g/L) 2.66 (2.39–2.92) ⬍.001 3.01 (2.70–3.32) .74 2.61 (2.42–2.79) .73 2.62 (2.43–2.81) .03
P1indicates the difference between the two visits in the operated children,P2the difference between the operated and nonoperated at the first visit, P3 the difference between the 2 visits in the nonoperated children, andP4 the difference between the operated and nonoperated children at the second visit.
could hardly be subjected to any follow-up or
blinded study because of ethical reasons.
We found here that the circulating IGF-I and
IG-FBP-3 concentrations increased significantly in
chil-dren with OSAS after surgical treatment, along with
a significant increase in weight. These findings
sug-gest decreased nocturnal GH secretion secondary to
upper airway obstruction in children. The
mecha-nisms of the initially impaired GH axis have to be
elucidated in additional studies.
ACKNOWLEDGMENTS
This study was supported by grants from the Finnish Ear Research Foundation (P.N.) and the Sigrid Juse´lius Foundation (M.K.).
We thank Sirpa Anttila for skillful technical assistance.
REFERENCES
1. Ali NJ, Pitson D, Stradling JR. Natural history of snoring and related behaviour problems between the ages of 4 and 7 years.Arch Dis Child. 1994;71:74 –76
2. Ali NJ, Pitson DJ, Stradling JR. Snoring, sleep disturbance, and behav-iour in 4 –5 year olds.Arch Dis Child. 1993;68:360 –366
3. Teculescu DB, Caillier I, Perrin P, Rebstock E, Rauch A. Snoring in French preschool children.Pediatr Pulmonol. 1992;13:239 –244 4. Gislason T, Benediktsdottir B. Snoring, apneic episodes, and nocturnal
hypoxemia among children 6 months to 6 years old. An epidemiologic study of lower limit of prevalence.Chest. 1995;107:963–966
5. Singer LP, Saenger P. Complications of pediatric obstructive sleep ap-nea.Otolaryngol Clin North Am. 1990;23:665– 676
6. Brouillette RT, Fernbach SK, Hunt CE. Obstructive sleep apnea in infants and children.J Pediatr. 1982;100:31– 40
7. Bate TW, Price DA, Holme CA, McGucken RB. Short stature caused by obstructive apnoea during sleep.Arch Dis Child. 1984;59:78 – 80 8. Stradling JR, Thomas G, Warley AR, Williams P, Freeland A. Effect of
adenotonsillectomy on nocturnal hypoxaemia, sleep disturbance, and symptoms in snoring children.Lancet. 1990;335:249 –253
9. Bar A, Tarasiuk A, Segev Y, Phillip M, Tal A. The effect of adenoton-sillectomy on serum insulin-like growth factor-I and growth in children with obstructive sleep apnea syndrome.J Pediatr. 1999;135:76 – 80 10. Marcus CL, Carroll JL, Koerner CB, Hamer A, Lutz J, Loughlin GM.
Determinants of growth in children with the obstructive sleep apnea syndrome.J Pediatr. 1994;125:556 –562
11. Williams EF III, Woo P, Miller R, Kellman RM. The effects of adeno-tonsillectomy on growth in young children.Otolaryngol Head Neck Surg. 1991;104:509 –516
12. Goldstein SJ, Wu RH, Thorpy MJ, Shprintzen RJ, Marion RE, Saenger P. Reversibility of deficient sleep entrained growth hormone secretion in a boy with achondroplasia and obstructive sleep apnea.Acta Endocrinol (Copenh). 1987;116:95–101
13. Furlanetto RW. Insulin-like growth factor measurements in the evalu-ation of growth hormone secretion.Horm Res. 1990;33:25–30 14. Blum WF, Albertsson-Wikland K, Rosberg S, Ranke MB. Serum levels of
insulin-like growth factor I (IGF-I) and IGF binding protein 3 reflect spontaneous growth hormone secretion.J Clin Endocrinol Metab. 1993; 76:1610 –1616
15. Isaksson OG, Lindahl A, Nilsson A, Isgaard J. Mechanism of the stim-ulatory effect of growth hormone on longitudinal bone growth. Endo-crinol Rev. 1987;8:426 – 438
16. Nuutinen M, Kouvalainen K, Knip M. Good growth response to growth hormone treatment in the ring chromosome 15 syndrome.J Med Genet. 1995;32:486 – 487
17. Lopponen T, Saukkonen AL, Serlo W, Tapanainen P, Ruokonen A, Knip M. Reduced levels of growth hormone, insulin-like growth factor-I and binding protein-3 in patients with shunted hydrocephalus.Arch Dis Child. 1997;77:32–37
18. Marcus CL, Omlin KJ, Basinki DJ, et al. Normal polysomnographic values for children and adolescents. Am Rev Respir Dis. 1992;146: 1235–1239
19. Nieminen P, Tolonen U, Lopponen H. Snoring and obstructive sleep apnea in children: a 6-month follow-up study.Arch Otolaryngol Head Neck Surg. 2000;126:481– 486
20. Gould GA, Whyte KF, Rhind GB, et al. The sleep hypopnea syndrome. Am Rev Respir Dis. 1988;137:895– 898
21. Sorva R, Perheentupa J, Tolppanen EM. A novel format for a growth chart.Acta Paediatr Scand. 1984;73:527–529
22. Sorva R, Tolppanen EM, Lankinen S, Perheentupa J. Growth evaluation: parent and child specific height standards.Arch Dis Child. 1989;64: 1483–1487
23. Owen G. Measurement, recording and assessment of skinfold thickness in childhood and adolescence, report of a small meeting.Am J Clin Nutr. 1997;35:629 – 636
24. Dahlstrom S, Viikari J, Akerblom HK, et al. Atherosclerosis precursors in Finnish children and adolescents. II. Height, weight, body mass index, and skinfolds, and their correlation to metabolic variables.Acta Paediatr Scand. 1985;318:65–78
25. Parizkova J. Measurement, recording and assessment of skinfold thick-ness in childhood and adolescence, report of a small meeting. Metabo-lism. 1961;10:794 – 807
26. Keys A, Brozek J. Body fat in adult man.Physiol Rev. 1953;33:245–325 27. Tanner JM, Whitehouse RH. Clinical longitudinal standards for height,
weight, height velocity, weight velocity, and stages of puberty.Arch Dis Child. 1976;51:170 –179
28. Greulich W, Pyle S.Radiographic Atlas of Skeletal Development of the Hand and Wrist.Stanford, CA: Stanford University Press; 1959
29. Tapanainen P, Knip M. Evaluation of growth hormone secretion and treatment.Ann Med. 1992;24:237–247
30. Juul A, Bang P, Hertel NT, et al. Serum insulin-like growth factor-I in 1030 healthy children, adolescents, and adults: relation to age, sex, stage of puberty, testicular size, and body mass index.J Clin Endocrinol Metab. 1994;78:744 –752
31. Rosenfeld RG, Hwa V, Wilson L, et al. The insulin-like growth factor binding protein superfamily: new perspectives.Pediatrics. 1999;104: 1018 –1021
32. Saini J, Krieger J, Brandenberger G, Wittersheim G, Simon C, Follenius M. Continuous positive airway pressure treatment. Effects on growth hormone, insulin and glucose profiles in obstructive sleep apnea pa-tients.Horm Metab Res. 1993;25:375–381
33. Grunstein RR, Handelsman DJ, Lawrence SJ, Blackwell C, Caterson ID, Sullivan CE. Neuroendocrine dysfunction in sleep apnea: reversal by continuous positive airways pressure therapy.J Clin Endocrinol Metab. 1989;68:352–358
34. Gronfier C, Luthringer R, Follenius M, et al. A quantitative evaluation of the relationships between growth hormone secretion and delta wave electroencephalographic activity during normal sleep and after enrich-ment in delta waves.Sleep. 1996;19:817– 824
35. Van Cauter E, Plat L, Copinschi G. Interrelations between sleep and the somatotropic axis.Sleep. 1998;21:553–566
36. Goh DY, Galster P, Marcus CL. Sleep architecture and respiratory disturbances in children with obstructive sleep apnea.Am J Respir Crit Care Med. 2000;162:682– 686
37. Frank Y, Kravath RE, Pollak CP, Weitzman ED. Obstructive sleep apnea and its therapy: clinical and polysomnographic manifestations. Pediat-rics. 1983;71:737–742
38. Guilleminault C, Korobkin R, Winkle R. A review of 50 children with obstructive sleep apnea syndrome.Lung. 1981;159:275–287
39. Silvestri JM, Weese-Mayer DE, Bass MT, Kenny AS, Hauptman SA, Pearsall SM. Polysomnography in obese children with a history of sleep-associated breathing disorders.Pediatr Pulmonol. 1993;16:124 –129 40. Leach J, Olson J, Hermann J, Manning S. Polysomnographic and clinical findings in children with obstructive sleep apnea.Arch Otolaryngol Head Neck Surg. 1992;118:741–744