University of Pennsylvania
ScholarlyCommons
Publicly Accessible Penn Dissertations
1-1-2014
Urbanization and Demographic Change in
Sub-Saharan Africa: Three essays on fertility and child
mortality differentials in a rapidly urbanizing
context
Jamaica CorkerUniversity of Pennsylvania, jamaica_corker@yahoo.com
Follow this and additional works at:http://repository.upenn.edu/edissertations
Part of theAfrican Languages and Societies Commons,African Studies Commons,Demography, Population, and Ecology Commons, and theMedicine and Health Sciences Commons
This paper is posted at ScholarlyCommons.http://repository.upenn.edu/edissertations/1243 For more information, please contactlibraryrepository@pobox.upenn.edu.
Recommended Citation
Corker, Jamaica, "Urbanization and Demographic Change in Sub-Saharan Africa: Three essays on fertility and child mortality differentials in a rapidly urbanizing context" (2014).Publicly Accessible Penn Dissertations. 1243.
essays on fertility and child mortality differentials in a rapidly urbanizing
context
Abstract
Nearly all demographic research on sub-Saharan Africa (SSA) utilizes a strict urban/rural dichotomy, which implicitly assumes homogenous demographic outcomes within these categories. In this dissertation, I use data from the Demographic and Health Surveys (DHS) to demonstrate that using an urban continuum reveals substantial differences in the demographic outcomes among SSA's growing urban settlements. In the first chapter, I use event-history analysis to examine whether SSA's long-held urban child survival advantage is diminishing, accounting for differentials in city size and potential bias in survival rates due to migration. I find the overall under-5 survival advantage of urban over rural areas persists but that there is a widening of the advantage in the largest cities over smaller urban areas. In the second chapter, I model annual birth
probabilities to examine whether there is a discernible "urban effect" of lower fertility among internal migrants in West Africa. Results suggest an association of urban residence and lower fertility, as women who moved either to or from urban areas have lower annual odds of a birth compared to both rural non-migrants and rural-to-rural migrants. I also find that women who relocate to the largest cities have lower fertility than do women who move to smaller urban areas, suggesting that the influence of urban residence on fertility is strongest where fertility rates are lowest. In the final chapter, I estimate total fertility rates and under-5 mortality probabilities for cities of different size in West Africa by linking DHS cluster data to census and geographic information systems (GIS) data for four distinct urban sub-categories. Results show a clear gradient in fertility and child mortality in urban areas according to size, with the largest cities most
advantaged; this gradient is as steep between the largest and smallest urban areas as it is between the smallest urban and rural areas. I use the findings from this dissertation to argue for wider use of urban continuums in demographic research on SSA instead of the continued reliance on a strict urban/rural dichotomy that obscures important nuances in the interrelationship of urbanization and demographic change in this rapidly-urbanizing region.
Degree Type Dissertation
Degree Name
Doctor of Philosophy (PhD)
Graduate Group Demography
First Advisor Michel Guillot
Keywords
child mortality, fertility, internal migration, rural-urban differentials, sub-Saharan Africa
African Languages and Societies | African Studies | Demography, Population, and Ecology | Medicine and Health Sciences
URBANIZATION AND DEMOGRAPHIC CHANGE IN SUB-SAHARAN AFRICA: THREE ESSAYS ON FERTILITY AND CHILD MORTALITY DIFFERENTIALS IN
A RAPIDLY-URBANIZING CONTEXT
Jamaica Corker
A DISSERTATION
in
Demography
Presented to the Faculties of the University of Pennsylvania
in
Partial Fulfillment of the Requirements for the
Degree of Doctor of Philosophy
2014
Supervisor of Dissertation
_____________________
Michel Guillot
Associate Professor of Sociology
Graduate Group Chairperson
_______________________
Michel Guillot
Associate Professor of Sociology
Dissertation Committee
Michel Guillot Associate Professor of Sociology
URBANIZATION AND DEMOGRAPHIC CHANGE IN SUB-SAHARAN AFRICA: THREE ESSAYS ON FERTILITY AND CHILD MORTALITY DIFFERENTIALS IN A RAPIDLY-URBANIZING CONTEXT
COPYRIGHT
2014
Jamaica Corker
This work is licensed under the Creative Commons Attribution- NonCommercial-ShareAlike 3.0 License
To view a copy of this license, visit
ACKNOWLEDGMENTS
I would like to thank Prof. Michel Guillot, Prof. Jere Behrman and Prof. Emilio Parrado
for serving on my dissertation committee and for the excellent guidance they provided
me throughout my Ph.D. candidacy. Special thanks to Prof. Deborah Balk for her
invaluable assistance with and input on my third chapter, and to the CUNY Institute for
Demographic Research for hosting me during numerous trips to NYC throughout 2014. I
would like to acknowledge the input of the researchers and colleagues who offered
feedback on my second chapter during my research exchange at the Institut National d`
Etudes Démographiques (INED) in Paris in the spring of 2014. I am particularly grateful
to Rachel Margolis, Apoorva Jadhav and Susan Watkins for reading many versions of the
early drafts of my first two chapters and providing me with wonderfully frank and
constructive feedback. Finally, I’d like to acknowledge the support provided by my
cohort members and the other students of the Graduate Group in Demography at the
ABSTRACT
URBANIZATION AND DEMOGRAPHIC CHANGE IN SUB-SAHARAN AFRICA: THREE ESSAYS ON FERTILITY AND CHILD MORTALITY DIFFERENTIALS IN
A RAPIDLY-URBANIZING CONTEXT
Jamaica Corker
Michel Guillot
Nearly all demographic research on sub-Saharan Africa (SSA) utilizes a strict urban/rural
dichotomy, which implicitly assumes homogenous demographic outcomes within these
categories. In this dissertation, I use data from the Demographic and Health Surveys
(DHS) to demonstrate that using an urban continuum reveals substantial differences in
the demographic outcomes among SSA’s growing urban settlements. In the first chapter,
I use event-history analysis to examine whether SSA's long-held urban child survival
advantage is diminishing, accounting for differentials in city size and potential bias in
survival rates due to migration. I find the overall under-5 survival advantage of urban
over rural areas persists but that there is a widening of the advantage in the largest cities
over smaller urban areas. In the second chapter, I model annual birth probabilities to
examine whether there is a discernible “urban effect” of lower fertility among internal
migrants in West Africa. Results suggest an association of urban residence and lower
fertility, as women who moved either to or from urban areas have lower annual odds of a
birth compared to both rural non-migrants and rural-to-rural migrants. I also find that
women who relocate to the largest cities have lower fertility than do women who move to
strongest where fertility rates are lowest. In the final chapter, I estimate total fertility rates
and under-5 mortality probabilities for cities of different size in West Africa by linking
DHS cluster data to census and geographic information systems (GIS) data for four
distinct urban sub-categories. Results show a clear gradient in fertility and child mortality
in urban areas according to size, with the largest cities most advantaged; this gradient is
as steep between the largest and smallest urban areas as it is between the smallest urban
and rural areas. I use the findings from this dissertation to argue for wider use of urban
continuums in demographic research on SSA instead of the continued reliance on a strict
urban/rural dichotomy that obscures important nuances in the interrelationship of
TABLE OF CONTENTS
ACKNOWLEDGMENTS ... III
ABSTRACT ... IV
LIST OF TABLES ... VIII
LIST OF ILLUSTRATIONS ... X
PREFACE ... XI
CHAPTER 1: UNDER-5 MORTALITY AND CITY SIZE IN SUB-SAHARAN AFRICA:
URBAN ADVANTAGE FOR ALL? ... 1
Introduction ... 1
Background ... 4
Data... 10
Methods ... 16
Results ... 19
Discussion ... 31
Conclusion ... 35
CHAPTER 2: NOT JUST WHEN BUT WHERE: INVESTIGATING INTERNAL MIGRATION FERTILITY DECLINE IN WEST AFRICA ... 37
Introduction ... 37
Theoretical Background ... 38
The West African Context ... 43
The Present Study ... 47
Data... 49
Results and Discussion ... 62
CHAPTER 3:URBAN FERTILITY AND CHILD MORTALITY IN WEST AFRICA: ARE ALL CITIES CREATED EQUAL? ... 80
Introduction ... 80
Methods ... 100
Results ... 114
Discussion ... 126
Limitations and Future Research Directions ... 131
Conclusion ... 133
APPENDIX ... 135
LIST OF TABLES CHAPTER 1:
Table 1: Description of DHS datasets in the analysis
Table 2: Average annual growth rate of rapidly growing large cities in sub-Saharan Africa for countries in the analysis from 1995 to 2010
Table 3: Descriptive statistics by mothers' residence type for ten sub-Saharan African countries
Table 4: Changes in under-5 survival estimates by residence type ten sub-Saharan African countries
Table 5: Kaplan-Meier survival estimates to age five for ten sub-Saharan African countries by urban/rural residence
Table 6: Kaplan-Meier survival estimates to age five for ten sub-Saharan African countries by urban residence
Table 7: Cox proportional hazards model for survival to age five for ten sub-Saharan African countries
Table 8: Cox proportional hazards models for survival to age five by resident type dichotomies in ten sub-Saharan African countries
CHAPTER 2:
Table 1: DHS datasets included in the analysis Table 2: Migrant categories for women in the sample Table 3: Descriptive statistics for non-migrants Table 4: Descriptive statistics for migrant categories
Table 5: Poisson model of cumulative fertility by migrant status (0-9 years since last move)
Table 6: Poisson model of cumulative fertility for migrants by duration in place of residence
Table 7: Discrete-time logit model for fertility (annual probability of a birth)
Table 8: Discrete-time logit model for migrants: comparison of birth probabilities in year
t before and after migration
Table 9: Discrete-time logit model for annual birth probabilities for migrants by duration at place of destination
Table 11: Mean age at first birth, all births and migration
CHAPTER 3:
Table 1: Data sources in the analysis
Table 2: DHS Surveys included in the analysis
Table 3: City class categories for urban areas in West Africa
Table 4: Cities and clusters per class size (all countries combined using the most recent survey per country)
Table 5: Suburban cluster categories
Table 6: Rural DHS clusters that fall within GRUMP urban extents
Table 7: Mean percent of households with household electricity, access to improved drinking water, improved sanitation and women who have moved to current location within the past five years (weighted)
Table 8: Descriptive statistics by city class category with largest city suburbs (original proportions for categories 2 & 3 in italics)
Table 9: TFR by residence type
Table 10: TFR by residence including city suburban class categories Table 11: Under-5 mortality by different residence categories
LIST OF ILLUSTRATIONS
CHAPTER 1:
Graphs 1 & 2: Kaplan-Meier survival estimates by residence for ten sub-Saharan African countries: 1995-2000 and 2005-2010
CHAPTER 2:
Figure 1: Age-specific fertility rates by migrant category (0-8 years in place of destination)
CHAPTER 3:
Map 1: Map of West African countries included in the analysis
Map 2: Mapping of all DHS-designated urban and rural clusters for analysis countries Map 3: Cluster Mapping for Cote d’Ivoire 1999: by DHS designation of
urban/rural, v026, and city class size categories Map 4: “Suburban” category mapping for Ghana 2008
Map5: Illustration of rural clusters re-categorized to semi-urban categories (from Senegal 2011)
PREFACE
Sub-Saharan Africa (SSA) is currently the world’s fastest urbanizing region, and
is projected to retain that position until 2030 when it will to transition from being
predominately rural to predominately urban (UN-Habitat 2010). The United Nations
forecasts that between 2005 and 2025, 87% of population growth in Africa will occur in
urban areas (UN-Habitat 2003) and while SSA’s rapid rate of urbanization is not
extraordinary from a global historical perspective, the absolute numbers and the rates of
urban growth are unprecedented (National Research Council 2003). Continued rapid
urban growth in SSA will likely further strain already over-burdened infrastructure and
social services, particularly in the smallest cities which often have the fewest resources
available for meeting the needs of growing populations (UN-Habitat 2010; Montgomery
2009).
The dynamics of urbanization and urban growth in SSA are not well understood.
In contrast to other regions of the world, the urban transition in SSA has preceded
industrialization (Oucho and Gould 1993) and is generally occurring without the
concurrent economic growth that accompanied nearly all examples of urbanization
elsewhere in the 19th and 20th century (Dyson 2010; Leon 2007). Though the process of
urbanization has generally been linked to economic development (Kelley and Williamson
1984b; Davis and Golden 1954), the evidence on the relationship between urbanization
and improved living standards, and demographic outcomes, in SSA is less clear. Some
research on SSA’s current urban transition has voiced concerns over the proliferation of
UN-Habitat 2003; Garenne 2008). Yet other studies show that urban dwellers in SSA
have better living standards, and higher education levels and enjoy a child survival
advantage over their rural counterparts (Brockerhoff 1994; Bocquier 2011), in addition
having lower fertility thought to act as the driving force behind the region’s fertility
transition (Shapiro and Tambashe 2000).
Nearly all demographic research on SSA uses an urban/rural dichotomy, which
implicitly assumes that urban areas of vastly different size are undergoing a homogenous
process of urban growth. I believe this blunt urban/rural dichotomy may obscure
important nuances of the interrelationship of urbanization and demographic change in
SSA. I plan to empirically demonstrate this by using more specific urban sub-categories
in all three of the chapters in this dissertation.
In the first chapter, I investigate whether rapid urbanization rates in SSA have
contributed to a narrowing of the region’s historic under-5 urban survival advantage.
Using DHS data from ten SSA countries, I measure the aggregate change in this
advantage between 1995-2000 and 2005-2010. I find that overall the urban advantage
persists and remains virtually unchanged due to similar rates of improvement in child
survival in both rural and urban areas. I then examine whether improvements in urban
child survival are uniform across urban areas of different sizes by segmenting the largest
and fastest growing cities from all other areas defined as urban. Results indicate that there
is a widening in the child survival advantage in the largest cities over other urban areas,
compared to both large cities and rural areas. These findings add support to the literature
that finds that rapid urbanization in SSA poses the greatest risk to improvements in child
survival in the smaller cities that are likely to see the greatest proportional growth in the
coming decades (Brockerhoff and Brennan 1998; Montgomery 2009).
In the second chapter, I seek to determine if there is an “urban effect” on fertility
(an association of urban residence and lower fertility exclusive of socio-demographic
characteristics) discernable among internal migrants. This chapter uses DHS data from 26
surveys from 11 countries to investigate changes in fertility behavior within the
urbanization framework to examine whether residence in a new area following an internal
move is associated with changes in fertility behavior, namely lower fertility outcomes. In
a departure from most previous research on the fertility/migration residence, I examine
whether this effect is strongest among migrants to the largest urban areas, where fertility
rates are lowest, and whether an urban effect is also apparent among migrants who move
away from urban areas and take up residence in rural areas. I find evidence of reduction
in fertility for nearly every migrant group. Analysis in this chapter, however, highlights
two methodological issues that challenge research on the migration and fertility literature.
First is the difficulty of defining a reference category as counterfactual against which to
measure changes in fertility among those who move. Second, models and measurements
of fertility among those women who have changed residence type are heavily influenced
by natural age patterns of fertility and patterns in the timing of fertility and failing to
In the third chapter I aim to produce locally informed estimates of fertility and
mortality by four categories of city size across West Africa. Chapter 3 extends the work
in Chapters 1 and 2 that looks beyond the urban-rural dichotomy by creating a more
detailed division of city class sizes inclusive of all urban areas within each country. I find
clear evidence of a gradient in urban characteristics and demographic outcomes across
urban areas of different size. The largest cities are the most advantaged in terms of access
to urban amenities (defined as household electrification, access to improved sanitation
and access to safe drinking water), lower fertility and under-5 mortality rates, and the
smaller cities most disadvantaged. This chapter has two particularly interesting findings.
First, the suburbs (satellite cities) of the largest cities in the region have the lowest
fertility and child mortality rates of all urban areas, substantially lower than even those of
the largest cities. Second, it is not the category of smallest urban areas but that of the
second-smallest category which have the highest fertility and child mortality rates across
urban areas. Despite a sharp gradient in fertility and mortality rates as city sizes decrease,
even the smallest urban areas have fertility and child mortality that is substantially and
significantly lower than those in rural areas; this difference, however, is approximately
the same as that between the smallest and largest urban areas. This chapter uses its
findings to argue for the need to give greater consideration to using an urban continuum,
rather than a simply urban/rural dichotomy, in demographic research in West Africa.
The theme of urbanization in sub-Saharan Africa ties together the three papers
presented in this proposal. By examining how changes in fertility, mortality and
urbanization in the region may be influencing and influenced by differential patterns of
fertility and child mortality. Through an investigation of the relationship between the
urban transition and demographic change, I hope to shed light on the patterns and
potential consequences of demographic change for SSA’s growing urban settlements. A
better and more nuanced understanding of urbanization and differential patterns of child
mortality and fertility in SSA is critical for understanding how urbanization may
influence demographic outcomes in the region that has the world’s highest rates of
CHAPTER 1
Under-5 Mortality and City Size in Sub-Saharan Africa:
Urban Advantage for All?
Introduction
Sub-Saharan Africa (SSA) is currently urbanizing faster than any other region in
the world. From 1990-2010, SSA’s average annual urban growth rate was 3.81 per cent,
compared with 2.91 for other less developed regions (United Nations 2012). SSA is
currently predominately rural but is projected to become majority urban by 2030
(UN-Habitat 2010), during which time continued rapid rates of urban growth are likely to
strain already over-burdened urban infrastructure and services throughout the region.
SSA’s urban residents, particularly infants and children, have long enjoyed a
survival advantage over their rural counterparts. There are indications, however, of recent
declines in the urban under-5 mortality advantage that have coincided with rapid rates of
urbanization and urban growth throughout the region, though recent literature has
provided inconsistent findings (Gould 1998; Fotso 2007; Antai et al. 2010). Several
single-country studies suggest that SSA’s urban child health advantage is declining
(Gould 1998; Macassa et al. 2003; Antai and Moradi 2010) but most aggregate or
multi-country studies find that the advantage holds (Brockerhoff and Brennan 1998; NCR
2003; van de Poel et al. 2007; Bocquier et al. 2011; Gunther and Harttgen 2012).
This study adds to the growing research that asks whether the under-5 survival
and potential bias in survival rates due to migration during the most recent period of rapid
urbanization. Since the 1990s, the majority of research on the under-5 mortality
differential in SSA has relied on an urban-rural dichotomy. Combining all urban areas
into one category implicitly assumes that changes in child survival chances are uniform
across all areas defined as urban and may obscure some of the subtleties of the
relationship between residence and child survival in SSA. Additionally, nearly all
research on SSA’s urban child survival advantage attributes child deaths only to the
mother’s place of residence at the time of the survey, which can result in biased estimates
in areas where migration is high and a considerable proportion of child deaths may have
occurred where the child lived before moving.
In this paper, I use Demographic and Health Survey (DHS) data from eleven SSA
countries to investigate whether there was an aggregate change in this advantage between
1995-2000 and 2005-2010. I find that the urban advantage persists and remains virtually
unchanged due to similar rates of improvement in child survival in rural and urban areas.
I then examine whether there is a difference in urban advantage among the largest and
fastest growing cities or if improvements are uniform across all areas defined as urban.
Results indicate that there is a widening in the survival advantage of children who live in
the largest and fastest growing cities over those in other urban areas. To address the
potential bias in under-5 survival measurements due to high rates of migration that have
accompanied SSA’s rapid urbanization, I allocate each migrant child’s risk of dying (and,
when it occurs, death) to the period of his or her life spent in the place of origin and
Through this analysis I aim to determine whether, apart from individual
characteristics, the totality of urban factors offer children a better chance of surviving to
age 5 in SSA over time – and whether this geographic advantage differs by city size. I
thus focus on comparing averages of under-5 survival probabilities between rural, smaller
urban and largest urban areas rather than measuring differences in sub-groups of these
populations. These averages no doubt conceal substantial heterogeneity within these
populations, particularly intra-urban disparities of child mortality between the poor and
non-poor, but the aim here is to explore the combined effect of geographically specific
variations in health outcomes on survival probabilities for children in SSA. In a
cross-country study aimed at identifying overall patterns and trends, is not possible to account
for all the different contextual country- or city-specific factors, particularly those related
to urban policies and management, which might explain the child mortality differential
across a pooled sample of countries. It is possible, however, to gauge whether there is an
overarching pattern in urban and rural mortality rates at the aggregate that is associated
with the consequences of continued rapid rates of urbanization and population growth
throughout the region.
An accurate accounting of child survival risks by residence is particularly
important for SSA because of the massive demographic shift from rural to urban that the
region will continue to undergo in the coming decades. SSA’s rapid urbanization and
population growth, coupled with its high fertility rates and young age structure, mean that
any changes in urban child survival probabilities will impact two of the fastest-growing
Understanding how urbanization is related to geographic patterns of child mortality in
SSA is crucial for informing policies that will influence the geographic distribution of
resources to fight the region’s high child mortality rates.
Background
Rural-urban mortality differentials
Historically, European and American cities were characterized by an “urban
penalty” (Kearns 1988) with mortality rates substantially higher in cities compared to
rural areas, particularly for infants and children (Preston and Haines 1991). This was due
primarily to the spread of communicable diseases resulting from overcrowding and
unsanitary conditions in cities, despite the greater availability of health facilities and
higher overall incomes compared to rural areas (Gould 1998). By the twentieth century,
however, improvements in public health and sanitation had largely transformed this urban
mortality penalty into an urban survival advantage (Preston and Haines 1991; Haines
1995).
Conversely, African cities in the nineteenth and twentieth centuries generally
experienced an urban mortality advantage. Many of contemporary Africa’s largest cities
were designated as colonial centres in the nineteenth century with health-related
infrastructure and services established for the colonial settlers but with positive spillover
effects for local urban populations, which contributed to substantially lower mortality in
in the mid-twentieth century are few, but show urban survival advantages for infants and
children in Zambia (Mitchel 2009) and Sierra Leone (Kandeh 1989).
More recently, several single-country studies using time series data show
evidence of a narrowing of the urban child mortality advantage in SSA, notably in
Senegal in the 1970s (Antoine and Mbodji 1991) and in Mozambique from 19921
(Macassa et al. 2003), while increases in under-5 mortality rates in Nairobi have been
cited as an indication of a reversal in Kenya’s urban mortality advantage (Gould 1989).
Though these studies suggest an erosion of the urban child mortality advantage, each is
limited to the experience of a single country at different time points and it is not clear if
they represent the current overall trend throughout the region.
Alternatively, a handful of recent multi-country studies have found that SSA’s
overall urban child mortality advantage persists. Though some of these studies used
cross-sectional data (van de Poel et al. 2007; Bocquier et al. 2011), and thus do not
measure changes in this advantage, several studies used time series data from across the
region and generally find that the urban child survival and health advantage holds, but
with some variation in the findings. Fotso et al. (2007) found that urban child mortality
in the majority of SSA countries remained unchanged or declined only slightly (although
five countries showed sharp declines and three sharp increases) but did not directly
compare these with changes in rural rates. Fotso’s (2007) investigation of child
1
malnutrition in SSA showed that the urban advantage in child malnutrition had declined
notably in six countries, due to increases in urban malnutrition rates, and widened notably
in three countries. These and most similar studies look at individual countries to comment
on regional trends, rather than measuring changes in the region as a whole. One exception
is Gunther and Harttgen’s 2012 study which looked at the region as a whole –but not at
individual countries– and found that the overall child survival advantage in urban over
rural areas holds. The other notable exception is Brockerhoff and Brennan’s 1998 study,
which looked at child mortality across different world regions disaggregated by city size
category. They found that from the 1970s through the early-1990s, SSA had substantial
improvements in child survival in rural areas and towns and modest improvements in the
largest cities, but declines in overall child survival probabilities in smaller urban areas.
This analysis builds off these previous studies, combining different aspects of
several of them and using the most recently available data, but differs from them in two
respects. First, it moves beyond the urban/rural dichotomy used in nearly all these studies
(with the exception of Brockerhoff and Brennan’s 1998 study) by separating the largest
and fastest growing cities from all other areas defined as “urban”, using a standard
cross-country definition. Second, it accounts for the potential bias introduced by migration in
cases where a child’s mother moved before the child’s fifth birthday. With the notable
exception of Bocquier et al. (2011), most studies have overlooked the potential migration
bias of measuring child mortality rates, despite high rates of internal migration in the
region. Failure to account for migration status can introduce bias into estimates of
of the child in question, even if the child moved during the exposure period. Here, in
cases where a child moved before turning five, his or her risk of dying is divided between
previous and current place or residence and death, when it occurs, is attributed to the
child’s place of residence at that time, which would be different from the mother’s
residence at the time of survey if the child died before his or her mother’s migration.
Explanations for changes in SSA’s urban advantage
Recent declines cited in the urban survival advantage in SSA have generally been
attributed to stalls or declines in urban under-5 survival rates, rather than to the
improvements in rural health that narrowed the mortality gap in the second half of the
twentieth century (Gould 1998; UN-Habitat 2003; Fotso et al. 2007). SSA’s high rates of
urbanization and urban growth are thought to threaten the urban health advantage as
increasingly crowded and polluted cities are often unable to provide adequate housing,
water and sanitation for their growing populations(Faye et al.2005; Dyson 2010).
Much of the concern over potential declines in urban child health outcomes is
focused on the changing composition of urban dwellers, specifically the growth in the
proportion of the urban poor and migrants, and the proliferation of slums throughout the
region. The urban poor generally have child health outcomes that are worse than the
urban non-poor and, in some cases, worse than their rural counterparts (National
Research Council 2003; van de Poel et al. 2007; Montgomery 2009), suggesting that the
urban child mortality advantage could narrow if the proportion of urban poor increases.
than those of non-migrants (Brockerhoff and Yang 1994; Brockerhoff 1995; Antai et al.
2010), though more recent work by Bocquier et al. (2011) has questioned whether this is
always the case. Low child survival rates among in-migrants could contribute to
declining aggregate under-5 survival rates in cities and narrow the urban-rural mortality
differential, as was found to be the case in post-war Mozambique (Macassa et al.2003).
Not surprisingly, children in city slums generally have higher mortality rates than those in
non-slum areas (UN-Habitat 2003) but it is uncertain whether they face higher mortality
risks compared to children in rural areas (Gunther and Harttgen 2012; Fotso et al. 2007).
Cities in SSA already have the largest proportion of slum dwellers globally (UN-Habitat
2003), and the continued growth of slums could diminish the urban survival advantage if
child mortality rates in slums reach rates that are higher than in both non-slum urban and
rural areas.
After controlling for demographic and socio-economic correlates of under-5
mortality, several recent studies have found that the urban child survival advantage
decreases or disappears, most notably among the urban poor (Van de Poel et al. 2009;
Bocquier et al. 2011). This implies that the urban advantage is primarily a factor of
differences in urban-rural population characteristics, primarily greater levels of wealth
and higher education in cities, and not due to factors specific to living in an urban area.
Yet other research has found the urban child survival advantage is related not to
compositional differences in urban and rural populations but to advantages offered by the
urban environment, including greater immunization rates, improved infrastructure and
presents two possible scenarios as they relate to the urban child survival advantage. If
access to basic health services and sanitation infrastructure remains superior in cities,
despite the strains of rapid population growth, the urban under-5 mortality advantage will
hold. Alternatively, the advantage will narrow if there were a greater overall deterioration
of living conditions in cities compared to rural areas.
City Size and the Urban Health Advantage
Where a historic urban survival penalty has been identified, there is some
evidence that mortality rates have been highest in the largest cities (Cain and Hong
2009), particularly for infants and children (Williamson 1982). More recently, child
mortality rates were found to be nearly 20 per cent higher in Nairobi than in other urban
areas of Kenya during a period that coincided with particularly rapid population growth
in the city (Gould 1998). Mortality rates for children of urban in-migrants in less
developed countries were found to be higher in larger compared with smaller cities
(Brockerhoff 1995), suggesting an association between the size of an urban area and
decreased under-5 survival chances, at least for migrants.
In contemporary SSA, however, it may in fact be smaller cities that face the
greatest risks for stalls or declines in child health outcomes. Smaller cities in SSA tend
have the greatest proportional growth but often have the fewest resources available for
meeting the needs of growing populations (Montgomery 2009; UN-Habitat 2010) and are
often relatively underserved by government services, particularly health and hygiene
contrast to other developing regions of the world, infant mortality rates in SSA from the
1970s to the early 1990s were found to be higher in smaller cities (with populations of
50,000 to 1 million) than in larger urban areas (Brockerhoff and Brennan 1998). With
nearly two-thirds of SSA urban dwellers estimated to currently live in cities of fewer than
500,000 (National Research Council 2003) and the majority of urban growth in the
coming decades in SSA projected to occur in small- and medium-sized cities
(UN-Habitat 2010), this is an alarming finding.
Data
This analysis uses data from eleven SSA countries that had a Standard
Demographic and Health Survey (DHS) carried out between 1995–2000 and again
between 2005–2010 (Table 1), and which included data from respondents on both
migration and type of previous place of residence. Only countries that had surveys carried
out during both of these periods were included, in order to use the same number of
repeated observations per country and to measure period effects of mortality over a
standard time frame. I used these two time periods in order to consider the most recent
regional trends2 (from 2005-2010) and to compare these to trends from approximately ten
years prior in the same countries.
The DHS collects nationally representative data in less developed countries
2
through household sample surveys that measure health, population, and socioeconomic
indicators, with a focus on maternal and child health (Rutstein and Rojas 2006). DHS
surveys use standardized variables across surveys in order to be easily comparable across
countries. The DHS are cross-sectional surveys and so the time trend analysis in this
study is at the aggregate as different areas, but not individual respondents, can be linked
between the two surveys.
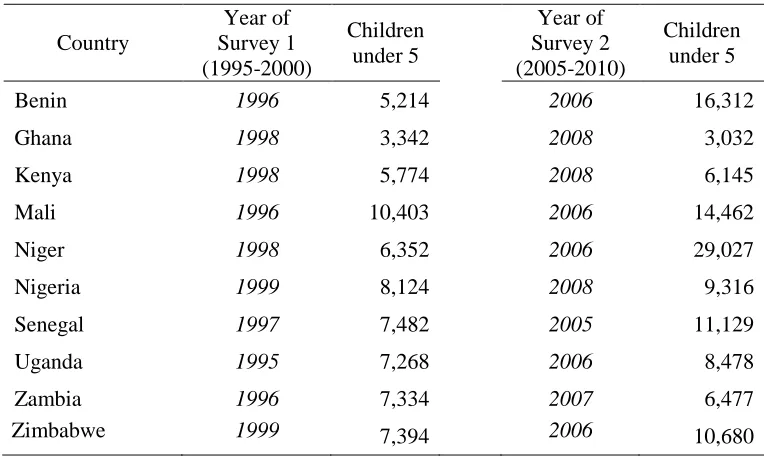
Table 1: Description of DHS datasets in the analysis
Country
Year of Survey 1 (1995-2000)
Children under 5
Year of Survey 2 (2005-2010)
Children under 5
Benin 1996 5,214 2006 16,312
Ghana 1998 3,342 2008 3,032
Kenya 1998 5,774 2008 6,145
Mali 1996 10,403 2006 14,462
Niger 1998 6,352 2006 29,027
Nigeria 1999 8,124 2008 9,316
Senegal 1997 7,482 2005 11,129
Uganda 1995 7,268 2006 8,478
Zambia 1996 7,334 2007 6,477
Zimbabwe 1999 7,394 2006 10,680
The two key variables for analysis are child survival and urban/rural residence.
The dependent variable is survival from birth to age five for all children born in the five
years preceding the survey. Child survival here is measured by under-5 mortality, a
combination of infant (0-1 years) and child (1-4 years) mortality, to provide a longer
survivorship. Child survival rates are calculated from the birth histories collected from all
women surveyed in the DHS. These birth histories include information on parity, month
and year of birth, child survivorship status and age at death for children who died. For the
latter, age of death is recorded in months for the first two years and then only in years. I
limit my analysis to children born within five years of the survey because a) reporting on
children born in the recent past tends to be more accurate and reliable than for those born
further in the past and b) I aim to capture the most recent trends in under-5 mortality for
direct comparisons across the two time periods with no overlap.
The analysis is segmented by residence at two levels: 1) stratified by urban and
rural areas and 2) stratified within urban areas by: a) rapidly-growing large cities
(RGLCs) and b) all other areas designated as urban in the DHS (see Table 2). This
division of urban areas is theoretical as well as practical. Theoretically, if rapid increases
in urban population are associated with declining survival outcomes for children under
five (Fotso et al. 2007), then the effects would be most evident in the cities experiencing
the fastest and/or greatest absolute growth. The practical reasons are factors of data
reliability and comparability: although the majority of urban residents in SSA live in
small to mid-sized cities, information on the populations or growth of these cities is far
less reliable given the variability in quality of country-level data (National Research
Council 2003; Montgomery 2009), rendering meaningful cross-country comparisons
Urban and rural areas, for which there is no standard international definition3, are
identified in the DHS according to each respective country’s definition of what
constitutes rural or urban residence, and are categorized using the dichotomous variable
for urban or rural residence (v102). I also identify a third category of residence:
rapidly-growing largest cities (RGLCs), defined here as cities with populations over 750,000 in
2009 that also experienced an average annual growth rate of 2.5% or greater from
1995-2010 (United Nations Population Division 1995-2010) (Table 2). For this third category I use
the variable for hierarchy of city type (v026 – which distinguishes between
“countryside”, “town”, “small city” and “capital/large city”) and GPS coordinates
provided by DHS to spatially locate which clusters correspond to RGLC4.Although this
allows for an accurate categorization of current place of residence for those living in
RGLCs, it is not possible to classify previous place of residence with the same precision;
thus respondents who migrated and whose previous place of residence is listed as
“capital/large city”, are classified as having moved from an RGLC. It is also worth noting
that while this categorization allows for a clear identification of RGLCs, “other urban”
areas here are still subject to the limitations of the urban/rural dichotomy.
3There is no international or standardized definition of urban and rural. The designation of an area as urban or rural is often based on administrative boundaries and/or population size, not necessarily on population density or other criteria that may more accurately differentiate urban from rural areas http://unstats.un.org/unsd/demographic/sconcerns/densurb/densurbmethods.htm
All control variables refer to the mother; as the majority of children under five in
SSA live with their mothers, any potential bias from separate mother-child residence is
believed to be small (Bocquier et al. 2011). Control variables are broadly categorized
using the Mosley and Chen (1984) conceptual framework, which outlines the main
proximate and socioeconomic determinants of child survival. Proximate determinants are
primarily the “biological risk factors” (such as mother’s age, birth interval length and
parity) that directly affect child mortality and are also the factors through which
socioeconomic determinants impact child survival. Socio-economic factors are
distinguished at the individual, household and community levels. Although
community-level factors have been shown to play a role in explaining urban/rural child survival
differentials (van de Poel et al. 2009), this analysis controls for individual and household
determinants only. This paper works off the assumption that there is likely substantial
variation in community characteristics within any particular urban area, but that health
and infrastructure variables related to child health are generally better at the aggregate in
urban compared to rural places.
Individual level controls include: mother’s age at the time of the birth, length of
the previous birth interval, parity and mother’s education. Mother’s age at birth is
categorized as 19 or younger, 20-35 and 35 or older. A birth interval is considered short if
it was less than 24 months after the previous birth and parity is measured for whether or
not the child was the firstborn. Educational attainment of mothers is coded as the highest
Household level controls include: wealth, main source of drinking water and toilet
facility. To approximate household wealth, I create an index using a principal component
analysis of common household assets, instead of using the standard DHS wealth index, in
order to account separately for two household infrastructure variables, water source and
toilet facility, which are strongly associated with child survival and are usually included
as factors within the DHS wealth quintiles. I use six household assets (radio, television,
bicycle, refrigerator, motorcycle, and car) in addition to the type of flooring in the
household, the number of people per room and whether the household has electricity. The
first principal component was used to categorize households into thirds (poor, middle and
wealthiest). Household wealth was estimated first at the country level (and shown in the
descriptive statistics), then separately for the urban and rural samples for each country,
and again separately for RGLCs and all other non-RGLC urban areas (used in the
multivariate analysis). Dummy variables for a household’s access to improved water and
type of toilet facility5 are included as separate variables in order to investigate whether
these measures of infrastructure, more commonly found in urban areas, have an impact
on under-5 survival independent from that of household wealth.
Migrants are defined here as respondents who have moved within the five years
before the year of the interview and are identified using information on current and last
place of residence from DHS surveys which includes the respondent’s current place of
5
residence and how long she has lived in this location. Women who do not respond
“always” for the length of time lived in the location of the interview are asked to identify
when they moved to their current location. Although this information does not provide a
comprehensive migration history, it does identify those who have moved at least once
before the survey and accounts for how long they have lived in their current place of
residence. Last, a dummy variable was included for the two time periods under
consideration, coded as 0 for the earlier period (1995-2000 and 2005-2010).
Methods
First, I show descriptive statistics for the pooled sample, with adjusted weights for
country population size at the regional level.
Next, I estimate Kaplan-Meier survival curves to test whether there are
differences in survival to age 5 by residence. This provides a nonparametric estimate of
the survivor function S(t), the probability of survival past time t (Cleves et al. 2010). All
children born within the five years preceding the survey are included, with children
considered at risk of death until age 5 and then left-censored. One advantage of using the
Kaplan-Meier method is that it can produce survival estimates to age five for the most
recent time period (i.e. the past five years), rather than only for those children who were
born more than five years before the survey. This permits calculating under-5 survival
probabilities for the five years preceding each survey without any overlap within a
Last, I use Cox proportional hazards models to examine the relationship between
survival to age 5 by residence and a set of demographic and socio-economic variables
known to be associated with under-5 mortality. The outcome variable is the risk of death
from birth to age five. The proportional hazards model assumes a baseline hazard that is
constant (in this case a baseline hazard for dying before age 5) with a similar underlying
shape across a population, and calculates a hazard rate as a factor of a baseline hazard
and included covariates (Cleves et al. 2010). The regression combines the pooled country
sample from both time periods and controls for country and time period. I estimate five
models in the Cox regression. Model 1 uses residential status as the only covariate.
Model 2 includes residential status and the main socio-demographic variables: mother’s
age at birth, length of the previous birth interval and whether or not the child was the
firstborn. Model 3 adds the socio-demographic variables: highest level of education
attained and asset third. Model 4 adds the two infrastructure variables: main source of
drinking water and whether the household uses a flush toilet or improved latrine. Model 5
adds the dummy variable for time period. All models include country-specific sample
weights, country-level fixed effects and robust standard errors calculated at the sample
cluster level.
The use of Kaplan-Meier survival curves and Cox regression allows for a more
accurate attribution of a child’s death among migrants to the place of residence at the
time of death. Instead of attributing a child’s death to the residence category of the
mother at the time of the survey, these methods allow for a child’s death to be attributed
(Bocquier et al. 2011). By permitting both right and left censoring, the Kaplan-Meier
method can attribute any deaths that occur to the residence at the time of death and can
likewise attribute a child’s exposure to the risk of dying to both the place of residence
before and after the move; children whose mothers move during their life time are right
censored from that residence category at the time of move and left censored into the new
residence category. The Cox proportional hazards model likewise allows for residence to
be a time-varying covariate and can divide analysis between a child’s pre-and
post-migration exposure in cases where the child moved before reaching age five or, when it
occurred, death. The pooled data used for the Kaplan-Meier estimates and Cox regression
is weighted by population size.
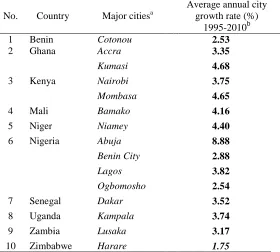
Table 2: Average annual growth rate of rapidly growing large cities in sub-Saharan Africa by country from 1995 to 2010
No. Country Major citiesa
Average annual city growth rate (%)
1995-2010b
1 Benin Cotonou 2.53
2 Ghana Accra 3.35
Kumasi 4.68
3 Kenya Nairobi 3.75
Mombasa 4.65
4 Mali Bamako 4.16
5 Niger Niamey 4.40
6 Nigeria Abuja 8.88
Benin City 2.88
Lagos 3.82
Ogbomosho 2.54
7 Senegal Dakar 3.52
8 Uganda Kampala 3.74
9 Zambia Lusaka 3.17
10 Zimbabwe Harare 1.75
a Urban agglomeration with 750,000 or more inhabitants in 2009 (United Nations Population Division 2010)
b
Results
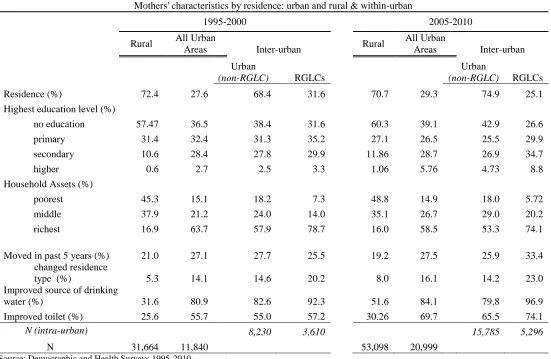
Table 3 shows the mean values or proportion of the variables used in the analysis
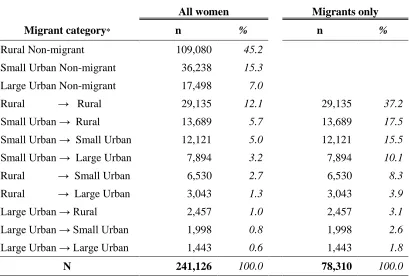
for the pooled sample for both time periods combined. Just under a third of respondents
live in urban areas, and approximately one-third of these live in the RGLCs. About 20-30
per cent of all respondents have moved in the five years before the survey in both
periods, with recent migrants making up a higher proportion of respondents in urban
areas. Migrants who have changed their place of residence (e.g. from a smaller urban area
to an RGLC) account for 9 per cent and 14 per cent of all respondents in the first and
second survey periods, respectively – small but not negligible proportions.
Approximately twice the proportion of respondents in urban compared to rural areas has
Table 3: Descriptive statistics by mothers' residence type for ten sub-Saharan African countries
Mothers' characteristics by residence: urban and rural & within-urban
1995-2000 2005-2010
Rural All Urban
Areas Inter-urban Rural
All Urban
Areas Inter-urban
Urban
(non-RGLC) RGLCs
Urban
(non-RGLC) RGLCs
Residence (%) 72.4 27.6 68.4 31.6 70.7 29.3 74.9 25.1
Highest education level (%)
no education 57.47 36.5 38.4 31.6 60.3 39.1 42.9 26.6
primary 31.4 32.4 31.3 35.2 27.1 26.5 25.5 29.9
secondary 10.6 28.4 27.8 29.9 11.86 28.7 26.9 34.7
higher 0.6 2.7 2.5 3.3 1.06 5.76 4.73 8.8
Household Assets (%)
poorest 45.3 15.1 18.2 7.3 48.8 14.9 18.0 5.72
middle 37.9 21.2 24.0 14.0 35.1 26.7 29.0 20.2
richest 16.9 63.7 57.9 78.7 16.0 58.5 53.3 74.1
Moved in past 5 years (%) 21.0 27.1 27.7 25.5 19.2 27.5 25.9 33.4
changed residence
type (%) 5.3 14.1 14.6 20.2 8.0 16.1 14.2 23.0
Improved source of drinking
water (%) 31.6 80.9 82.6 92.3 51.6 84.1 79.8 96.9
Improved toilet (%) 25.6 55.7 55.0 57.2 30.26 69.7 65.5 74.1
N (intra-urban) 8,230 3,610 15,785 5,296
N 31,664 11,840 53,098 20,999
Graphs 1 & 2: Kaplan-Meier survival estimates by residence for ten sub-Saharan African countries : 1995-2000 and 2005-2010
Source: Demographic and Health Surveys (1995-2010); calculations by author
Table 4: Changes in under-5 survival estimates by residence type in ten sub-Saharan African countries
Time Period Rural Urban
(Non-RGLC) RGLC
1995-2000 0.847 0.878 0.897
2005-2010 0.867 0.895 0.923
Difference 0.020 0.016 0.025
Percentage change
(Period 1 to Period 2) 2.33% 1.93% 2.92%
Source: Demographic and Health Surveys (1995-2010); calculations by author
0 .8 4 0 .9 0 0 .9 5 1 .0 0
0 12 24 36 48
Age in months
Rural Non-RGLC Urban RGLC
Kaplan-Meier Survival Estimates to Age 5: 1995-2000
0 .8 4 0 .9 0 0 .9 5 1 .0 0
0 12 24 36 48
Age in months
Rural Non-RGLC Urban RGLC
Kaplan-Meier Survival Estimates
Kaplan-Meier survival curves for data pooled at the regional level are displayed
for both periods (Graphs 1 and 2) and show clear overall improvements for all residence
types. However, there are differences in the rates at which these improvements have
occurred: they are greatest in RGLCs (2.92 per cent), followed by rural areas (2.33 per
cent) and slowest among non-RGLC urban areas (1.93 per cent) (Table 4).
Urban-Rural Dichotomy
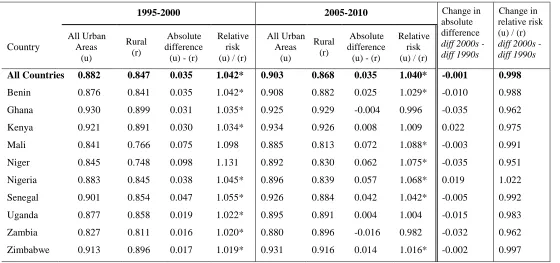
Table 5 shows probabilities of surviving to age 5 for the rural and urban
dichotomy at the aggregate and country-specific levels. Average under-5 survival
chances have improved noticeably across the board between the two time periods.
Increase in survival estimates for both urban and rural areas are practically universal,
with the exceptions of urban Ghana and rural Nigeria which show slight declines. At the
regional level, the urban under-5 survival advantage remains virtually unchanged,
decreasing in absolute terms by only 0.001.
There is substantial variation among countries in both survival probabilities and
changes in the differential. Rural survival chances range from as low as 0.748 in rural
Niger in the earlier period to 0.934 for urban Kenya in the second. The likelihood of
surviving to age 5 is higher for urban than rural residents in all countries in both periods,
with the exceptions of Ghana and Zambia which both have higher under-5 survival
significant for both periods for the pooled data at the regional level and for the majority
of the individual countries in each period.
Countries are fairly evenly split between those whose urban advantages have
narrowed and those whose have widened: of the ten countries, six show a decline in the
urban advantage (Benin, Ghana, Niger, Senegal, Uganda and Zambia) and four have an
increase (Kenya, Mali, Nigeria and Zimbabwe). The two countries with the largest
changes in the urban advantage, Ghana and Niger, showed declines in the advantage.
Ghana’s declining urban advantage may be particular to its unusually high under-5
survival for RGLCs in the earlier period and its subsequent decline (see page 16 below).
Niger’s narrowing urban advantage, on the other hand, appears to be a positive outcome
of substantial gains in child survival with greater improvements in rural survival rates.
Niger’s experience is more indicative of the general pattern in countries with declines in
the urban advantage that resulted from greater increases in rural under-5 survival, rather
Table 5: Kaplan-Meier survival estimates to age five for ten sub-Saharan African countries by urban/rural residence
1995-2000 2005-2010 Change in absolute difference
diff 2000s - diff 1990s
Change in relative risk (u) / (r)
diff 2000s -diff 1990s Country All Urban Areas (u) Rural (r) Absolute difference
(u) - (r)
Relative risk (u) / (r)
All Urban Areas (u) Rural (r) Absolute difference (u) - (r)
Relative risk (u) / (r)
All Countries 0.882 0.847 0.035 1.042* 0.903 0.868 0.035 1.040* -0.001 0.998
Benin 0.876 0.841 0.035 1.042* 0.908 0.882 0.025 1.029* -0.010 0.988
Ghana 0.930 0.899 0.031 1.035* 0.925 0.929 -0.004 0.996 -0.035 0.962
Kenya 0.921 0.891 0.030 1.034* 0.934 0.926 0.008 1.009 0.022 0.975
Mali 0.841 0.766 0.075 1.098 0.885 0.813 0.072 1.088* -0.003 0.991
Niger 0.845 0.748 0.098 1.131 0.892 0.830 0.062 1.075* -0.035 0.951
Nigeria 0.883 0.845 0.038 1.045* 0.896 0.839 0.057 1.068* 0.019 1.022
Senegal 0.901 0.854 0.047 1.055* 0.926 0.884 0.042 1.042* -0.005 0.992
Uganda 0.877 0.858 0.019 1.022* 0.895 0.891 0.004 1.004 -0.015 0.983
Zambia 0.827 0.811 0.016 1.020* 0.880 0.896 -0.016 0.982 -0.032 0.962
Zimbabwe 0.913 0.896 0.017 1.019* 0.931 0.916 0.014 1.016* -0.002 0.997
* Difference between urban and rural survival estimates we significant at the .05 level
Table 6: Kaplan-Meier survival estimates to age five for ten sub-Saharan African countries by urban residence
1995-2000 2005-2010 Change in
absolute difference diff 2000s -
diff 1990s
Change in relative
risk (r) / (o) diff 2000s -diff 1990s Country Rapidly-growing large cities (RGLCs) RGLCs (rg) Other Urban (o) Absolute difference
(rg) - (o)
Relative risk (rg)/(o) RGLCs (rg) Other Urban (o) Absolute difference
(rg) - (o)
Relative risk (rg)/(o)
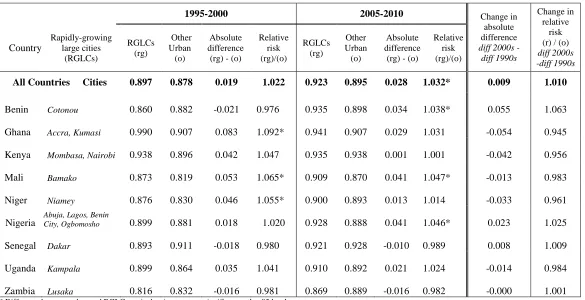
All Countries Cities 0.897 0.878 0.019 1.022 0.923 0.895 0.028 1.032* 0.009 1.010
Benin Cotonou 0.860 0.882 -0.021 0.976 0.935 0.898 0.034 1.038* 0.055 1.063
Ghana Accra, Kumasi 0.990 0.907 0.083 1.092* 0.941 0.907 0.029 1.031 -0.054 0.945
Kenya Mombasa, Nairobi 0.938 0.896 0.042 1.047 0.935 0.938 0.001 1.001 -0.042 0.956
Mali Bamako 0.873 0.819 0.053 1.065* 0.909 0.870 0.041 1.047* -0.013 0.983
Niger Niamey 0.876 0.830 0.046 1.055* 0.900 0.893 0.013 1.014 -0.033 0.961
Nigeria Abuja, Lagos, Benin City, Ogbomosho 0.899 0.881 0.018 1.020 0.928 0.888 0.041 1.046* 0.023 1.025
Senegal Dakar 0.893 0.911 -0.018 0.980 0.921 0.928 -0.010 0.989 0.008 1.009
Uganda Kampala 0.899 0.864 0.035 1.041 0.910 0.892 0.021 1.024 -0.014 0.984
Zambia Lusaka 0.816 0.832 -0.016 0.981 0.869 0.889 -0.016 0.982 -0.000 1.001 * Difference between urban and RGLC survival estimates were significant at the .05 level
Rapidly-growing large cities and other urban areas
Table 6 displays Kaplan-Meier estimates of survival to age 5 within urban areas
only. The RGLC survival advantage over other urban areas has increased over the two
periods by .009, or just less than one per cent, with a change in the relative risk between
the first and second period of 1.01. The log-rank test for equality was significant for both
periods for the pooled data at the regional level but only for three of the ten individual
countries in each period. The improvement is only slight but is both greater in magnitude
than and in the opposite direction from the change in the urban/rural differential.
In general, under-5 survival rates are higher in RGLCs than in other urban areas.
Only Senegal and Zambia have lower under-5 survival rates in RGLCs than in other
urban areas in both periods, and Benin for the first period only. There is again variation in
changes to the RGLC advantage at the country level. Four countries (Benin, Nigeria,
Senegal, Uganda) show a slight widening in the RGLC survival advantage, while the
other five (Ghana, Kenya, Mali, Niger, and Zambia) show a narrowing of this advantage.
The largest change is the substantial increase for Benin, which transitioned from an
RGLC penalty to an advantage. The second largest change is for Ghana, with a reversal
of its RGLC advantage, though this may be a unique case. Ghana’s RGLC under-5
survival estimate in the first period, at 0.990, was substantially higher than for any other
country and at an a highly unusual rate for SSA; in the second period, its RGLC survival
estimate had declined to 0.940, more in line with other countries in the region and now
not have a strong influence on aggregate rates as calculating both Kaplan-Meier estimates
and Cox models without Ghana had no discernible impact on regional estimates. The next
two biggest changes at the country level, for Mali and Niger, are more typical of the
majority of countries with a decline in the advantage, due to greater relative
improvements in more disadvantaged areas (here, non-RGLC urban areas compared to
RGLCs), rather than an indication of stalling or worsening survival chances in previously
advantaged areas.
Cox Proportional Hazards Models
Results from Cox proportional hazard models show whether the urban child
health advantage persists after adjusting for individual and household level
characteristics. The parallel shape of the Kaplan-Meier under-5 survival curves by
residence in Graphs 1 and 2, with only minimal crossover of the urban/RGLC curves in
the first couple of months, indicates that the proportional hazards assumption is
Table 7: Cox proportional hazards model for survival to age 5 for ten sub-Saharan African countries from 1995 to 2010
Model 1 Model 2 Model 3 Model 4 Model 5
Residence (ref: rural)
Urban 0.762*** 0.778*** 0.842*** 0.860*** 0.847***
RGLCs 0.629*** 0.658*** 0.755*** 0.787*** 0.772***
Mother's age at birth (ref: 20-35)
<20 years 1.328*** 1.247*** 1.245*** 1.243***
>35 years 1.275*** 1.220*** 1.223*** 1.225***
Short birth interval (<24 mo.) 1.700*** 1.686*** 1.694*** 1.686***
First born 1.108*** 1.180*** 1.183*** 1.179***
Mother's education (ref: no education)
Primary 0.900*** 0.898*** 0.901***
Secondary 0.722*** 0.726*** 0.728***
Higher 0.466*** 0.458*** 0.462***
Wealth (ref: poorest third)
Middle third 0.980 0.973 0.971
Richest third 0.879*** 0.880*** 0.871***
Water source (ref: unimproved) 0.926*** 0.957
Toilet type (ref: unimproved) 0.959 0.983
Later time period (2005-2010) 0.882***
Country-level fixed
effects Y Y Y Y Y
N 184,206 184,204 183,155 178,182 178,183
Exponentiated coefficients; * p<.05, ** p<.01, *** p<.001
aSource: Demographic and Health Surveys 1995-2010 (Benin, Ghana, Kenya, Mali, Niger, Nigeria, Senegal, Uganda, Zambia,
Results from the Cox model confirm initial findings from the Kaplan-Meier
survival estimates that showed an aggregate urban child survival advantage – and one
that is most pronounced in RGLCs. Table 7 shows results for the pooled sample for all
three residence types at both time periods. When only residence is included in the model,
living in RGLCs and other urban areas decreases the hazard of dying before age five by
37 per cent and 24 per cent, respectively. The hazard is attenuated but does not disappear
after controlling for all covariates.
As would be expected, children who were born to mothers at higher-risk ages,
born after a short interval, or who are firstborns have a greater relative risk of dying
before the age of five. The relative risk ratios for these variables change only slightly
when the socioeconomic covariates are added. Mother’s education is strongly and
monotonically associated with improved child survival chances. The association of
wealth and child survival is not as straightforward nor as strong as that for education:
children who live in households in the richest third are approximately 12 per cent more
likely to reach age five than those in the poorest third, but there is no significant
difference in survival chances between the middle and poorest third. Access to an
improved source of drinking water decreases the hazard of dying before age 5 by about 7
per cent, but become insignificant when controlling for the time period, and toilet type is
not statistically significant in either model.
The dummy variable for time period confirms the upward trend in child survival
approximately 12 per cent more likely to reach their fifth birthday. Even after including
all variables in the full model, children in RGLCs and those in other urban areas have a
hazard of dying before age five that is approximately 23 per cent and 15 per cent less,
respectively, than their rural counterparts. An interaction term for both time periods and
all residence types (rural, urban or RGLC) was also included in the full model but was
not statistically significant, suggesting that while differences in the under-5 survival
advantage by residence types are significant in both periods, changes to the differential
between the two periods are not.
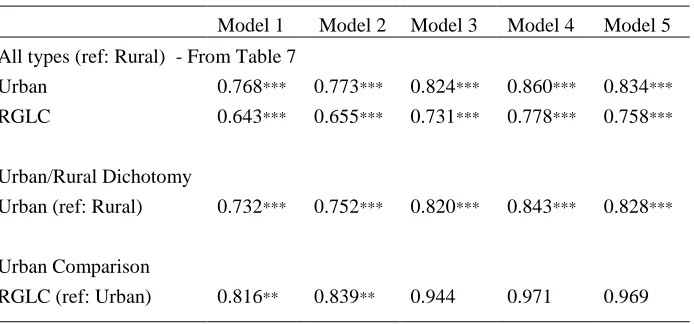
Table 8: Cox proportional hazards models for survival to age 5 by resident type dichotomies for ten sub-Saharan African countries
Model 1 Model 2 Model 3 Model 4 Model 5
All types (ref: Rural) - From Table 7
Urban 0.768*** 0.773*** 0.824*** 0.860*** 0.834***
RGLC 0.643*** 0.655*** 0.731*** 0.778*** 0.758***
Urban/Rural Dichotomy
Urban (ref: Rural) 0.732*** 0.752*** 0.820*** 0.843*** 0.828***
Urban Comparison
RGLC (ref: Urban) 0.816** 0.839** 0.944 0.971 0.969
Exponentiated coefficients; * p<.05, ** p<.01, *** p<.001 Model 1: Residence only
Model 2: Adds age at birth, length of birth interval and parity Model 3: Adds education and household wealth
Model 4: Adds access to improved water and toilet
Model 5: Controls for time period (reference: early period 1995-2000)
Table 8 shows the full Cox model for the urban/rural dichotomy (with both
comparison (RGLCs compared to all other urban areas). It shows that the urban
advantage over rural areas is significant across all models, and that in full model urban
children are still approximately 17 per cent more likely to reach age five than their rural
counterparts. The RGLC advantage over other urban areas is significant only in the first
two models but becomes insignificant once socio-economic variables are added,
suggesting that the intra-urban difference is largely compositional.
Discussion
This analysis finds that the urban under-5 survival advantage in SSA holds.
Overall under-5 survival probabilities in the region mirror the hierarchy of city size:
survival chances are highest in the largest and fastest growing cities, next highest in other
urban areas, and lowest in rural areas. Nearly every country shows fairly substantial
improvements in child survival across both urban and rural areas. These findings concur
with the most recent research on SSA’s child survival differential (Gunther and Harttgen
2012) which also found a positive trend in raw estimates of rural child survival from the
1990s and 2000s. Among the largest and fastest-growing cities, there were notable
increases in under-5 survival probabilities for all but one country (Ghana), implying that
more rapid rates of urban growth are not necessarily associated with declines, stalls or
relatively slower increases in under-5 survival chances – at least for the fastest-growing
largest cities.
At the regional level, the urban survival advantage over rural areas holds and