R E S E A R C H A R T I C L E
Open Access
Predictors of early life milestones: Results
from the Copenhagen Perinatal Cohort
Trine Flensborg-Madsen
1,2*, Marie Grønkjær
1and Erik Lykke Mortensen
1,2Abstract
Background:Pre- and postnatal factors have been found to be predictors of age at attaining milestones in infancy; however, the degree to which such factors are predictors of milestones in the subsequent years is less investigated. The aim was to conduct a systematic evaluation of a broad range of possible predictors of milestone attainment during the second and third years to identify factors that explain significant inter-individual variance.
Methods:Mothers of 4009 children from the Copenhagen Perinatal Cohort (1959–61) were interviewed by a physician about 20 developmental milestones at a three-year examination. Milestones were related to: Language, Walking, Eating, Dressing, Social interaction, and Toilet training. Information on possible predictors was collected during pregnancy and at a 1- and 3-year follow-up.
Results:Several pre- and postnatal factors were significantly associated with the timing of milestone attainment; especially parental social status, paternal age, sex, gestational age, birth weight, birth length, weight increase in the first year of life, and motor development during the first year of life. The significant predictors explained 16.2% of the variance in the Overall mean of milestones and 20.3% of the variance in milestones related to Walking. The most influential individual factor for the timing of milestone attainment was previous motor development during the first year of life. Additionally, sex was an important factor as girls were generally faster at attaining milestones. Parental social status was a consistent, but relatively week predictor.
Conclusion:A notable amount of variance in the timing of milestones during the first three years of life can be explained by perinatal and early postnatal factors. The study provides evidence of developmental continuity as the main predictor of milestones in the second and third years was the speed of development during the first year.
Keywords:Developmental milestones, Family background, Pregnancy and delivery, Postnatal factors, Postnatal growth, Birth cohort, Longitudinal study
Background
During the course of the child’s first three years of life, notable developments occur in both fine and gross motor development as well as in language acquisition. Although age ranges for children’s attainment of mile-stones have been suggested, several studies have shown wide variations in the age of attainment of developmen-tal milestones even in healthy children [1]. Even within the normal range, early attainment of several develop-mental milestones has been shown to be associated with beneficial outcomes later in life. Thus, previous research
suggests that higher age at attainment of motor develop-ment is negatively associated with intelligence and cog-nitive function in both childhood and adulthood [2–8]
as well as with higher neuroticism [9], anxiety and
depression symptoms [10], and with psychiatric
disor-ders, especially schizophrenia and alcohol use disorders [11–13]. Likewise, higher age at attainment of language milestones has been found to be predictive of lower intelligence in childhood [14,15] as well as in adulthood [3, 16,17] in addition to cognitive difficulties in general [8, 15, 18–20], attention and externalizing problems [21], and schizophrenia [22].
While the importance of developmental milestones is acknowledged for several outcomes, studies investigating potential predictors of the timing of these milestones are
© The Author(s). 2019Open AccessThis article is distributed under the terms of the Creative Commons Attribution 4.0 International License (http://creativecommons.org/licenses/by/4.0/), which permits unrestricted use, distribution, and reproduction in any medium, provided you give appropriate credit to the original author(s) and the source, provide a link to the Creative Commons license, and indicate if changes were made. The Creative Commons Public Domain Dedication waiver (http://creativecommons.org/publicdomain/zero/1.0/) applies to the data made available in this article, unless otherwise stated. * Correspondence:tfma@sund.ku.dk
limited and mainly focus on language development. It has been found that especially socioeconomic status [23]
and maternal education [24–26] is associated with
language development, and additionally, girls have been found to generally attain language milestones faster than boys [24,26]. However, early developmental factors such as gestational age [27–29] and low birth weight [30–32] have also been found to be associated with later attain-ment of language milestones. For postnatal factors, focus has especially been on parental factors, including the
home environment [33–35] and emphasizes maternal
re-sponsiveness [36, 37] as an important predictor of
language development. Finally, there have been studies of developmental continuity showing that the timing of earlier motor developmental milestones may be a good predictor of the attainment of language milestones [3,38].
In a previous study, based on the Copenhagen Peri-natal Cohort (CPC), a systematic evaluation of predictors of milestone attainment in the first year of life was con-ducted. This study found that predictors related to preg-nancy and delivery such as birth weight and gestational age explained the largest proportion of variance in mile-stone attainment and that milemile-stones attained during the first months of life to a larger extent could be explained by these factors than later milestones [39]. These find-ings raise questions concerning predictors of develop-ment during the second and third year of life because development during this period is substantially later than early perinatal predictors and because of the increasingly complex behaviour during this period. Thus, behavioural milestones achieved during the first year of life primarily reflect motor development while later milestones in-creasingly reflect cognitive and language development. This change could lead to changes in the important pre-dictors—for example, parental social status was found to be a relatively weak and inconsistent predictor of mile-stones during the first year of life while this variable is expected to be associated with the child’s cognitive and language development. Similarly, sex differences would be expected with regards to language development, while a previous study of motor development during the first year observed no sex differences [23].
While the vast majority of studies on predictors of milestone development focused specifically on lan-guage development, no studies have compared predic-tion of other developmental milestones that appear at the same age as language milestones, such as for example milestones related to gross and fine motor development, eating skills, toilet skills and social inter-action. Hence, the investigated predictors represent only a small fraction of possible predictors hypothe-sized to be associated with behavioural development and the timing of milestones, leaving many potential predictors unexplored.
The primary objective of the study was to conduct a sys-tematic evaluation of a broad range of possible predictors of milestone attainment during the second and the third years of life. While a previous study found factors related to pregnancy and delivery to be the most important predictors [39], we expected factors related to family background and postnatal factors to have stronger influence on development during the second and third years of life.
Methods
Study sample
The study sample comprises members from the
Copenhagen Perinatal Cohort (CPC) which consists of 9125 children born to 8949 mothers at the Copenhagen University Hospital between 1959 and 1961. Admittance was based on area of residence (Copenhagen), but some were referred due to obstetrical complications or single mother status. When the cohort was established, demo-graphic, socioeconomic, prenatal, and postnatal data were recorded prospectively during pregnancy, at delivery, at a 1-year follow-up, and at a 3-year follow-up. Detailed descriptions of the data collection can be found elsewhere [40]. A total of 8395 infants survived the first month after birth and of these, information on at least one develop-mental milestone was available for 4120 individuals, but 111 multiples were excluded since data for twins and triplets are not statistically independent. The final sample thus included 4009 singletons (2047 boys and 1962 girls).
Developmental milestones
At the 3-year follow-up assessment, the mothers were interviewed and asked to retrospectively recall the child’s age at attaining 20 developmental milestones. Descrip-tive information on the 20 developmental milestones is
shown in Table 1. The rate of missing data on each
milestone varied from 4.8% (walking) to 49.0% (turning head in the right direction). To be able to conduct a principal component analysis of all 20 milestones, the
expectation–maximization (EM) algorithm was used to
construct a dataset with missing milestone data replaced by imputed data. The first six components explained 71% of the variance, and both varimax and promax rotation defined the following six factors: Language
(milestones 1–6), Walking (milestones 7–8), Eating
(milestones 9–10), Dressing (milestones 11–12), Social
interaction (milestones 13–17), and Toilet training
factor means and the Overall mean were re-standardized to a mean of 0 and a standard deviation of 1. Data could be missing for one or more milestones included in a milestone mean, and in these cases the mean of the available milestone scores was calculated. If scores on all milestones included in a mean were missing, the corre-sponding mean was scored as missing. Since the study sample only included individuals with data available for at least one milestone, there were no missing data on the Overall mean of milestones..
Predictor variables
For comparison reasons, we primarily included variables that were also included in the previous study of predic-tors of 1-year milestones [39] and added variables de-scribing growth and development during the second and third years. We also used the same categorization of po-tential predictor variables in four domains. Descriptive information on each potential predictor variable is found in Table2.
Family background
Parental social status was based on the social grouping of the Centre International de l’Enfance [41] and was assessed at the 1-year examination on a 1 to 8 point scale (with 8 being the highest). The score is based on a combination of the following four factors: A) the occu-pation of the breadwinner; B) the way in which the breadwinner earns his/her wages (public relief, daily wage, weekly wage, monthly salary and own business or capital); C) the education of the breadwinner; and D) the character of the living accommodation (its size, the
number of persons per room, its position, etc.) [42].
Parity,maternal age,paternal age,andsingle mother sta-tus prenatallywere obtained from interviews by physician, A. L. Villumsen [43] who interviewed all the women.
Pregnancy and delivery
The following variables were obtained from the hos-pital records: Sex of the child, gestational age, birth weight, birth length, and head circumference at birth.
Table 1Developmental milestones (specified in months) from the Copenhagen Perinatal Cohort
Composite milestone means:
Developmental milestones Description N Mean
(SD)
Range
LANGUAGE 1.‘Turning head in the right direction’ The child can turn his/her head in the right“direction” if you e.g. say: where is“mom”,“dad”,“the light”etc.
2045 12.3 (4.6) 3–30
2.‘Naming objects/animals’ The child can name a few, familiar objects or animals with their true names
2695 18.1 (5.5) 9–34
3.‘Naming objects/animals in pictures’ The child can name a few, familiar objects or animals in pictures with their true names
2662 20.0 (5.6) 10–36
4.‘Forming a sentence’ The child can put at least three words together to form a“sentence”
2827 22.9 (5.2) 12–36
5.‘Speaking properly’ The child can speak properly 2201 28.6 (5.1) 16–36 6.‘Sharing experiences’ The child can talk about what it has experienced 2892 28.9 (4.6) 18–36 WALKING 7.‘Walking’ The child can walk around unassisted in the living room 3815 13.8 (2.7) 9–24
8.‘Climbing stairs’ The child can climb stairs unassisted 3323 21.1 (5.3) 11–36 EATING 9.‘Drinking from cup’ The child can drink from a cup without assistance 3370 17.5 (4.6) 7–30
10.‘Eating with spoon’ The child can eat with a spoon without assistance 3407 20.1 (5.0) 10–36 DRESSING 11.‘Putting on socks’ The child can put socks on by itself 2577 28.9 (5.4) 14–36 12.‘Doing buttons’ The child can do buttons 2536 29.9 (5.0) 18–36 SOCIAL INTERACTION 13.‘Building tower’ The child can build a tower of 4–5 ordinary rectangular
blocks
2575 20.5 (5.8) 10–36
14.‘Helping at home’ The child shows interest in helping at home by imitating parents (e.g. by laying the table or other domestic tasks)
3446 24.5 (5.6) 13–36
15.‘Picking up things’ The child can pick up things in the apartment if requested
3304 22.6 (5.7) 12–36
16.‘Playing with peers’ The child plays with children of the same age (e.g. rolling a ball to each other)
2866 20.8 (5.8) 10–36
17.‘Distinguishing boys and girls’ The child can distinguish between boys and girls 2283 27.0 (5.5) 15–36 TOILET TRAINING 18.‘Bowel control’ The child can tell when it needs to defecate 3493 24.9 (6.0) 12–36
19.‘Dry during the day’ The child is dry during the day and tells when it needs to go to the toilet
3514 25.6 (5.9) 12–36
Mother’s smoking in last trimester and her attitude towards the pregnancy were obtained from interviews with the mother.
Postnatal factors
Information on breastfeeding, mother’s employment,
institutionalization of the child, and daycare institution
during the first year were obtained from the 1-year follow-up examination of the child.
Postnatal growth and development
Weight,length, andhead increase during the first year of
life were derived from the delivery and the 1-year
follow-up measures. Weight, length, and head increase
from age one to three were calculated from the 1-year
and the 3-year follow-up measures. Finally, the overall mean of the 1-year milestones analyzed previously [39] was included as a predictor to investigate developmental continuity between the first year and the following two years. The 12 motor milestones included in the Overall 1-year mean are described in detail elsewhere [2,39].
Data analysis
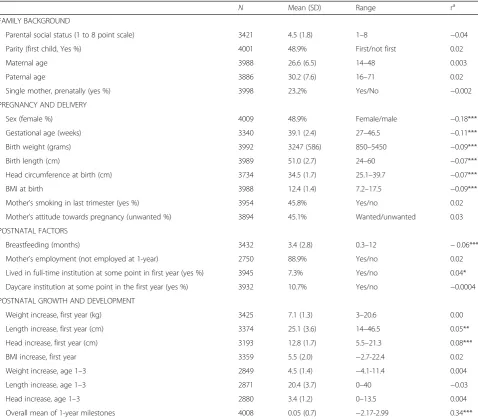
To evaluate bivariate associations between each potential predictor and the Overall mean of milestones, Pearson correlations were used. The rate of missing data on each potential predictor varied from 0% (sex) to 31.4% (mother’s employment), and the rate of missing data on the milestone outcome means varied from 0% (Overall milestone mean) to 25% (Dressing mean). Due to
Table 2Potential predictors from the Copenhagen Perinatal Cohort and associations with the Overall mean of milestones
N Mean (SD) Range ra
FAMILY BACKGROUND
Parental social status (1 to 8 point scale) 3421 4.5 (1.8) 1–8 −0.04
Parity (first child, Yes %) 4001 48.9% First/not first 0.02
Maternal age 3988 26.6 (6.5) 14–48 0.003
Paternal age 3886 30.2 (7.6) 16–71 0.02
Single mother, prenatally (yes %) 3998 23.2% Yes/No −0.002
PREGNANCY AND DELIVERY
Sex (female %) 4009 48.9% Female/male −0.18***
Gestational age (weeks) 3340 39.1 (2.4) 27–46.5 −0.11***
Birth weight (grams) 3992 3247 (586) 850–5450 −0.09***
Birth length (cm) 3989 51.0 (2.7) 24–60 −0.07***
Head circumference at birth (cm) 3734 34.5 (1.7) 25.1–39.7 −0.07***
BMI at birth 3988 12.4 (1.4) 7.2–17.5 −0.09***
Mother’s smoking in last trimester (yes %) 3954 45.8% Yes/no 0.02
Mother’s attitude towards pregnancy (unwanted %) 3894 45.1% Wanted/unwanted 0.03 POSTNATAL FACTORS
Breastfeeding (months) 3432 3.4 (2.8) 0.3–12 −0.06***
Mother’s employment (not employed at 1-year) 2750 88.9% Yes/no 0.02
Lived in full-time institution at some point in first year (yes %) 3945 7.3% Yes/no 0.04*
Daycare institution at some point in the first year (yes %) 3932 10.7% Yes/no −0.0004
POSTNATAL GROWTH AND DEVELOPMENT
Weight increase, first year (kg) 3425 7.1 (1.3) 3–20.6 0.00
Length increase, first year (cm) 3374 25.1 (3.6) 14–46.5 0.05**
Head increase, first year (cm) 3193 12.8 (1.7) 5.5–21.3 0.08***
BMI increase, first year 3359 5.5 (2.0) −2.7-22.4 0.02
Weight increase, age 1–3 2849 4.5 (1.4) −4.1-11.4 0.004
Length increase, age 1–3 2871 20.4 (3.7) 0–40 −0.03
Head increase, age 1–3 2880 3.4 (1.2) 0–13.5 0.004
Overall mean of 1-year milestones 4008 0.05 (0.7) −2.17-2.99 0.34***
a
Pearson correlations were used to evaluate bivariate associations between each predictor and Overall mean of milestones (point-biserial correlation for binary predictors)
*
p< 0.05;**
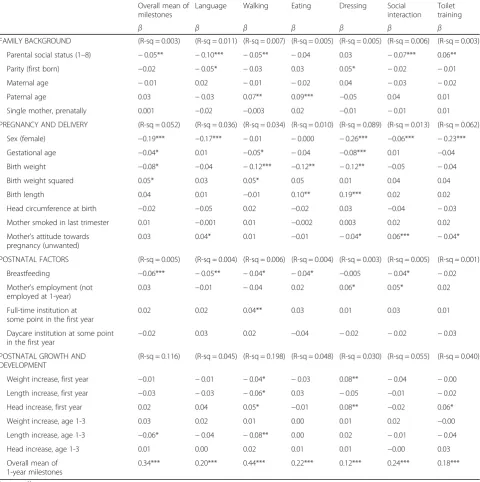
missing data, all subsequent analyses were conducted using Full Information Maximum Likelihood (FIML) analyses [44]. In the FIML analyses, we used structural equation modelling facilities of Stata 14 (College Station, TX: StataCorp LP, USA) to use all available information in each particular analysis. First, multiple linear regres-sion models were conducted for each domain of predic-tors separately (‘family background’, ‘pregnancy and delivery’, ‘postnatal factors’, and ‘postnatal growth’) with each of the seven milestone means as the outcome. In these analyses, all variables in each domain were
in-cluded in the same model (Table 3). BMI was not
included in these regression models to avoid excessive co-linearity of BMI with other covariates related to size. Second, a full regression model was conducted for each milestone mean in which variables with apvalue of 0.10 or below in the domain-specific analyses were included (Table4). An overview of the variance explained by each of the four domains and the full model is shown in Table5.
Preliminary analyses showed that birth weight was quadratically associated with the Overall mean of mile-stones in domain-specific analyses, and consequently quadratic terms were included for this variable. All statistical analyses were conducted usingStata Statistical Software: Release 14 (College Station, TX: StataCorp LP, USA).
Results
The study sample characteristics in Table 2 show that
the sample consisted of 51.1% boys and that the mean birth weight was 3247 g, with a mean weight increase in the first year of 7.1 kg. Almost half of the mothers (45.8%) smoked in the last trimester and the majority of the mothers (88.9%) were not employed when the child was one year of age.
Throughout this study, positive associations imply higher age (slower attainment of milestones) with larger values of the predictor, while negative associations imply faster attainment with larger values of the predictor.
Bivariate correlations
Several potential predictors from the four domains were associated with the Overall mean of milestones in bivariate analyses (Table 2). The strongest correlation (r = 0.34) was observed between the 1-year and 3-year Overall milestone means, and in addition especially variables from the domain ‘pregnancy and delivery’were significantly associated with the Overall 3-year mean of
milestones. Thus, being a girl (r =−0.18), having a
higher gestational age (r =−0.11), a larger birth weight (r =−0.09), a larger birth length (r =−0.07), a larger head
circumference at birth (r =−0.07) and a larger BMI at
birth (r =−0.09) were all significantly associated with
faster attainment of milestones in general. Furthermore, breastfeeding (r =−0.06) and stay at a full-time institution during the first year (r = 0.04) were significant predictors from the domain of ‘postnatal factors’, while length and head increase (r = 0.05 and 0.08) in the first year were significant predictors from the domain‘postnatal growth’.
None of the predictors in the domain of ‘family
back-ground’ were significantly associated with the Overall
mean of milestones.
Predictor domains
Analysing domains of predictors separately in four dif-ferent models for each of the seven means, the patterns
from the bivariate analyses were repeated (Table 3).
Thus, variables from the domain ‘pregnancy and
deliv-ery’ were significantly associated with the seven means; especially sex, gestational age, birth weight, and birth length were found to be associated with later milestone attainment. However, it should be noted that there were no sex differences with regard to Walking and Eating, suggesting that boys and girls are developing similarly in these areas. In the domain of‘family background’, espe-cially parental social status was a significant predictor
(Overall mean: β=−0.05; p ≤0.01), implying faster
attainment of milestones with higher social status. Simi-larly, breastfeeding was a significant variable from the domain of ‘postnatal factors’ (Overall mean: β=−0.06;
p≤0.001), implying faster attainment of milestones with longer duration of breastfeeding. ‘Postnatal growth’ in the first year, especially head increase, was significantly associated with several milestone means with estimates implying that a large increase in head circumference was associated with later attainment of milestones. In con-trast, large weight and height increase was associated with faster attainment of milestones except for an asso-ciation between weight increase and later attainment of Dressing milestones. However, clearly the strongest pre-dictor was the Overall mean of 1-year milestones with highly significant coefficients for all 3-year milestone means and particular strong associations with the Overall 3-year mean and attainment of Walking milestones.
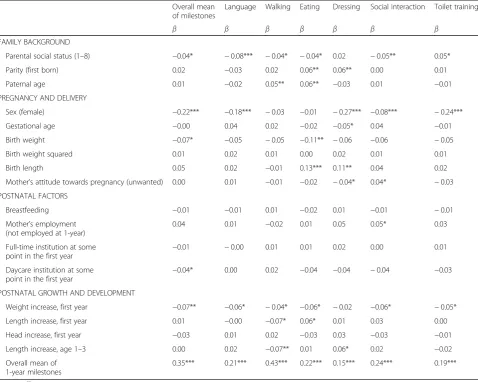
Model of selected predictor variables
The model with selected predictors included variables from the multiple regression models conducted for each
domain of predictors (Table 3) with a pvalue of ≤0.10
of milestones related to Eating and Dressing while higher paternal age was associated with later attainment of milestones related to Walking and Eating.
The strongest pre- and perinatal associations with
milestones were found in the domain ‘pregnancy and
delivery’, where especially female sex was associated with faster attainment of all milestone means except mile-stones related to Walking and Eating. Gestational age was only significantly associated with faster attainment of milestones related to Dressing, while birth weight was related to the Overall mean and faster attainment of
Eating milestones and birth length was significantly associated with later attainment of milestones related to
Eating and Dressing. The mother’s attitude towards
pregnancy (being unwanted) was associated with faster attainment of milestones related to Dressing and later attainment of milestones related to Social interaction.
Most predictors in the domain ‘postnatal factors’
were not associated with any milestone means, but
mother’s unemployment was significantly associated
with later attainment of milestones related to Social interaction, and spending time in a day care institution
Table 3Linear regression analyses of predictor variables and milestone means within predictor domains
Overall mean of milestones
Language Walking Eating Dressing Social interaction
Toilet training
β β β β β β β
FAMILY BACKGROUND (R-sq = 0.003) (R-sq = 0.011) (R-sq = 0.007) (R-sq = 0.005) (R-sq = 0.005) (R-sq = 0.006) (R-sq = 0.003)
Parental social status (1–8) −0.05** −0.10*** −0.05** −0.04 0.03 −0.07*** 0.06**
Parity (first born) −0.02 −0.05* −0.03 0.03 0.05* −0.02 −0.01
Maternal age −0.01 0.02 −0.01 −0.02 0.04 −0.03 −0.02
Paternal age 0.03 −0.03 0.07** 0.09*** −0.05 0.04 0.01
Single mother, prenatally 0.001 −0.02 −0.003 0.02 −0.01 −0.01 0.01
PREGNANCY AND DELIVERY (R-sq = 0.052) (R-sq = 0.036) (R-sq = 0.034) (R-sq = 0.010) (R-sq = 0.089) (R-sq = 0.013) (R-sq = 0.062)
Sex (female) −0.19*** −0.17*** −0.01 −0.000 −0.26*** −0.06*** −0.23***
Gestational age −0.04* 0.01 −0.05* −0.04 −0.08*** 0.01 −0.04
Birth weight −0.08* −0.04 −0.12*** −0.12** −0.12** −0.05 −0.04
Birth weight squared 0.05* 0.03 0.05* 0.05 0.01 0.04 0.04
Birth length 0.04 0.01 −0.01 0.10** 0.19*** 0.02 0.02
Head circumference at birth −0.02 −0.05 0.02 −0.02 0.03 −0.04 −0.03
Mother smoked in last trimester 0.01 −0.001 0.01 −0.002 0.003 0.02 0.02
Mother’s attitude towards pregnancy (unwanted)
0.03 0.04* 0.01 −0.01 −0.04* 0.06*** −0.04*
POSTNATAL FACTORS (R-sq = 0.005) (R-sq = 0.004) (R-sq = 0.006) (R-sq = 0.004) (R-sq = 0.003) (R-sq = 0.005) (R-sq = 0.001)
Breastfeeding −0.06*** −0.05** −0.04* −0.04* −0.005 −0.04* −0.02
Mother’s employment (not employed at 1-year)
0.03 −0.01 −0.04 0.02 0.06* 0.05* 0.02
Full-time institution at some point in the first year
0.02 0.02 0.04** 0.03 0.01 0.03 0.01
Daycare institution at some point in the first year
−0.02 0.03 0.02 −0.04 −0.02 −0.02 −0.03
POSTNATAL GROWTH AND DEVELOPMENT
(R-sq = 0.116) (R-sq = 0.045) (R-sq = 0.198) (R-sq = 0.048) (R-sq = 0.030) (R-sq = 0.055) (R-sq = 0.040)
Weight increase, first year −0.01 −0.01 −0.04* −0.03 0.08** −0.04 −0.00
Length increase, first year −0.03 −0.03 −0.06* 0.03 −0.05 −0.01 −0.02
Head increase, first year 0.02 0.04 0.05* −0.01 0.08** −0.02 0.06*
Weight increase, age 1-3 0.03 0.02 0.01 0.00 0.01 0.02 −0.00
Length increase, age 1-3 −0.06* −0.04 −0.08** 0.00 0.02 −0.01 −0.04
Head increase, age 1-3 0.01 0.00 0.02 0.01 0.01 −0.00 0.03
Overall mean of 1-year milestones
0.34*** 0.20*** 0.44*** 0.22*** 0.12*** 0.24*** 0.18***
*
was associated with faster development as reflected in the Overall milestone mean.
In the domain ‘postnatal growth’, weight increase in the first year of life was associated with faster develop-ment, as reflected in significant associations with all milestone means except milestones related to Dressing. Length increase in the first year was significantly asso-ciated with faster attainment of milestones related to Walking and later attainment of milestones related to
Eating. Length increase during the second and third year was also significantly related to faster Walking, but also to later attainment of milestones related to Dressing. However, in this full model the coefficients for the Over-all mean of 1-year milestones were only slightly reduced or actually increased, and thus speed of development during the first year of life remained the main predictor of speed of development during the subsequent two years. The strongest associations were seen for the
Table 4Linear regression analysis of selected predictor variables and milestone means (models include all listed variables)
Overall mean of milestones
Language Walking Eating Dressing Social interaction Toilet training
β β β β β β β
FAMILY BACKGROUND
Parental social status (1–8) −0.04* −0.08*** −0.04* −0.04* 0.02 −0.05** 0.05*
Parity (first born) 0.02 −0.03 0.02 0.06** 0.06** 0.00 0.01
Paternal age 0.01 −0.02 0.05** 0.06** −0.03 0.01 −0.01
PREGNANCY AND DELIVERY
Sex (female) −0.22*** −0.18*** −0.03 −0.01 −0.27*** −0.08*** −0.24***
Gestational age −0.00 0.04 0.02 −0.02 −0.05* 0.04 −0.01
Birth weight −0.07* −0.05 −0.05 −0.11** −0.06 −0.06 −0.05
Birth weight squared 0.01 0.02 0.01 0.00 0.02 0.01 0.01
Birth length 0.05 0.02 −0.01 0.13*** 0.11** 0.04 0.02
Mother’s attitude towards pregnancy (unwanted) 0.00 0.01 −0.01 −0.02 −0.04* 0.04* −0.03 POSTNATAL FACTORS
Breastfeeding −0.01 −0.01 0.01 −0.02 0.01 −0.01 −0.01
Mother’s employment (not employed at 1-year)
0.04 0.01 −0.02 0.01 0.05 0.05* 0.03
Full-time institution at some point in the first year
−0.01 −0.00 0.01 0.01 0.02 0.00 0.01
Daycare institution at some
point in the first year −
0.04* 0.00 0.02 −0.04 −0.04 −0.04 −0.03
POSTNATAL GROWTH AND DEVELOPMENT
Weight increase, first year −0.07** −0.06* −0.04* −0.06* −0.02 −0.06* −0.05*
Length increase, first year 0.01 −0.00 −0.07* 0.06* 0.01 0.03 0.00
Head increase, first year −0.03 0.01 0.02 −0.03 0.03 −0.03 −0.01
Length increase, age 1–3 0.00 0.02 −0.07** 0.01 0.06* 0.02 −0.02
Overall mean of 1-year milestones
0.35*** 0.21*** 0.43*** 0.22*** 0.15*** 0.24*** 0.19***
*
p< 0.05;**p< 0.01; ***p< 0.001
Table 5Variance in milestone means explained (R2) by models of predictors
R2
Statistical model: Overall mean of milestones Language Walking Eating Dressing Social interaction Toilet training
Family background 0.003 0.011 0.007 0.005 0.005 0.006 0.003
Pregnancy and delivery 0.052 0.036 0.034 0.010 0.089 0.013 0.062
Postnatal factors 0.005 0.004 0.006 0.004 0.003 0.005 0.001
Postnatal growth and development 0.116 0.045 0.198 0.048 0.030 0.055 0.040
Overall 3-year milestone mean and for Walking while the weakest association was observed for Dressing.
Explained variance
The final model explained 16.2% of the variance in the
Overall mean of milestones (Table 5). Among the
seven milestone means, the largest variance explained by the final model was for the milestone mean Walking (20.3%), while the smallest variance explained by the final model was for the milestone mean Eating (5.9%).
The domain ‘postnatal growth and development’
con-tributed most of the explained variance for all mile-stone means except for the Dressing and Toilet
Training means where the‘pregnancy and delivery’
do-main explained 8.9 and 6.2% of the variance because of the large sex differences in milestones related to these domains. In fact, sex difference seemed to contribute
substantially to making the ‘pregnancy and delivery’
domain the second largest contributor to explained
variance apart from the‘postnatal growth and
develop-ment’ predictors that directly describe the child’s
growth and behavioural development.
Discussion
The aim of the study was to conduct a systematic evalu-ation of a range of possible predictors of milestone at-tainment during the second and third years of life. We were able to explain 16.2% of the variance in the Overall mean of milestones with a model summarizing the find-ings in the four predictor domains ‘family background’, ‘pregnancy and delivery’, ‘postnatal factors’, and‘ postna-tal growth and development’. This is close to the 18.5% explained variance in a previous study of milestones attained during the first year of life [39], but remarkably, only 6.3% of the variance in 3-year milestones was ex-plained when the Overall 1-year milestone mean was not included in the final model. This suggests that the influence of early life factors such as family background, factors related to pregnancy and delivery and postnatal influences on the child’s behavioural development grad-ually becomes weaker as the child is influenced by envir-onmental factors and develops more complex cognitive, linguistic and social behaviour. In contrast, growth and in particular motor development during the first year becomes a crucial predictor of age of attaining mile-stones during the second and third year of life. Thus, the present study provides evidence of developmental con-tinuity and corroborates studies showing associations be-tween age of attaining motor developmental milestones and later language milestones [3,38].
From the domain ‘family background’, higher
paren-tal social status was found to be associated with faster attainment of milestones related to Language, Walking, Eating, and Social interaction. Parental social status is
in this study defined as a joint measure of both educa-tional and occupaeduca-tional aspects as well as the character of the living accommodation, and the results are therefore in accordance with previous studies showing
that socioeconomic status [23] and maternal education
[24–26] are positively associated with language devel-opment, in particular since we observed the strongest association for milestones related to Language. Cogni-tive and language development are closely related, and in the Copenhagen Perinatal Cohort (CPC), language milestones predict young adult and midlife intelligence [16, 45]. Since the CPC measure of parental social sta-tus is a strong predictor of offspring adult intelligence [46], a relatively strong association between parental social status and Language milestones was expected, but the strength of the association was considerably weaker than the association between sex and Language milestones.
Other studies support our significant finding of faster language development in the firstborn child [24,47]. Re-search on the relationship between father involvement and outcomes in the child has found that fathers may in-fluence various aspects of development, including execu-tive functioning [48, 49]. In this study we found that children of older fathers were significantly later at attain-ing milestones related to Walkattain-ing and Eatattain-ing which may corroborate the previous studies if it is assumed that fathers engage less in the child’s development with in-creasing age. The association between higher paternal age and later motor development was also observed for all 1-year milestones in a previous study [39].
A previous study found that milestone attainment du-ring the first year was primarily predicted by factors re-lated to pregnancy and delivery, and the present findings show that these factors are also important predictors of milestones attained during the second and third year. However, milestones during the first year were predicted by several foetal growth factors such as gestational age, birth weight and head circumference while the primary predictor in the present study was the child’s sex. The present study thus replicated findings showing that girls are significantly faster than boys at attaining mile-stones in general, and especially those related to lan-guage [24,26], toilet training [50] and in our study also milestones related to dressing and social interaction. Thus, the fact that no sex differences were observed with respect to milestones related to Walking and Eating is a remark-able finding. No sex differences were identified in the pre-vious study of motor milestones attained during the first year [39], and the pattern of results suggests that sex differences appear as the child develops more complex abilities and behaviour.
analyses, but a previous study showed that birth weight
was an important predictor of 1-year milestones [39],
and thus effects of birth weight may be partly mediated by the Overall 1-year milestone mean, an assumption supported by the fact that birth weight was significantly associated with all milestones in a model without the Overall 1-year milestones mean as a predictor. Thus, the findings may be in accordance with previous studies showing that low birth weight is a significant predictor of slow milestone attainment, especially those related to language development [30–32]. A large birth length was in this study associated with slower attainment of mile-stones related to Eating and Dressing; this may be ex-plained by poorer fine motor skills with increasing limb length in the first years. The mother’s attitude to the pregnancy was not significant in our previous study [39], and it is difficult to interpret the inconsistent findings for milestones related to Dressing and Social interaction. In this study we did not have variables to describe the level of stimulation and parental responsiveness which in previous studies have been found to be particularly important for language development [33, 36, 37]. This may explain why only few variables from the domain ‘postnatal factors’ were predictors of milestone
attain-ment. However, our results show that the mother’s
un-employment in the first year of life is associated with later attainment of milestones related to Social inter-action and in the domain analyses also milestones re-lated to Dressing. Full-time institutional care was only associated with later attainment of milestones related to Walking in the domain analyses while time in day-care institution was associated with the Overall mean in the final models. In the domain analyses, breastfeeding was associated with the Overall mean and the milestone means Language, Walking, Eating and Social interaction, but all associations became non-significant in the final models. Breastfeeding has previously been shown to be associated with faster attainment of motor milestones during the first year in the CPC [39], and therefore the association with milestones attained during the second and third years may be partly mediated through physical growth and the Overall 1-year milestone mean.
Concerning ‘postnatal growth’, weight increase in the first year was by far the most important predictor of milestone attainment in general. Thus, except for the Dressing mean, a large weight increase in the first year was associated with faster attainment of milestones in all areas. Length increase in both the first and the subse-quent years was associated with faster attainment of milestones related to Walking while length increase in the first year was related to slower attainment of mile-stones related to Eating, and length increase in the sub-sequent years to slower attainment of milestones related to Dressing. The latter is in accordance with the results
showing that birth length is associated with slower at-tainment of milestones related to both Eating and Dress-ing and underlines that motor skills related to gettDress-ing dressed is more difficult with long extremities. A previ-ous study based on the CPC found that weight increase in the first year was associated with faster attainment of all motor-developmental domains in the first year of life [2]. We were, however, not able to locate studies that investigated the effects of physical growth on milestone attainment in the subsequent years after the age of one.
Although the current study sample primarily consisted of essentially healthy infants, the study sample is not representative of the Danish population at the time when the cohort was established. This is because the maternity departments at the Copenhagen University Hospital primarily accepted pregnant women with previ-ous pregnancy complications, pregnant women expected to undergo complicated delivery, and single mothers for whom delivery at home would be inconvenient (at the time of investigation it was a standard procedure to give birth at home) [42]. It is also an open question whether the specific results can be generalized to younger birth cohorts, although we expect that major predictors such as parental social status, sex, and measures of develop-ment during the first year of life would also be signifi-cant in younger generations. A possible limitation of our study is that milestones related to Walking may be attained in both the first and second year of life, and this may explain the high correlation between the Overall 1-year milestone mean and the 3-1-year milestones related to Walking. It is also a limitation that some of our variables were binary codings of complex phenomena
such as mother’s employment and the child’s stay in
full-time and day-care institutions.
The population-based and longitudinal design of the study also provides a number of strengths. Although infor-mation on milestones was retrospectively recalled by the mother at a 3-year follow-up examination of the child, in-formation on predictors was registered prospectively and before this examination. Previous studies have not in-cluded as wide a range of possible predictors and mile-stones from several behavioural domains. However, comparison with a previous study of predictors on
1-year milestones [39] shows that our set of perinatal
predictors explained much less variance in behavioural development during the second and third year than during the first year, and the lack of variables related to the interaction with adults is a considerable
limita-tion. Thus, children’s milestone development can to a
[34,35], maternal responsiveness [36,37], and appropriate play materials as important predictors [34,35].
Finally, the possibility of Type I errors is a limitation because we conducted tests on six milestone means (in addition to the Overall mean of milestones) and 22 pos-sible predictors. However, the fact that our findings are generally in agreement with other studies concerning the importance of the predictors suggests that Type I errors are not a substantial problem.
Conclusion
A total of 16.2% of the variance in the Overall mean of milestones was explained in a final model summarizing the findings from the four domains of predictors:‘Family background’,‘pregnancy and delivery’,‘postnatal factors’,
and ‘postnatal growth and development’. The study
suggests the following conclusions:
First, there is strong evidence of developmental con-tinuity as the main predictor of behavioural milestones during the second and third years was the Overall 1-year milestone mean, reflecting speed of development during the first year of life.
Second, the sex of the child was of major importance for attainment of milestones during the second and third years with girls showing faster development than boys except for milestones related to Walking and Eating.
Third, parental social status predicted faster attain-ment of all milestone means except milestones related to Dressing; the strongest association was for milestones related to Language.
Fourth, weight increase during the first year predicted faster attainment of all milestone means except milestones related to Dressing, while foetal growth and growth during the second and third years showed fewer and sometimes inconsistent associations with milestone development.
Fifth, the current study did not analyse potential me-diation, but effects of predictors of 1-year milestones such as birth weight and duration of breastfeeding may partly be mediated through later growth and develop-ment, in particular the Overall 1-year milestone mean.
Together, such findings may yield an informative screening tool aimed at milestones delay and add valuable knowledge to professionals about how the child’s develop-ment can be affected by family background, pregnancy and delivery, postnatal growth and previous development.
Although we were able to explain up to 16.2% of the variance in timing of milestones within specific domains, our findings show that the major part of the variance in milestone attainment depends on variance in environ-mental or genetic factors other than those incorporated in the four domains in the present study. Thus, more studies are needed to elucidate patterns of these predic-tors and especially to include more variables related to the actual parent-child interaction.
Abbreviation
CPC:Copenhagen Perinatal Cohort
Acknowledgements
We acknowledge the crucial role of AL Villumsen and B Zachau-Christiansen in the establishment of the Copenhagen Perinatal Cohort and thank the Steering Committee for permission to conduct this study.
Authors’contributions
TFM has analysed the data and written the first draft of the manuscript. MG and ELM have critically revised the first draft of the manuscript for important intellectual content. All authors have contributed to the conception and design of the study, the interpretation of data and the final approval of the version to be submitted.
Funding
No funding was given to conduct this study.
Availability of data and materials
The data that support the findings of this study are available from the Steering Committee of the Copenhagen Perinatal Cohort but restrictions apply to the availability of these data, which were used under license for the current study, and so are not publicly available. Data are however available from the authors upon request and with permission of the Steering Committee of the Copenhagen Perinatal Cohort.
Ethics approval and consent to participate
According to Danish regulations, the present study does not require approval by the scientific ethical committee system; see §14, part 2 in the Danish law on the ethical handling of scientific health research (https:// www.retsinformation.dk/Forms/r0710.aspx?id=192671). Mothers and children were included in the CPC as it was standard when admitted at the Copenhagen University Hospital in the given time period from 1959 to 61. A substantial amount of the data used in this study was obtained from regular hospital routines. At the time of data collection almost 60 years ago, no rules of formal consent were applicable. However, the mothers were all given explanations of the investigation, guaranteed confidentiality, and were given the opportunity not to participate to any interview [43]. Additionally, it was voluntary to participate in the follow-ups and a large proportion of the mothers’chose not to do so, whereby they are not included in the present study.
Consent for publication
Not applicable.
Competing interests
The authors declare that they have no competing interests.
Received: 8 July 2019 Accepted: 9 October 2019
References
1. Ertem IO, Krishnamurthy V, Mulaudzi MC, Sguassero Y, Balta H, Gulumser O, et al. Similarities and differences in child development from birth to age 3 years by sex and across four countries: a cross-sectional, observational study. Lancet Glob Health. 2018;6:e279–91.
2. Flensborg-Madsen T, Mortensen EL. Infant developmental milestones and adult intelligence: a 34-year follow-up. Early Hum Dev. 2015;91:393–400. 3. Flensborg-Madsen T, Mortensen EL. Developmental milestones during
the first three years as precursors of adult intelligence. Dev Psychol. 2018;54:1434–44.
4. Hamadani JD, Tofail F, Cole T, Grantham-McGregor S. The relation between age of attainment of motor milestones and future cognitive and motor development in Bangladeshi children. Matern Child Nutr. 2013;9:89–104.
5. Murray GK, Veijola J, Moilanen K, Miettunen J, Glahn DC, Cannon TD, et al. Infant motor development is associated with adult cognitive categorisation in a longitudinal birth cohort study. J Child Psychol Psychiatry. 2006;47:25–9.
7. Piek JP, Dawson L, Smith LM, Gasson N. The role of early fine and gross motor development on later motor and cognitive ability. Hum Mov Sci. 2008;27:668–81.
8. Taanila A, Murray GK, Jokelainen J, Isohanni M, Rantakallio P. Infant developmental milestones: a 31-year follow-up. Dev Med Child Neurol. 2005;47:581–6.
9. Flensborg-Madsen T, Sorensen HJ, Revsbech R, Mortensen EL. Early motor developmental milestones and level of neuroticism in young adulthood: a 23-year follow-up study of the Copenhagen perinatal cohort. Psychol Med. 2013;43:1293–301.
10. Piek JP, Barrett NC, Smith LM, Rigoli D, Gasson N. Do motor skills in infancy and early childhood predict anxious and depressive symptomatology at school age? Hum Mov Sci. 2010;29:777–86.
11. Manzardo AM, Penick EC, Knop J, Nickel EJ, Hall S, Jensen P, et al. Developmental differences in childhood motor coordination predict adult alcohol dependence: proposed role for the cerebellum in alcoholism. Alcohol Clin Exp Res. 2005;29:353–7.
12. Schiffman J, Sorensen HJ, Maeda J, Mortensen EL, Victoroff J, Hayashi K, et al. Childhood motor coordination and adult schizophrenia Spectrum disorders. Am J Psychiatry. 2009;166:1041–7.
13. Sørensen HJ, Mortensen EL, Schiffman J, Reinisch JM, Maeda J, Mednick SA. Early developmental milestones and risk of schizophrenia: a 45-year follow-up of the Copenhagen perinatal cohort. Schizophr Res. 2010;118:41–7. 14. Liao SF, Liu JC, Hsu CL, Chang MY, Chang TM, Cheng H. Cognitive
Development in Children With Language Impairment, and Correlation Between Language and Intelligence Development in Kindergarten Children With Developmental Delay. J Child Neurol. 2014.
15. Silva PA, Williams S, McGee R. A longitudinal study of children with developmental language delay at age three: later intelligence, reading and behaviour problems. Dev Med Child Neurol. 1987;29:630–40.
16. Flensborg-Madsen T, Mortensen EL. Associations of early developmental milestones with adult intelligence. Child Dev. 2018;89:638–48. 17. Young AR, Beitchman JH, Johnson C, Douglas L, Atkinson L, Escobar M,
et al. Young adult academic outcomes in a longitudinal sample of early identified language impaired and control children. J Child Psychol Psychiatry. 2002;43:635–45.
18. Bashir AS, Scavuzzo A. Children with language disorders: natural history and academic success. J Learn Disabil. 1992;25:53–65.
19. Catts HW, Fey ME, Tomblin JB, Zhang X. A longitudinal investigation of reading outcomes in children with language impairments. J Speech Lang Hear Res. 2002;45:1142–57.
20. Stern LM, Connell TM, Lee M, Greenwood G. The Adelaide preschool language unit: results of follow-up. J Paediatr Child Health. 1995;31:207–12.
21. Petersen IT, Bates JE, D'Onofrio BM, Coyne CA, Lansford JE, Dodge KA, et al. Language ability predicts the development of behavior problems in children. J Abnorm Psychol. 2013;122:542–57.
22. Jones P, Rodgers B, Murray R, Marmot M. Child development risk factors for adult schizophrenia in the British 1946 birth cohort. Lancet. 1994;344: 1398–402.
23. Fisher EL. A systematic review and meta-analysis of predictors of expressive-language outcomes among late talkers. J Speech Lang Hear Res. 2017;60: 2935–48.
24. McKean C, Reilly S, Bavin EL, Bretherton L, Cini E, Conway L, et al. Language outcomes at 7 years: early predictors and co-occurring difficulties. Pediatrics. 2017;139.
25. Reilly S, Wake M, Ukoumunne OC, Bavin E, Prior M, Cini E, et al. Predicting language outcomes at 4 years of age: findings from early language in Victoria study. Pediatrics. 2010;126:e1530–7.
26. Rudolph JM. Case history risk factors for specific language impairment: a systematic review and meta-analysis. Am J Speech Lang Pathol. 2017;26: 991–1010.
27. Nguyen TN, Spencer-Smith M, Haebich KM, Burnett A, Scratch SE, JLY C, et al. Language Trajectories of Children Born Very Preterm and Full Term from Early to Late Childhood. J Pediatr. 2018;202:86–91.e1.
28. Nguyen TN, Spencer-Smith M, Zannino D, Burnett A, Scratch SE, Pascoe L, et al. Developmental trajectory of language from 2 to 13 years in children born very preterm. Pediatrics. 2018;141.
29. van Noort-van der Spek IL, Franken MC, Weisglas-Kuperus N. Language functions in preterm-born children: a systematic review and meta-analysis. Pediatrics. 2012;129:745–54.
30. Tenovuo A, Kero P, Korvenranta H, Piekkala P, Sillanpaa M, Erkkola R. Developmental outcome of 519 small-for-gestational age children at the age of two years. Neuropediatrics. 1988;19:41–5.
31. van Noort-van der Spek IL, Franken MC, Wieringa MH, Weisglas-Kuperus N. Phonological development in very-low-birthweight children: an exploratory study. Dev Med Child Neurol. 2010;52:541–6.
32. Stanton-Chapman TL, Chapman DA, Bainbridge NL, Scott KG. Identification of early risk factors for language impairment. Res Dev Disabil. 2002;23:390–405.
33. Desmarais C, Sylvestre A, Meyer F, Bairati I, Rouleau N. Systematic review of the literature on characteristics of late-talking toddlers. Int J Lang Commun Disord. 2008;43:361–89.
34. Elardo R, Bradley R, Caldwell BM. A longitudinal study of the relation of infants' home environments to language development at age three. Child Dev. 1977;48:595–603.
35. Schmerse D, Anders Y, Flöter M, Wieduwilt N, Rofbach H-G, Tietze W. Differential effects of home and preschool learning environments on early language development. Br Educ Res J. 2018;44:338–57.
36. Tamis-Lemonda CS, Bornstein MH, Kahana-Kalman R, Baumwell L, Cyphers L. Predicting variation in the timing of language milestones in the second year: an events history approach. J Child Lang. 1998;25:675–700. 37. Tamis-Lemonda CS, Bornstein MH, Baumwell L. Maternal responsiveness
and children's achievement of language milestones. Child Dev. 2001;72: 748–67.
38. Oudgenoeg-Paz O, Volman MC, Leseman PP. Attainment of sitting and walking predicts development of productive vocabulary between ages 16 and 28 months. Infant Behav Dev. 2012;35:733–6.
39. Flensborg-Madsen T, Mortensen EL. Predictors of motor developmental milestones during the first year of life. Eur J Pediatr. 2017;176:109–19. 40. Zachau-Christiansen B, Ross EM. Babies: human development during the
first year. Oxford: John Wiley; 1975.
41. Graffar M. Social study of samples. Mod Probl Pädiat. 1960;5:30–42. 42. Zachau-Christiansen B. The influence of prenatal and perinatal factors on
development during the first year of life. Helsingør: Poul A. Andersens Forlag; 1972.
43. Villumsen AL. Environmental factors in congenital malformaitons: a prospective cohort study of 9,006 human pregnancies. Copenhagen: FADL's Forlag; 1970.
44. Graham JW. Missing data analysis: making it work in the real world. Annu Rev Psychol. 2009;60:549–76.
45. Flensborg-Madsen T, Mortensen EL. Language development and intelligence in midlife. Br J Dev Psychol. 2019;37:269–83.
46. Mortensen EL, Sorensen HJ, Jensen HH, Reinisch JM, Mednick SA. IQ and mental disorder in young men. Br J Psychiatry. 2005;187:407–15. 47. Zubrick SR, Taylor CL, Rice ML, Slegers DW. Late language emergence at 24
months: an epidemiological study of prevalence, predictors, and covariates. J Speech Lang Hear Res. 2007;50:1562–92.
48. Meuwissen AS, Carlson SM. Fathers matter: the role of father parenting in preschoolers' executive function development. J Exp Child Psychol. 2015;140:1–15.
49. Meuwissen AS, Carlson SM. The role of father parenting in children's school readiness: a longitudinal follow-up. J Fam Psychol. 2018;32:588–98. 50. Rona RJ, Li L, Chinn S. Determinants of nocturnal enuresis in England and
Scotland in the '90s. Dev Med Child Neurol. 1997;39:677–81.
Publisher’s Note