Lincoln
University
Digital
Thesis
Copyright
Statement
The
digital
copy
of
this
thesis
is
protected
by
the
Copyright
Act
1994
(New
Zealand).
This
thesis
may
be
consulted
by
you,
provided
you
comply
with
the
provisions
of
the
Act
and
the
following
conditions
of
use:
you
will
use
the
copy
only
for
the
purposes
of
research
or
private
study
you
will
recognise
the
author's
right
to
be
identified
as
the
author
of
the
thesis
and
due
acknowledgement
will
be
made
to
the
author
where
appropriate
you
will
obtain
the
author's
permission
before
publishing
any
material
from
the
thesis.
Development of algorithms and tools for a decision
support system to assist sheep breeders to design
crossbreeding programs
A thesis
submitted in partial fulfilment
of the requirements for the degree
of
Doctor of Philosophy
at
Lincoln University
New Zealand
by
Wenhua Wei
Lincoln University
New Zealand
Abstract of a thesis submitted in partial fulfilment of the requirements
for the degree of Doctor of Philosophy
Development of algorithms and tools for a decision
support system to assist sheep farmers to design
crossbreeding programs
by Wenhua Wei
Abstract
This study is part of a sheep crossbreeding decision support system (DSS) project that
aimed to provide quality decision oriented information to support NZ sheep breeders make
decisions about appropriate crossbreeding systems. Unlike much 'mainstream' research, this
study is based mainly on data from the published literature, with only limited data being
collected from farm trials. The main objective of the study was to develop useful algorithms
and tools to help with the development of the DSS for the delivery of the quality information.
These algorithms and tools can be categorised into four groups.
The first group was developed for systematically reviewing the published literature,
categorising reported results and collating qualified data. A relational database was developed
to store and manipulate the sheep crossbreeding data, using modem computing technologies and
tools. Crossbreeding data, mainly least squares means (local means) and standard errors (SE)
are organised in the database based on their genotyp~s, traits, sources and environments, to
.
allow easy management and search as well as further genetic analyses. Compatibility with theNZ Sheep Improvement Limited (SIL) database was also considered in the DSS database
development to allow data communication between the two.
The NZ farm class classification, that has been used by NZ Meat and Wool Service for
years to categorise NZ farms based on their topography, soil types, management styles and
regional locations, was chosen as the environmental identifiers of the crossbreeding data to be
collated. It was well recognized that this was a less than perfect classification because by its
and was unable to reflect environmental changes with time. However, this was the closest
environmental classification that could be used to provide useful categories for combining local
results from different trials according to their relevance to particular farming systems, which are
necessary to the development of the other algorithms and tools in this study.
Using this algorithm, literature from sheep crossbreeding studies within NZ from 1972
onwards was reviewed intensively, and identified useful data were collated into the database. It was found that most sheep crossbreeding experiments conducted in NZ to date were
introductory studies, which were unrelated, small in scale, mainly for breed comparisons rather
than explicitly studying heterotic effects. Data from these experiments covered a wide range of
breeds, traits and NZ environments, but were generally sparse. In many cases, for the
performance merit of a genotype for a trait, estimates from different studies were very different
and, consequently, hard to use. Considerable information gaps, not only in the trait
performance of the genotypes under consideration, but also in the heterosis estimates were also
identified from the review. To assist in the study, literature on decision support system
development in agriculture, meta-analysis methodology for data combining and methodology
for estimating crossbreeding effects were also reviewed.
The second group was developed, consequently, for combining the local, replicated
estimates from different studies into generalised means for each available genotype per farm
class. The generalised results, also termed as regional means, are the genotypic effects averaged
across particular farm classes, ignoring specific within-region genotype x environment
interactions, and therefore are applicable to the whole farm class or associated region. The
weighted least squares approach was used in the data combining process, where 1/SEj
2
was used
as the weight for the ith local mean, breed (genotype) and year effect were fitted as factors, and
covariate was used for linear adjustment when necessary. Given insufficient local means in a
number of farm classes, farm class was unable to be fitted as a factor in the analyses, and
consequently the genotype x environment interactioI1 at the farm class level was also ignored.
Using the meta-analysis algorithm, analyses were performed per farm class (if possible)
and the regional means and associated SEs for each available genotype were estimated within
the farm class. These results were to be used in further analyses of crossbreeding effects. From
these analyses, conflicts existing in the published papers were also detected, and research areas
that needed further study were identified as well.
identifiers, within study/trial biases, the year effect factor, the weighting policy of using lISE/,
linear adjustment method when covariate was used, and other unaccountable factors such as
animal age, publication biases. Therefore, the generalised data produced were regarded as
preliminary results, and further work on the process was suggested.
The third group was developed for the estimation of crossbreeding effects based on the
generalised data. A computer program, named HeterosisEstimator, was explicitly developed as
a DSS tool to estimate crossbreeding effects for different crossbreeding plans (models). The
algorithm of analysing a large number of crossbreeding plans, a genetic model that accounted
for additive, dominance and additive x additive epistatic effects, and a statistical routine of
weighted least squares (l/SE2 of each regional mean were used as the weight), were
implemented in the program. Automation mechanisms for reading input data, forming the
relationship matrix, calculating crossbreeding parameters and writing results in specified
Microsoft Excel files, were also implemented in the program, which consequently improved the
speed and efficiency of the estimation analyses considerably.
A large number of estimates of underlying crossbreeding parameters, in particular the
direct and maternal heterosis, was produced from the estimation analyses. These estimates were
based on existing crossbreeding data from the NZ sheep industry which had seldom been reused
before, and therefore should be regarded as increased/extended information. It was found that
for many breed combinations, the estimates of heterotic effects (either direct or maternal) had
ranges of values across different crossbreeding plans, indicating that the ranges rather than
single point values should be used in the following prediction of crossbred performance. It was
also found that maternal heterosis was unable to be estimated for many breed combinations
owing to insufficient input data, which brought uncertainties to the prediction of crossbred
performance. The algorithm and factors that were likely to affect the quality of estimation of
crossbreeding effects were discussed.
The fourth group was to demonstrate how to use the developed simulation algorithms
and model to explore the variations in crossbred performance predictions arising from different
crossbreeding plans and parameter estimates with uncertainties. A simplified dominance model
and quantitative risk analysis concepts and technologies were used in the simulation under a set
of assumptions. Crossbreeding parameter estimates were fitted with normal distribution
functions to cope with uncertainties. The simulation model was built using a Microsoft Excel
add-in program package named @Risk and a predefined design matrix for genotypes under
simulation model and the deviations of the predicted means against the target means were
monitored during simulation to meet a predefined criterion.
The normal distribution functions were inputs to the simulation model. Simulation
started and iterated many times. At the end of each run, sensitivity results of the monitored
variables were analysed and the distribution functions were adjusted accordingly for the next
simulation run. When the criterion was met, the simulation was completed and the simulated
results, including the point values of parameters and predicted performance merits for genotypes
within the current crossbreeding system were produced as part of the information that the DSS
is expected to provide to decision makers. An algorithm to calculate aggregate economic
returns for each genotype and, consequently, the best genotypes within the current system, was
also demonstrated using arbitrary relative economic weights for each trait under consideration.
The simulation algorithms, genetic model, simulation model and issues developed during
simulation and corresponding solutions to them were also discussed.
A general discussion was given about the contributions that this study has made to the
DSS and the NZ sheep industry, the advantages and disadvantages of the algorithms and tools,
and suggestions to further development of the DSS. The major conclusions drawn are: a) This
study has made contributions to improve the understanding of sheep crossbreeding in NZ as a
whole, including the systematic review of published literature and collation of identified results,
the approach for combing local data to allow estimates of underlying crossbreeding parameters
to be obtained, and their incorporation into a simulation model using genetic prediction
algorithms and risk analysis procedures to evaluate variations in crossbred performance
predictions; b) The algorithms and tools developed in this study are important to the DSS and
can be incorporated into the DSS in the future; c) The DSS is a good solution to provide quality
decision oriented information to NZ sheep breeders and help with their crossbreeding practice;
d) Merging the local data into regional means is crucial to the entire study. This is an
open-ended and iterative process, as are the estimation and simulation processes.
Keywords: DSS, information system, database, farm class, sheep crossbreeding, heterosis,
hybrid vigour, crossbreeding parameter, crossbreeding system, additive effect, dominance,
epistasis, user-centred, modelling, meta-analysis, data generalisation, regional mean, use case,
class diagram, weighted least squares, least squares mean, dominance model, eBE,
HeterosisEstimator, algorithm, simulation, @Risk, Quantitative risk analysis, probability
Dedication
Honours and glories go to Lord Jesus Christ only.
Whatever you do, do it heartily as to the Lord and not men.
Colossians 3 :23
Let your light so shine before men, that they may see your good
works and glorify your Father in heaven.
Acknowledgements
I wish to thank my supervisor Dr David Cottle for his guidance, expert supervision,
critique and help during the course of this study.
My thanks extend to my associate supervisors Professor Tony Bywater, Dr Richard
Sedcole and Dr Terry Reid for their excellent supervision, instant support, and warm-hearted
encouragement.
My special thanks go to Dr Peter Maher and Professor Andrew Sykes. Their strong
support and valuable help have kept this thesis alive during the hard times and made it possible
for me to complete a Graduate Diploma in Applied Computing while proceeding with this
study. As my previous associate supervisor, Peter played an important role in coordinating the
supervision team, being continually available, offering valuable face-to-face discussions,
helping with my academic writing and settling a number of issues that occurred during this
time. I am really indebted to him.
Special thanks also go to Dr Clare Churcher, Professors Alan McKinnon and Don
Kulasiri, Drs Wynand Verwood and Chris Frampton, and Sharon Long for their help in the
areas of database development, special statistical analysis methodology, conceptualisation of the
simulation model and choosing the right software to implement the model. This work could not
have been done easily without the necessary computing skills learnt from the staff in the
Applied Computing, Management and Statistics Group at Lincoln University.
Dr J ochen Wolf in Czech Republic kindly provided the CBE program code for this
study, which made the programming much easier. Drs Andy Bray and Roland Sumner at
AgResearch supplied analysed and unpublished crossbreeding data for the study. Drs John
McEwan and Dorian Garrick gave valuable suggestions to the literature review at the beginning
of the study. Drs John McEwan and Scott Newman also provided critical comments on
planning the DSS project and the research at the early stage. Professor Brian Kinghorn
provided the Genup program to the DSS project. Their contributions are gratefully
A number of farmers offered either mid-side wool samples or farm data from their
crossbreeding trials to the study that have been used in the research: John Booker, Carolyn &
Tim Aithen, David Hide, Matthews, L.M., Terry Mattingly, Bevan Mehrtens, James Pinckneys,
George Smith, Malcolm Taylor. Other people also kindly supplied data files which were
unfortunately unable to be used in the study: Chris Logan and Stephen Bell supplied FlockLinc
data, Robin Hilson and Derek Daniell supplied farm data. All these people are heartily thanked.
Jill Sutton of the Wool Measurement Service, Lincoln University helped with the wool
sample measurement. Jill and the other staff at the Wool Measurement Service who measured
the last lot of wool samples are greatly appreciated.
Lincoln University funded this research and awarded me the Wools of NZ Postgraduate
Fellowship and the Struthers Scholarship. Without these, this study could not possibly have
been done. NZ WoolPro also provided funding for the DSS project, which made it possible for
me to obtain support from WRONZ, including expert supervision from Drs David Cottle and
Terry Reid, project management, wool sample organisation throughout the course of the study.
I also wish to greatly thank Elizabeth Post, Professor Chris Kissling and Dr Andy Bray
for their generosity and kindness. A number of part time jobs offered by them in past years in
computing areas have helped me considerably in both financing my family and promoting my
computing skills. Professor Errol Wood is also heartily thanked for the critical support in my
application for the Wools of NZ Postgraduate Fellowship. Thanks to Janette Busch and Andy
Greer, in particular, for proof reading.
Finally, I wish to thank my wife Xiaowen, my lovely son Chris and other family
Publication
Wei, W., Cottle, DJ., Sedcole, J.R. and Bywater, A. (2003). "Simulation of sheep
crossbreeding systems: A risk analysis." Proceedings of Australian Association for the Advancement of Animal Breeding and Genetics. 15: 290-294.
@Risk AUNBALANCED CBE DSS GLM GST HeterosisEstimator Kinghorn Model LSD LSMean Mean LSD Mean SED MD N ns regional mean QRA SD SDM
SE or SEM
SED SEI SIL target data WMSLU WRONZ dd dm
m
Abbreviations
A Microsoft Excel add-in program package where techniques of
Monte Carlo simulation and QRA are implemented
the procedure of analysis of variance for unbalanced design
a program package named Crossbreeding Effects
Sheep crossbreeding decision support system
the generalized linear model
NZ Goods and Services Tax
a program to estimate of crossbreeding effects automatically
the Modell of the crossbreeding models (Kinghorn, 1987)
Least Significant Difference
least squares mean
the average least significant difference
the average standard error of difference
the maximum deviation
the observation number
non significant
A generalised mean produced from meta-analyses of local means
Quantitative Risk Analysis
Standard deviation
Simplified Dominance Model
Standard error of mean
Standard error of difference
the standard error of the ith mean
The NZ Sheep Improvement Limited
breed-trait means available for a simulation model to test against
the Wool Measurement Service of Lincoln University
Wool Research Organization of New Zealand
additive direct effect of the ith source population
additive maternal effect of the ith source popUlation
Averaged dominance direct effect of the ith source population
COLM
Curv or Curvature
EBrightness EBulk ECOLM ECurv EFDCV EFDIAM EFWl2 ELW EMA EMAM EStLgth EYield FDCV FDIAMl2 FECl FEC2 FootRot FWl2 GGTB GR HNLB HNLW LitSize LWl2 LW6 LW8 NEMl NEM2 NLB NLW Pinhole Ribby StLgth
Colour measured (Y -Z)
Fibre Curvature
Brightness of adult ewe fleece
Wool bulk (Loose wool) of adult ewe fleece
Colour measured (Y -Z) of adult ewe fleece
Fibre Curvature of adult ewe fleece
Fibre diameter variation of adult ewe fleece
Laboratory measured fibre diameter for adult ewe
12 month fleece weight for adult ewe
Live weight of adult ewe
Eye muscle area (predicted)
Eye muscle area (measured)
Staple Length Adult ewe fleece
Yield Adult ewe fleece
Fibre diameter variation
FDIAM at 12 months old standing hoggets
Faecal egg count before 1 March
Faecal egg count after 1 March
Foot rot
Fleece weight at 12 months, shorn as lambs
Loge(GGT) as an estimater of FE susceptibility
Ultrasonic fat depth (GR)
Number of lambs born per maiden ewe joined
Number of lambs weaned per maiden ewe joined
Litter size (lambs born of ewes lambing)
Liveweight at 12 months. old
Liveweight at 6 months old
Liveweight at 8 months old
Nematode count before 1 March
Nematode count after 1 March
Number of lambs born per ewe joined
Number of lambs weaned per ewe joined
Pinhole score (1-5) lambskin
Ribbyness score (1-5) lambskin
TLW
WWT
Yield
Booroola
Border Leicester or Bord
BordMer
BordRom
Cheviot
Coopworth or Coop
Coop(EFCoop)
CoopRom
Corriedale or Corr
Corr(DorMer)
Corr(MerDor)
CorrDor
CorrMer
CorrRom
Dorset or Dor
Dor(CorrMer) Dor(MerCorr) DorCorr DorMer DorRom EF
EF (EF (EFRom»
EF(EFCorr) EF(EFRom) (EFCoop)Coop (EFCorr)Corr (EFRom)Rom EFCoop EFCorr EFFin EFFin(Rom) EFRom
Two tooth live weight
Weaning weight at 3 months old
Washing Yield
Booroola Merino
Border Leicester
Bord x Merino
Border x Romney
Cheviot
Coopworth
Coopworth x EF(Coop)
Coopworth x Romney
Corriedale
Corrie dale x DorMer
Corriedale x MerDor
Corrie dale x Dorset
Corriedale x Merino
Corriedale x Romney
Dorset
Dorset x CorrMer
Dorset x MerCorr
Dorset x Corrie dale
Dorset x Merino
Dorset x Romney
East Friesian
EF x EF(EFRom)
EFxEFCorr
EFxEFRorn
EFCoop x Coop
EFCorr x Corr
EFRornxRorn
EFx Coop
EF x Corriedale
EFxFinn
EFFin x Romney
EFTex Finn Finn(BordRom) Finn(FinnSuffolk) Finn(RomCoop) FinnCorr FinnMer FinnRom FinnRom(Rom) FinnRomF2 FinnSuffolk HFWRom
Merino or Mer
Mer(ConDor) Mer(DorCorr) MerCon MerDor MerPer EFx Texel Finn
Finn x BordRom
Finn x FinnSuffolk
Finn x RomCoop
Finn x Corriedale
Finn x Merino
Finn x Romney
FinnRom x Romney
FinnRom x FinnRom
Finn x Suffolk
High Fleece Weight Romney
Merino
Merino x CorrDor
Merino x DorCorr
Merino x Corriedale
Merino x Dorset
Merino x Perendale
MerRom Merino x Romney
(MerRom)Rom MerinoRom x Romney
Oxford Down or Oxford Oxford Down
Oxford Coop Oxford x Coopworth
Oxford Rom
OxfordSuffol k
Perendale or Per
Poll Dorset or PD
PDEF
PDMer
PDRom
(PDEF)Corr
(PDRom)(TexRom)
Romney or Rom
RomCoop
RomCorr
RomDor
RomPer
Oxford x Romney
Oxford x Suffolk
Perendale
Poll Dorset
PDxEF
Poll Dorset x Merino
Poll Dorset x Romney
(PDEF) x Corrie dale
PDRom x TexRom
Romney
Romney x Coopworth
Romney x Corriedale
Romney x Dorset
SFMer SFMer(SFMerRom) SFMerRom (SFMerRom) Rom (SFMerRom)SFMer Suffolk SuffolkCoop SuffolkMer SuffolkRom TexelorTex Tex(Tex(TexCorr» Tex(TexCorr) Tex(TexRom) (TexRom) Rom TexCoop TexCorr TexMer TexPD TexRom TexRomF2
Class 1
Class 2 Class 3 Class 4 Class 5 Class 6 Class 7 Class 8 Class 9
Class 10
Class 11
ClassNZ
Super Fine Merino
SFMer x SFMerRom
SFMer x Romney
SFMerRom x Romney
SFMerRom x SFMer
Suffolk
Suffolk x Coopworth
Suffolk x Merino
Suffolk x Romney
Texel
Texel x Tex(TexCorr)
Texel x TexCorr
Texel x TexRom
TexRom x Romney
Texel x Coopworth
Texel x Corriedale
Texel x Merino
Texel x PD
Texel x Romney
TexRom x TexRom
NZ South Island High Country Farms
NZ South Island Hill Country Farms
NZ North Island Hard Hill Country Farms
NZ North Island Hill Country Farms
NZ North Island futensive Finishing Farms
NZ South Island Finishing-Breeding Farms
NZ South Island futensive Finishing Farms
NZ South Island Mixed Finishing Farms
New Zealand National WidelUnknown
Australia Data Source
Other Overseas Data Source
Table of Contents
ABSTRA CT ... II
DEDICATION ... VI
ACKNOWLEDGEMENTS ... VII
PUBLICATION ... IX
ABBREVIATIONS ... X
TABLE OF CONTENTS ... XV
LIST OF TABLES ... XIX
LIST OF FIGURES ... XXI
CHAPTER 1 INTRODUCTION ... 1
1.1
Background ...
11.2
Project flow chart and thesis structure ... 3
CHAPTER 2 LITERATURE REVIEW ... 5
PART
1:
SHEEP CROSSBREEDING RESEARCH IN NEW ZEALAND ...5
2.1
Introduction ...
5
2.2
Research areas involved with crossbreeding ... 6
2.3
Summary of Research Results ... 6
2.4
2.3.1
2.3.2
2.3.3
2.3.4
2.3.5
2.3.6
2.3.7
New composite breeds ... 6
Reproduction ... 7
Growth and carcass traits ... 10
Wool production and auality ... 14
Disease resistance ... 17
Heterosis ... 18
Costs of crossbreeding ... 19
Discussion and suggestions ... 20
PART
2:
DECISION SUPPORT SYSTEMS IN AGRICULTURE ...22
2.5
2.6
2.7
Introduction ...
22DSS strategy ...
23
2.6.1
2.6.2
2.6.3
Components ... 23
Benefits ... 24
Development methodology ... 24
Lessons from the past ...
252.7.1
Reasons for past failures ... 25
PART
3:
META-ANALYSIS-A USEFUL TOOL TO RESEARCH INTEGRATION29
2.9
Introduction ...
29
2.10 Strengths and limitations ... 29
2.11
Methodology of meta-analysis ... 30
2.12 Some issues in animal research integration ... 31
PART
4:
ESTIMATION OF CROSSBREEDING EFFECTS ...32
2.13 Genetic basis of crossbreeding effects ... 32
2.14 Methods for estimating crossbreeding effects ... 33
2.14.1 Linear functions ... 34
2.14.2 Least squares, fixed model ... 35
2.14.3 Mixed model ... 36
CHAPTER 3 ESTABLISHMENT OF A SHEEP CROSSBREEDING
DAT ABASE ... 37
3.1
Introduction ...
373.2
Analysis of the database system ... 37
3.2.1
Overview of the requirements of a sheep crossbreeding database ... 37
3.2.2
Definitions of terms used in the database ... 38
3.2.3
Special properties of the database ... 39
3.2.4
Use Cases ... 40
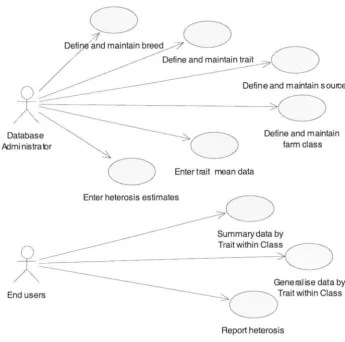
3.2.4.1 System actors ... 40
3.2.4.2 Use cases of the database ... 4 0
3.2.5
Use cases in detail ... 42
3.3
The database system design ... 44
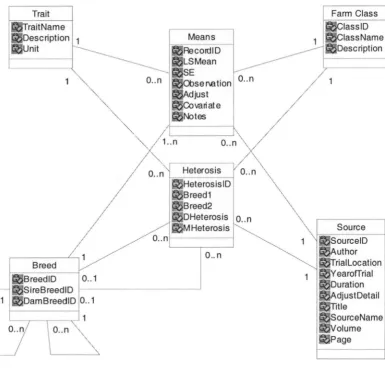
3.3.1
Class diagram ... 44
3.3.2
Explanation of attributes ... 46
3.3.3
Relational design ... 46
3.3.3.1 Table of farm classes ... 47
3.3.3.2 Table of breed-trait means ... 47
3.3.3.3 Table of breeds ... 47
3.3.3.4 Table of traits ... 48
3.3.3.5 Table of data sources ... 48
3.3.3.6 Table of heterosis estimates ... 49
3.4
Implementation of the database ... 49
3.4.1
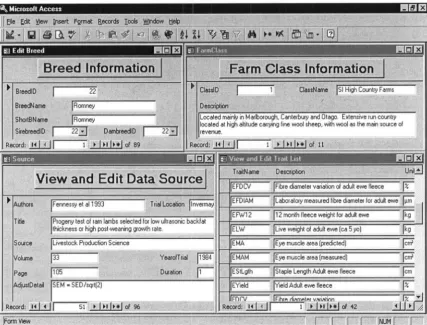
Forms ... 50
3.4.1.1 Form 1: Edit breed information ... SO 3.4.1.2 Form 2: Farm class ... So 3.4.1.3 Form 3: View and edit trait lisL ... SO 3.4.1.4 Form 4: View and edit data source ... SO 3.4.1.5 Form 5: View and edit Means data grouped by Trait.. ... Sl
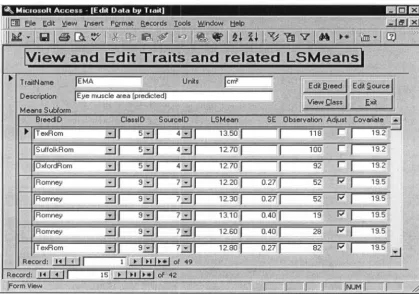
3.4.2
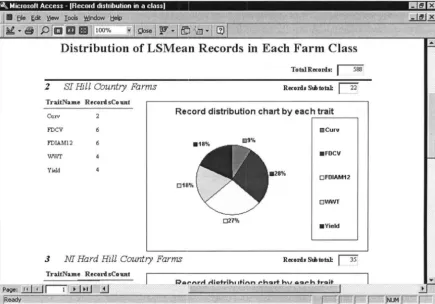
Reports ... 52
3.4.2.1 Report 1: Availability of data in the database ... S2 3.4.2.2 Report 2: Generalised means and standard errors in each class ... S3 3.4.2.3 Report 3: Direct heterosis (%) for each trait.. ... S4
3.5
Discussion ...
553.5.1
Assumptions and lirnitations ... 55
3.5.2
Further extension ... 56
CHAPTER 4 DATA DESCIRPTION AND PROCESSING ... 58
4.1
Introduction ... 58
4.2.1
Breeds covered in the data collation ... 58
4.2.2
Traits covered in the data collation ... 59
4.2.3
Data collation criteria ... 60
4.2.4
Wool samples and measurement methods ... 61
4.2.5
Method for analyses of raw data ... 61
4.2.6
Methodology for meta-analyses ... 62
4.3
Results and discussion ... 64
4.3.1
Unpublished crossbreeding data analyses ... 64
4.3.1.1 Hogget wool traits ... 64
4.3.1.2 Ewe wool traits ... 66
4.3.2
Meta-analysis results ... 69
4.3.2.1 Factors affecting weighted least squares analyses ... 69
4.3.2.2 Meta-analysis results ... 70
4.3.2.2.1 Growth traits ... 71
4.3.2.2.2 Carcass traits ... 73
4.3.2.2.3 Ewe reproduction traits ... 74
4.3.2.2.4 Hogget wool traits ... 75
4.3.2.2.5 Ewe wool traits ... 78
4.4
Further discussion of meta-analyses ... 80
4.4.1
Implications of the meta-analyses ... 80
4.4.2
Utility of the meta-analysis results ... 84
CHAPTER 5 ESTIMATION OF THE CROSSBREEDING EFFECTS
... 85
5.1
Introduction ...
85
5.2
Material and methods ...
85
5.2.1
Input data ... : ... 85
5.2.2
Genetic model ... 86
5.2.3
Method of estimation ... 87
5.2.4
Software used to estimate crossbreeding effects ... 88
5.3
Results ...
89
5.3.1
Summary information from the analyses ... 90
5.3.2
Reproduction ... 91
5.3.3
Growth and Carcass ... 92
5.3.4
Hogget wool. ... 94
5.3.5
Ewe wool ... 97
5.3.6
Maternal and paternal heterosis for wool traits ... 98
5.4 Discussion and suggestions ...
1 ...99
5.4.1
Implications ... 99
5.4.2
Algorithm and quality of estimates ... 100
5.4.3
Difficulties for the DSS ... 102
CHAPTER 6 A SIMULATION STUDY ON PREDICTION OF
UNTESTED CROSSBRED PERFORMANCE ... 104
6.1
Introduction ... ... 104
6.2
Materials and methods ...
l06
6.2.1
Scope ... 106
6.2.2
Genetic model and design matrix ... 106
6.2.5
Assumptions ... 110
6.3
Results ...
110
6.3.1
Distribution functions ... 111
6.3.2
Simulated results on WWT ... 112
6.3.2.1 Monitoring results of MD of the WWT models ... 112
6.3.2.2 Validated crossbreeding parameters of the WWT models ... 114
6.3.2.3 Predicted results from the WWT models ... 115
6.3.3
Simulated results on LitSize and Bulk ... 116
6.3.3.1 Monitoring results ofMD of the LitSize and Bulk models ... 116
6.3.3.2 Validated crossbreeding parameters of the LitSize and Bulk models ... 117
6.3.3.3 Predicted results from the LitSize and Bulk models ... 118
6.3.4
Evaluation of different crossbreeding systems ... 119
6.4
Discussion ... 120
CHAPTER 7 GENERAL DISCUSSION ... 124
7.1
Contributions to the DSS ... 124
7.2
Advantages and disadvantages of the algorithms and tools ... 125
7.3
Make the DSS an integrated software package ... ;.128
7.4
A
few
final points ...
129
7.5
Conclusions ...
131
REFERENCES ...•...
132
APPENDIX 1METHODOLOGY OF VARIANCE CONVERSION 145
APPENDIX 2 MID SIDE WOOL SAMPLE MEASUREMENT
METHODS ...
147
APPENDIX 3 DESCRIPTION OF HETEROSISESTIMATOR ... 151
APPENDIX 4 LIST OF COLLATED HETEROSIS ESTIMATES
FROM LITERA TURE ....•...•...
156
List of Tables
Table 2.1 Reproduction performance of the exotic breeds and their contemporary NZ
genotypes ... 7
Table 2.2 Lamb growth rate performance cited from NZ crossbreeding literature ... 11
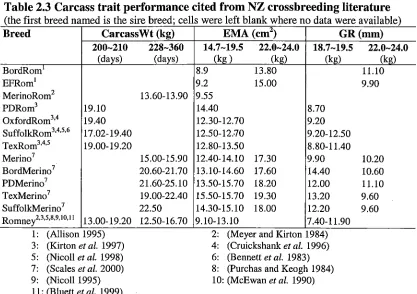
Table 2.3 Carcass trait performance cited from NZ crossbreeding literature ... 13
Table 2.4 Hogget wool trait performance cited from NZ crossbreeding literature ... 15
Table 2.5 Direct heterosis estimates (%) from NZ crossbreeding literature ... 19
Table 3.1 An example of report of generalised means and standard errors ... 54
Table 3.2 An example of a report of general direct heterosis (%) and generalised overall means for traits (in Farm Class
5) ... 55
Table 4.1 Farm class definitions ... 60
Table 4.2 Details of wool sampling and the farms that supplied wool samples ... 61
Table 4.3 Least squares means and standard errors of hogget wool traits ... 65
Table 4.4 Least squares means and standard errors for ewe wool traits measured from OFDA ... 67
Table 4.5 Least squares means and standard errors for Yield, Bulk and Colour from ewe wool samples ... 68
Table 4.6 Summary information of the weighted least squares analyses ... 70
Table 4.7 Overall least squares means and standard errors of growth traits ... 72
Table 4.8 Overall least squares means and standard errors of carcass traits ... 74
Table 4.9 Overall least squares means and standard errors of ewe reproduction traits ... 75
Table 4.10 Overall least squares means and standard errors of hogget wool traits ... 76
Table 4.11 Overall least squares means and standard errors of ewe wool traits ... 79
Table 5.2 Number of estimates of crossbreeding parameters produced from the analyses
of 2-breed crossbreeding plans ... : ... 91
Table 5.3 Range of direct heterosis estimates for reproduction traits ... 92
Table 5.4 Range of direct heterosis estimates for growth and carcass traits ... 93
Table 5.5 Range of direct heterosis estimates for hogget wool traits ... 96
Table 5.6 Range of direct heterosis estimates for ewe wool traits ... 96
Table 5.7 Range of maternal and paternal heterosis estimates for hogget wool traits .... 98
Table 5.8 Range of maternal and paternal heterosis estimates for ewe wool traits ... 99
Table 6.1 Available normal distribution functions of direct additive effects defined for
each breed and each trait within ClassNZ and Class 5 ... 111
Table 6.2 Available normal distribution functions of direct and maternal heterosis
effects defined for each trait within ClassNZ and Class 5 ... 112
Table 6.3 Validated crossbreeding parameters of the WWT models for ClassNZ and
Class 5 ... 114
Table 6.4 The best-performed genotypes and their predicted WWT merits projected
from the models for ClassNZ and Class 5 ... 115
Table 6.5 Validated crossbreeding parameters of the LitSize and Bulk models for
ClassNZ ... ' ... 117
Table 6.6 The best-performed genotypes and their predicted merits from the LitSize and
Bulk models for ClassNZ ... 118
Table 6.7 Genotypes with top economic returns within each breeding system at given
trait economic weights for ClassNZ ... 119
Table A3.1 Properties of the files enclosed in the program ... 152
Table A3.2_1 Parameters produced for a three-breed model on WWT ... 154
Table A3.2_2 Estimated means vs observed means ... 154
Table A3.3_1 Parameters produced for a 3-breed model on FW12 ... 155
Table A3.3_2 Estimated means vs observed means ... 155
Table A4.1 List of collated heterosis estimates from literature ... 156
List of Figures
Figure 1.1 Flow chart of the DSS project.. ... 3
Figure 2.1 Different Romney carcass weights in two selection times ... 13
Figure 3.1 Use Case Diagram of the Database System ... .41
Figure 3.2 Class Diagram of the Sheep Crossbreeding Database ... .45
Figure 3.3 A view of the Breed, Trait, Farm Class, and Source forms ... 51
Figure 3.4 Form view of editing data in the Means table by trait ... 52
Figure 3.5 View of a report of data availability in each farm class ... 53
Figure 6.1 MD histogram in the WWT model for ClassNZ ... 113
Figure 6.2 MD histogram in the WWT model for Class 5 ... 113
Figure 6.3 MD histogram in the LitSize model for ClassNZ ... 116
Figure 6.4 MD histogram in the Bulk model for ClassNZ ... 117
Figure 7.1 The hierarchy of the data flow in this study ... 125
Figure A5.1 @Risk model (in Excel style) for WWT simulation model for ClassNZ .160
Chapter 1
Introduction
1.1
Background
Crossbreeding is a commonly used and powerful tool in animal production. It offers
great flexibility for users to exploit the resources of breeds and strains and to change production
directions quickly. In future, the challenge for livestock genetic improvement will be producing
ideal economic breeds within the context of specific production and marketing environments.
Creating efficient crossbreeding systems by effectively combining available breed resources and
wise use of available technologies could foster the accomplishment of the ideal (Taylor et al.
1997).
Crossbreeding effects, referred to mainly as heterosis (or hybrid vigour), have been
manifested in plant and animal industries for many years throughout the world. Literally,
heterosis is defined as the extra performance of the crossbreds over the weighted average of the
parent breeds (Kinghorn 1997), or the amount by which merit in crossbreds deviates from the
additive component (Swan and Kinghorn 1991). In the simplest case where only two parent
purebreds are involved, heterosis is measured as the amount that the offspring merit deviates
from the mid-parent mean, which is the most commonly used concept of heterosis (Nitter 1978;
Price 1998).
The extent of the use of crossbreeding in sheep is far behind that in the swine and
poultry industries because of the low fecundity of sheep and the low extent of specialisation in
sheep production. Stratified crossbreeding structures, which are related to the quality of
grazing, can be found in lamb production systems in the UK, Australia, and the USA (Ch'ang
and Atkins 1982; Read 1982; Terrill 1982). They are relatively simple compared to those in the
swine and poultry industries. There is great potential to promote the competitiveness of the
sheep industry by establishing well-designed crossbreeding systems (Clarke 1995).
Great interest in crossbreeding has been generated among sheep breeders in New
Zealand in recent years, in response to market changes in which wool has become less important
than previously. As pointed out by McEwan et al.(1995), wool and lamb provided 45% and 6%
of the gross revenue respectively in NZ sheep and beef farms in the 1987/88 season, in contrast
to 28% and 22% respectively in the 1993/94 season. The wool proportion of the gross revenue
Economic Service of New Zealand: 20.9% in the 1997/98 season, 19.5% in the 1998/99 season
and 18.5% in the 1999/2000 season (NZMWES 2001). Consequently, knowledge and
information on how to make better use of crossbreeding are at high demand in the NZ sheep
industry in order to compete for niche markets and to improve the sheep farming profitability.
However, despite the enormous amount of sheep crossbreeding research which has been
carried out in comparing breeds and crosses in the past, it has proved difficult to find good
quality data that can be used to provide extension advice for crossbreeding in specific
environments (Price 1998). The problem is compounded by the wide variety of environments,
sheep breeds, and management systems in NZ which can create major difficulties, not only in
determining the level of crossbred performance but also in establishing the ranking of different
breeds and crosses.
A number of questions need to be answered before any sensible suggestions about
structured crossbreeding systems can be made. These include:
• How much useful information on sheep crossbreeding exists in NZ literature?
• How can such information be robustly converted to regional and national
information for general use?
• Would the existing information be sufficient to study crossbreeding systems
using the sheep genetics theories?
• How can the existing information be used to estimate heterotic effects in order
to predict and rank the performance of different breeds and crosses?
• How can different crossbred genotypes and crossbreeding systems be evaluated
if the existing information is insufficient?
To tackle these problems and prepare for the future needs of designing NZ national
sheep crossbreeding systems, a research project aimed to develop a sheep crossbreeding
decision support system (DSS) was commenced in 1998. Such a DSS would offer a convenient
way of manipulating crossbreeding information, estimating and predicting the crossbreeding
effects of different breeds and their crosses in specific environments, and ranking different
crossbreeding programs and breed combinations by using reliable published data and
appropriate economic weights. It is expected that the DSS users would be able to find the
optimal choice for their own situations, and consequently the industry would move towards the
better structure to exploit the existing breed and strain resources.
This DSS project was funded by the NZ WoolPro (previously Wools of NZ), managed
by the Wool Research Organization of NZ (WRONZ) and supported by the NZ Sheep Council
and a number of researchers and sheep farmers who supplied data, wool samples and advice.
useful for the development and future extension of the DSS. Lincoln University provided
research funding and scholarships to the thesis work. The major objectives are:
• Systematically review the published literature to identify useful data from NZ
sheep crossbreeding trials and information gaps.
• Develop a sheep crossbreeding database and collate data from both the literature
and farm trials for the DSS.
• Develop algorithms and use them to analyse the collated data, in order to produce
regional means (or generalised means) that are the genotypic effects averaged
across particular environment, ignoring specific within-region genotype x
environment interactions. These are therefore applicable to the corresponding
environmental regions and can be used to estimate crossbreeding effects.
• Develop algorithms and methodology and use them to estimate crossbreeding
effects using the regional means.
• Develop a computer program that automates the estimation process including
automatically reading input means, analysing crossbreeding models and writing
results to excel worksheets for further analysis.
• Develop a simulation model and algorithms and use them to handle uncertainties
of crossbreeding effects and to predict untested crossbred performance.
1.2
Project flow chart and thesis structure
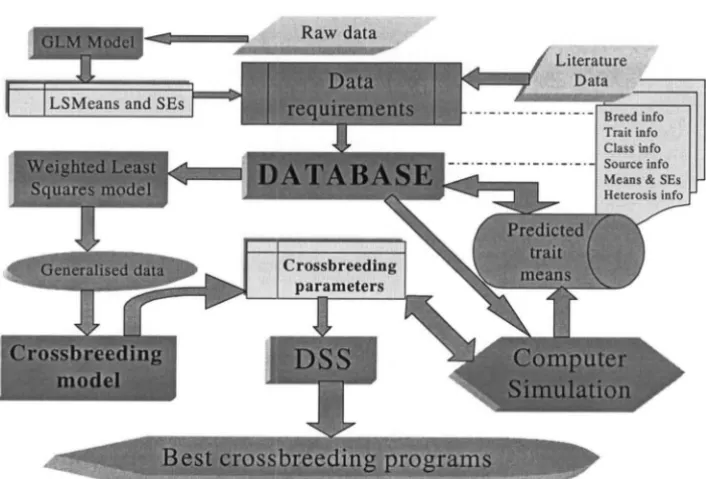
The project flow chart is displayed in Figure 1.1.
Figure
1.1
Flow
chart of the DSS project
The project started with a literature review of published crossbreeding trials within NZ
in order to identify the useful information for data collation, as well as information gaps that
needed further work to fill (Chapter 2). A brief review of the development of agricultural DSS
was also given in Chapter 2 in order to identify the problems that the DSS project was likely to
confront, and to report suitable technologies for a database and DSS development. The
meta-analysis methodology and crossbreeding theories were also reviewed in Chapter 2.
A sheep crossbreeding database was established with a user-centred policy being
applied to the analysis, design and implementation of the database (Chapter 3).
Data collation was then performed. The data types incorporated into the database were
the least squares means (LSMean) and standard errors of means (SE) of raw data which were
produced by a subroutine of unbalanced analysis of variance within the generalised linear model
(GLM); the analysed results and the LSMeans and SEs from literature data that met the
requirements for data quality. The collated data in the database were analysed by using the
weighted least squares approach to produce generalised means and standard errors (Figure 1.1).
These procedures are covered in detail in Chapter 4.
The generalised data were used in a crossbreeding model to estimate crossbreeding
parameters including direct and maternal heterosis. A computer program was developed for this
task specifically to reduce the computing time and automate the process. The resultant
parameters were analysed together with the reported heterosis estimates stored in the database,
in order to prepare for defining appropriate probability distribution functions (Chapter 5).
The distribution functions were defined and input into a computer simulation model to
predict performance of different crossbred genotypes, using the current crossbreeding theory
and risk analysis technologies (Chapter 6). The predicted results were tested against certain
target data. The simulation iterated until predefined criteria were met. The validated simulation
results were then stored and ready to be used in the DSS in order to produce decision oriented
information at either trait or production levels to users to make better decisions on adopting
appropriate crossbreeding systems.
At the time of the thesis writing, the first vetsion of the DSS software was completed by
WRONZ but has not been validated against independent data. Some thesis work, such as the
simulation study and the computer program, were still under development at that time, which
consequently was unable to incorporate into the first version of the DSS. A general discussion
was therefore given in Chapter 7 to further discuss the usefulness of the thesis work to the DSS
and how to integrate it into the DSS. Issues that need to be considered in the later versions of
Chapter 2
Literature review
Part 1: Sheep crossbreeding research in New Zealand
2.1
Introduction
The NZ sheep industry has traditionally been largely based on one breed - the Romney
(Meyer et al. 1977; Stewart and Garrick 1996). Crossbreeding has played an important role in
the industry's development. Its contributions can be grouped into three categories: formation of
new synthetic breeds (eg, Corriedale, Perendale, Coopworth, South Suffolk, South Dorset
Down); improvement of lamb production (eg, crossing terminal sires over Romney derived
local dams for prime lambs); improvement of individual traits (eg, fecundity, lean meat, wool
bulk) (Clarke 1982b;1995; Clarke and Meyer 1982).
Prior to the 1960s there was little information on the relative merits of New Zealand
sheep breeds and crosses. Large-scale trials of diallel crosses were initiated in 1970 at the
Woodlands and Templeton Agricultural Research Stations in order to compare the main
contemporary purebreds and their reciprocal crosses (Clarke and Meyer 1982). Trials of Border
Leicester (Bord) crossing Romney (Rom) in hill country, and trials comparing 15 sire breeds,
are also well known examples of the evaluation of sheep crossbreeding in NZ (Clarke 1982a).
A number of breeds have been imported to improve the national sheep flocks through
crossbreeding, including Finnish Landrace (Finn), East Friesian (EF), Texel (Tex), Suffolk,
Oxford Down (Oxford) and Booroola Merino (Booroola). The Booroola was imported from
Australia from 1972 onwards. The Finn, EF and Oxford Down were first imported in 1972
from the UK but were destroyed after scrapie was diagnosed in the EF flock during quarantine.
However, the NZ born EF and Finn crossbred ewes showed high prolificacy (Clarke and Meyer
1977; Meyer and Clarke 1978; Meyer et al. 1977). Consequently a second importation was made in 1984 through frozen embryos and semen, with Oxford Down from Denmark, Finn from
Finland, and Texel from the both countries. The EF was re-imported from Sweden in 1992 due
to a major interest in its high fecundity and high milk production.
Most of the crossbreeding research conducted in NZ occurred in the 1970s and early
1980s but then fell out of favour with funding bodies (McEwan J. pers. comm.). Breed
evaluation trials have seldom been definitive and many have ignored wool and carcase quality \
traits and changes to production systems. Unlike other sheep producing countries such as the
systems based on first cross ewes in NZ (Ch'ang and Atkins 1982; Clarke 1995; Read 1982;
Terrill 1982).
Published NZ research from 1972 onwards was reviewed in this chapter in order to
establish the background of sheep crossbreeding, with emphasis on the crossbred progeny from
the newly imported breeds. The objectives were to identify in the literature information useful
to the DSS project (Chapter 1), to summarise the reported results narratively rather than
quantitatively, and to find possible deficiencies in the research and results published. No
attempt was made here to evaluate or rank the various breeds or crosses.
2.2
Research areas involved with crossbreeding
Crossbreeding has been evaluated as a tool in the following sheep research areas:
1. breeding new composite breeds.
2. improving ewe reproduction traits.
3. improving lamb growth rate and carcass traits.
4. improving wool traits.
5. increasing sheep resistance to disease.
The perceived importance of crossbreeding in these areas is variable. It depends on the
concurrent market situation, the funding body's priorities, the difficulty and cost of organising
trials, and the duration of the research. Trials were normally performed to meet specific
purposes within the areas mentioned above but normally not for the purpose of studying
crossbreeding per se. Comprehensive studies on regional or national crossbreeding systems for prime lamb productions were not found in NZ literature.
2.3
Summary of research results
2.3.1 New composite breeds
Crossbreeding has been used to incorporate desired merits into new composite breeds in
NZ. The formation of the Corriedale (Corr), Perendale (Per) and Coopworth (Coop) have been
well documented (Meadows 1997). Since 1989, Landcorp Farming Limited has screened large
gene pools and mated those screened ewes to several breeds of rams (Romney, Wiltshire, Poll
Dorset (PD), Coop worth and Texel) to form the Lamb Supreme terminal sire line (Nicoll 1995;
Nicoll et al. 1992; Nicoll et al. 1998).
Another significant new composite breed, the GrowBulk sheep, has been developed by
crossing Poll Dorset and Texel rams over High Fleece Weight Romney (HFWRom) ewes to
(Clarke et aZ. 1999; Lyons 2001; Sumner 1999). Members of the Southland-Otago Romney
group are forming the Tefrom breed from crossing Texel, EF and Romney sheep (Campbell, R.
and Welsh, R. pers. comm.).
2.3.2 Reproduction
Reproductive performance is one of the main areas in which crossbreeding can add
great values in the form of heterosis (Nitter 1978). There were wide variations in the
reproduction performance of Romneys and Bord x Romney (Table 2.1), indicating that there
were large environmental influences on the reproduction traits. One trial of comparison of six
Romney strains showed that there were up to 24% genetic differences for prolificacy among
them (Baker et aZ. 1987; Dobbie 1988). These strain variations and environmental influences
need to be carefully dealt with when trying to predict crossbred performance. For examples,
different trains could be regarded as different genotypes rather than just as Romney; trials in
different environments should be analysed separately.
Table 2.1 Reproduction performance of the exotic breeds and their contemporary
NZ genotypes
(NLB: lambs born/ewe mated; NLW: lambs weaned (docked)/ewe mated; cells were left blank where no data were available)Ewe Breed After the 1st importation and After the 2nd importation before 1980
Litter Size
Border Leicester 1.581
Cheviot 1.48'
Coopworth Finn
Merino 1.051
Oxford Down
Romney 1.047-1.58 Texel
Bord x Romney 1.2r?-1.718 Cheviot x Romney
PD x Romney EFxRomney EF x Coop worth Finn x Romney Merino x Romney Oxford x Romney Suffolk x Romney Texel x Romney
1: (Clarke 1982a) 3: (Jopson et al. 2000b) 5: (Dobbie et al. 1985) 7: (Meyer et al. 1977) 9: (Wuliji et al. 1999)
1.167 1.267 1.4r?
1.617
NLB
0.787-1.388
1.07-1.598 1.057 1.187 1.387
1.587
(from 1985 onwards) NLW Litter Size
1.191 1.14'
1.84-1.982 2.14' 0.761-1.075 1.156 1.04' 0.537-1.128
1.34' 0.877-1.388 1.24'
0.677 1.037 1.297
2.57-2.762 1.367 1.74*
1.13-1.25
1.34' 1.34' 1.14*
2: (Jopson et aZ. 2000a) 4: (McMillan et al. 1988) 6: (Wuliji et aZ. 1998) 8: (Baker et al. 1987) *: Ewe hogget
NLB NLW
1.983 1.50-1.592 1.34'
0.244'
1.389 1.179 0.844*
0.654'
2.l3-2.212 1.314'
None of the Romney strains had prolificacy that surpassed the pure breed Coop worth or
Border Leicester counterparts. To improve fertility and fecundity in the national flocks, it was
therefore necessary to introduce new more prolific breeds such as Finn, EF and Booroola.
These breeds were considered superior to the Romney and Romney-originated local breeds.
Subsequent trials have verified this perception (Table 2.1).
The EF and Finn were the most popular crossbreeding sires used to improve sheep
fecundity in NZ at the time of this review. A preliminary report on exotic breeds (Texel,
Oxford Down and Finn) after the second importation showed that the Finn crossbred ewe
hoggets had exceptionally high mean estimates of Litter Size and NLB indicating the advantage
of early reproduction rates in using Finn sires (McMillan et ai. 1988) (Table 2.1). A high fecundity in the EF which had a 230% lamb drop in mature ewes, and a reproductive superiority
in their crosses were also reported (Allison 1995), although they were only released from
quarantine in 1996.
The outstanding reproduction performance in the EF, Finn and their crosses was also
observed by other NZ workers (Table 2.1). The EF and Finn crosses were recognised to have
an extremely low incidence of barrenness, high litter size and good lamb survival rate (Meyer
and Clarke 1978; Meyer et ai. 1977). A recent study of EF by Coopworth crosses confirmed that their litter size and NLW ranged from 2.57 to 2.76 and 2.13 to 2.21 respectively, which
were higher than straight Coop worth (Jopson et ai. 2000a; Jopson et ai. 2000b)(Table 2.1).
Another reason that EF and Finn have stayed popular for promoting prolificacy is that
their crossbred progeny are not too prolific to be managed under extensive NZ grazing
conditions. It was found that the high incidence of mUltiple births from EF and Finn crossbred
ewes, 59% and 41 % respectively, was mainly composed of twins with only one set of triplets
being born (Meyer et ai. 1977). Davis et ai. (1983) also reported that the Finn and Finn crosses
had a high percentage of twins ranging from 50% to 60%, and a high litter size ranging from 1.7
to 2.3 lambs per ewe lambing. Singles and twins achieved higher survival rates compared to
triplets and quadruples, which tended to have lower birth weights and were more susceptible to
starvation and/or exposure, resulting in high mortality' rates (Davis and Hinch 1985; Hinch et ai.
1983; Meyer and Clarke 1978). The high milk production in EF crossbred ewes (Allison 1995)
may also have contributed to their good lamb survival rates.
The Booroola was one of the common crossbreeding sire breeds used to improve
fecundity in NZ before the EF and Finn became available. It is well known that the high
fecundity in Booroola is controlled by the single major additive gene FecB (Davis et ai. 1991).
Crossbreeding trials have showed that the introduction of a single copy of the FecB gene can lift
the flock fecundity dramatically in a single generation, resulting in an increase in numbers of
unlikely to exceed 1 %. Averaged over many NZ flocks, ewes carrying one copy of the FecB
gene, produced about one extra lamb per lambing (Davis and Meyer 1983).
Unfortunately, there are also disadvantages in using the Booroola as a source of FecB
genes in the NZ flocks. Compared to NZ local breeds ewes such as the Romney, Coopworth
and Perendale, on average the crossbred ewes with one single copy of FecB gene produced 15%
fewer twins, 4% more singles, 11 % more triplets and quadruplets, resulting in higher lamb
mortalities and lower lamb growth rates (Davis et al. 1983; Hinch et al. 1983). Good
management in these high fecundity Booroola flocks is crucial to ensure satisfactory lamb
survival and growth rates (Davis and Meyer 1983).
The other disadvantage of using the single gene effect in Booroola is that there are not
intermediate types of modest fecundity. This can be moderated by regulating the number of
carriers in the flock, for example having 25% of carrier ewes in the flock could achieve 25%
increase of lamb drop (Davis and Meyer 1983). However, the 'over' fecundity issues in the
carriers remain unsolved. Other factors associated with Booroola crosses, such as lighter ewe
body weights, lower wool weights, different wool types and greater susceptibility to footrot,
compared to NZ local breeds also affected the adoption of Booroola crosses in NZ (Davis and
Hinch 1985; Davis and Meyer 1983).
Crossbreeding has also been used to develop out-of-season lambing to supply chilled
lambs to niche markets year-round. Difficulties, such as the restricted oestrous cycles of most
NZ sheep breeds, seasonal growth patterns of pasture, extra management and feed demand,
lower lamb growth rate and higher lamb mortality, are likely to be encountered when trying to
extend the breeding season (Morris 1997). The Poll Dorset was identified as the appropriate
breed for a natural expansion of the sheep breeding season in NZ without the use of hormones
(Andrewes 1983; McQueen and Reid 1988; Smith et al. 1992) and consequently used as sires to
produce crossbred ewes for this purpose.
Border Leicester x Romney (BR), Poll Dorset x BR and Suffolk x Romney ewes have
been used to evaluate out-of-season lambing policies in NZ (Morris et al. 1993). It was found
that lambing policy, out-of-season vs spring, did not influence the proportion of ewes lambing
but more (P<O.05) multiple births occurred in the spring lambing ewes, and the differences
between crossbred genotypes in these two traits were small and non significant. Consequently,
higher prices for out-of-season lambs were needed to compensate for the lower lamb production
(Lowe et al. 1988; Morris et al. 1993). Unfortunately, the potential use of prolific breeds such
as EF, Finn and Booroola in out-of-season lambing has not yet been explored in NZ.
The potential of crossbreeding in the development of hogget lambing has not been
comprehensively studied in NZ. Limited studies on hogget lambing indicated that it was
feasible using NZ pure breeds (Romney, Coopworth, Perendale) (Johnston et al. 1996; McCall
fanners if more convincing evidence of economic advantages becomes available (Moore et al.
1983). Crossbreeding may help to promote hogget lambing. This is because crossbred lambs
sired by more fecund and earlier maturing breeds such as EF and Finn are also likely to show
earlier puberty, better prolificacy and higher growth rate, and therefore stand better
opportunities for successful hogget lambing than the counterpart purebred ewe lambs.
Unfortunately, most of the studies mentioned above were unable to estimate heterosis
due to the limited numbers of the imported animals. Further work is needed to explore the
consequences of inadequate infonnation in this area. However, crossing with the Booroola was
different because, in this case, the manipulation of a single major gene effect was involved, as
distinct from the utilisation of heterosis. Consequently the Booroola will not be discussed any
further in this review.
2.3.3 Growth and carcass traits
Growth rate has received the most attention in sheep crossbreeding research, especially
in those studies where tenninal sires were evaluated (Kirton et al. 1995a; Kirton et al. 1995b).
Carcass quality traits were ignored when fanners received no discount for over-fat lambs in
1970s. In recent decades there has been more attention paid to the production of high quality,
lean, prime lambs. Trials involving the Texel, Suffolk, Oxford Down and Poll Dorset (or
Dorset) as tenninal sire breeds have been conducted. However, comparisons of the carcass
perfonnance were only made between crossbreds and their counterpart local straight breeds
because only limited numbers of animals of these tenninal sire breeds were available and which
were not available for slaughter and measurement. Hence, heterosis estimations on carcass
traits were very scarce.
Most of the collectable growth data from NZ crossbreeding research are summarised in
Table 2.2. Most genotypes in this table did not have more than three records on each trait,
which may mean that any conclusion may be uncertain. Even for the Romney, which has
received a lot of attention and was referred to as the base genotype of the table, it is still hard to
draw conclusions on a growth pattern with confidence·because the results varied across different
studies. However, ignoring the year effects, the different growth periods and the environmental
effects that each research might have contained, it is very clear that most of the crossbred
progeny showed superiority to the Romney or their counterpart local breeds in all three traits in
the table.
The Suffolk, Oxford Down, Texel and their crossbred progeny grew much faster than
their Romney, Coopworth and Merino counterparts (Table 2.2). This was expected because
these three breeds had been imported for use as tenninal sires. It was reported that the Oxford
Table 2.2 Lamb growth rate performance cited from NZ crossbreeding literature
(N: number of reports; Means: reported means in range; % Rom: percentage of the mean performance relative to the mean Romney performance (100); the first breed named is the sire breed; cells were left blank where no data were available)Breed Birth weight
N Means Border Leicesterl
BordMerino2
BordRom3. 4. 5 2 4.44-5.10 Coopworth6. 7. 8. 9. to 3 4.40-4.97
CoopRom4. 9. to 2 3.98-4.30
RomCoopl1
EFCoop6 1 5.42
EFCorrl2
Coop(EFCoop )6 1 5.07 (EFCoop )Coop 6 1 4.93 (EFCorr)CorrI2
Finn5 FinnRom5. II Merinol. 2.13 MerinoRom13•14 Texel5
TexCooplI TexMerino2
TexRom5. 15. 16 2 5.00 Tex(TexRom/6 1 4.50 TexRomF216 1 4.70 (TexRom)RomI6 1 4.90 (PDRom)(TexRom)16 1 4.60 Oxford Down5
OxfordCoopl1 OxfordRom5 SuffolkMerino2 SuffoikRom5
Romney!' 4. ~. 11. Jj·:lU 5 4.10-4.30 (average) (4.20) 1: (Clarke 1982a)
3: (Dabiri et
at.
1996) 5: (McMillan etat.
1988) 7: (Jopson etat.
2000b) 9: (Bray etat.
1990)11: (Newman and Paterson 1991) 13: (Dobbie et
at.
1985)15: (Wuliji et
at.
1995) 17: (Morris etat.
1996b) 19: (Morris etat.
1996a)% Rom
114 110 99 129 121 117 119 107 112 117 110 100 N 1 1 3 7 4 1 1 1 1 1 1 1 2 4 3 1 1 1 3 1 1 1 1 1 1 1 1 1 14
Weaning weight Live weight(12 months old) Means % Rom N
22.60 112 26.90 133 1 19.50-21.10 101 2 15.50-26.00 111 15.30-24.10 98 1
26.10 129 1 26.90 133 31.62 156 25.20 124 23.40 115 30.58 151 24.67 122 1 20.20-26.60 115 2 17.90-22.20 98 3 17.80-21.50 100 2 25.30 125 1 29.40 145 1 25.90 128 1 21.40-26.80 122 3 24.20 119 1 25.90 128 1 23.20 115 1 26.10 129 1 27.57 136 1 31.30 154 1 22.00 109 1 24.60 121 1 20.80 103 1 17.60-23.30 100 11
(20.26)
2: (Scales et
at.
2000) 4: (Baker et at. 1987) 6: (Jopson etat.
2000a) 8: (McEwan etat.
1990) 10: (Fennessy et at. 1992)Means 46.70 47.90-54.30 45.60 55.20 43.75 42.50-51.20 38.20-42.50 46.60-48.10 45.95 60.10 47.20 53.00-54.60 48.90 54.20 50.80 55.30 49.50 60.10 58.30 48.30 56.90 38.20-45.40 (42.60)
12: Taylor/Cottle 2000 (field data) 14: (Meyer and Kirton 1984) 16: (Wuliji et at. 1997)
18: (Everett-Hincks et
at.
1998) 20: (Kenyon et at. 1999)% Rom


![A triclinic polymorph of catena poly[[bis(N,N dimethylformamide κO)cobalt(II)] di μ 1,5 dicyanamido κ4N1:N5]](data:image/gif;base64,R0lGODlhAQABAIAAAP///wAAACH5BAEAAAAALAAAAAABAAEAAAICRAEAOw==)