New Zealand Journal of Animal Science and Production 2018. Vol 78: 151-156
151
Plantain: It is not only the dietary content, but also how we graze it…
P Gregorinia*, RH Bryanta, MR Becka and GR Edwardsa,
a Faculty of Agriculture and Life Sciences, PO Box 85084, Lincoln University, Lincoln 7647, Christchurch
*Corresponding Author. Email: Pablo.Gregorini@lincoln.ac.nz
Abstract
A mechanistic and dynamic model of a grazing ruminant, MINDY, was used to explore the effect of both the proportion dietary inclusion of plantain (PL) and its grazing management, compared with ryegrass (RG), on urinary N (UN) excretion of dairy cows. The treatment tested were: 1) frequency of allocation and 2) dietary proportion of PL. Frequency of allocation was set by strip-grazing (24 hrs. pasture breaks) PL or RG monocultures for 1, 5 or 10 consecutive days, allocated either after the morning (AM) or afternoon (PM) milking. The proportion of dietary PL was set by offering either 25 or 50% of the diet as PL monocultures allocated either AM or PM. MINDY had greater intake of PL-containing diets than RG alone, resulting in increased N intake. However, with the exception of the ‘frequency’ treatments, daily urinary N excretion (UN) was reduced by including PL compared with RG alone. Plantain monocultures led to similar or lower urine volume compared with RG. Grazing RG and PL every 1 or 5 days increased urine volume, frequency and UN compared with RG or continuous PL. Offering PL or RG in the AM compared with PM reduced UN but reduced milk yield. This modelling exercise suggests that including PL in cattle’s diet reduces UN and UN concentration, and that the frequency and timing of its allocation help to reduce environmental impact further while maintaining or increasing MS.
Keywords: plantain; grazing management; urinary N excretion
Introduction
The largest contributor to nitrogen (N) leaching from ryegrass-clover pasture-based dairy farms is the surplus feed N excreted as urinary N (UN) onto pastures. Swards combining perennial ryegrass (RG) (Lolium perenne L.) and herbs like plantain (PL) (Plantago lanceolata) have shown potential to yield similar herbage DM/ha per year (Nobilly et al. 2013), but with a lower fibre content and a greater ration of water-soluble carbohydrate to crude protein, as well as greater mineral content compared with standard RG–based swards (Bryant et al. 2017). These PL-containing swards have shown considerable potential to lower the UN excreted by dairy cows (Totty et al. 2013; Bryant et al. 2017) and therefore, N leaching. However, there is still lack of information on the effect of strategic grazing management (e.g., timing and frequency of pasture allocations) and proportion of PL in the sward on patterns of UN excretion.
In vivo measurements of urination behaviour and corresponding measures of UN and N metabolism pose considerable experimental, technical and economic challenges. Integrating these processes with animal decisions and grazing management strategies in vivo is an even greater challenge. As a result, advances in knowledge translated to practical grazing managements have been slow and costly. Models can help us define problems and integrate information across multiple scales, make predictions, and test hypotheses (Provenza et al. 2015). Thus, modelling allows quick and relatively inexpensive evaluations that can accelerate efforts in a field of endeavour.
Much empirical data and mathematical representations of UN excretion have been accumulated (Murphy 1992; Silanikove 1992; Castillo et al. 2001) and modelled (Cardot et al. 2008; Holter & Urban 1992; Bannink et al.
1999; Khelil-Arfa et al. 2012; Winchester & Morris 1956; Appuhamy et al. 2014). However, many models use UN as input data or only predict daily UN averages, ignoring the known variability of N concentration, volume and diurnal frequency of daily individual urination events (Betteridge et al. 2013). The latter creates either under- or overestimations of UN, scaling errors, and thereby, false perceptions (good or bad) of particular grazing managements (Gregorini et al. 2018). Recently, Gregorini et al. (2018) developed a mechanistic and dynamic approach that simulated diurnal patterns of UN and drinking within MINDY. MINDY is a deterministic, mechanistic and dynamic model of a dairy cow. MINDY represents diurnal patterns of ingestion, digestion and metabolism, and production, as well as excretion based on explicit relationships among direct (ingestion, digestion and metabolism) and indirect (feeding environment) controls of motivation to feed. The model has been validated conceptually and statistically in all its developments, showing acceptable prediction errors with root-mean-square prediction error no greater than 25% of the observed mean (Gregorini et al. 2013; 2015; 2018).
The objective of this work was to simulate diurnal urination and UN patterns of grazing dairy cows as effected by grazing management and dietary content of PL. At the same resource allocation, the following effects were explored: 1) proportion of PL in the diet (as monoculture) on UN and urination patterns and 2) timing and frequency of allocating PL monocultures on UN and diurnal distribution of urinary N load onto the pastures.
Methods
The modelet al. 2018) was used for the objective and the purpose of this modelling study. MINDY is a cluster of seven models: 1) Molly models digestion, metabolism and production of a dairy cow (Baldwin 1995) as modified by (Gregorini et al. 2015); 2) diurnal fluctuations in feeding motivation; 3) sward canopy structure and herbage quality; 4) grazing behaviour; 5) dietary preference and forage selection; 6) foraging bioenergetics; and 7) drinking and urination behaviour. MINDY also integrates functional relationships between forage ingestion, oral physiology and swallowing, and rumen digestion responsible for variations in liquid outflows from the rumen.
MINDY can be initialized with unique characteristics, e.g., age, breed, BCS, high, body weight, genetic merit for milk production, calving date etc. Likewise, pasture and supplements can be chemically and physically (e.g., sward structure) designed and set by the user. In addition MINDY simulates spatio-temporal changes in herbage chemical composition, acknowledging the influence of herbage nutritive value change throughout the day and grazing strata.
Virtual experiments
Fourteen scenarios (treatments) were tested with MINDY [initialized as pregnant Friesian cows (500 kg live weight, 180 days in milk)] were grazed in February for 20 days. The treatment tested: 1) frequency of allocation by grazing PL or RG for 1, 5 or 10 consecutive days (1D, 5D, and 10D respectively) allocated either after the morning (AM) or afternoon (PM) milking; and, 2) the proportion of PL by offering either 25 or 50% of the diet as PL allocated either AM or PM. The sward structure and chemical composition of the simulated PL and RG monocultures were based on the data stored in MINDY’s feed composition table. The herbage mass of these swards was 3,000 kg DM/
ha, with a sward surface height (extended tiller) of 30 cm. The chemical composition of PL and RG herbage was: 154 and 170 g CP/ kgDM, 370 and 500 g NDF/ kgDM, 220 and 143 g of water-soluble carbohydrates (WSC); 130 and 190 g DM/ kg fresh matter, respectively, for PL and RG; and reflected the use of fertilizer applied at a level of 200 kg N/ha per year. Grazing areas at particular times of the day varied according to treatments.
Each simulation or treatment was run for 30 days, which included 10 days of ‘model adaptation/stabilization’, and the last 20 days of data collection. The outputs required from MINDY were: Milk solids production (MS = Fat+CP), N intake (NI), N in milk (NM), UN and faecal N (FN), N retained in lean tissue (muscle and gravid uterus, NR), urinary volume (UV), urinations per day (Ur/d) and N discharged onto pasture (NP) and milking shed (NSh) as proportion of total excretion. By default, in the model, the NI that is not partitioned to NM, UN, FN and NR is estimated to be recycled as urea in the rumen or as amino acid in the visceral tissue.
Diurnal fluctuations of UN concentration data were plotted using the smoothing function “gam” (Wickham 2009). Urine volume of individual urination event and and N load were plotted using the smoothing function “loess” (Wickham 2009) and all graphics were conducted with R (R Team 2017).
Results
Frequency and timing of PL allocation
Model outputs are presented in Table 1. Compared to RG, including PL in the diet increased DMI and N intake but reduced UN excretion irrespective of grazing management (Table 1). Partitioning of N into milk and dung was greater for PL than RG. Across all scenarios,
Table 1 Predicted effect of frequency and timing (AM versus PM) of plantain (PL) allocation on milk production, N intake, N excretion and urination behaviour of grazing dairy cows.
Variable1 PM AM
RG PL 1D 5D 10D RG PL 1D 5D 10D
DMI (kg/d) 16.21 20.64 21.48 19.96 19.16 16.30 20.00 20.22 19.21 18.61
MS (kg/d) 1.44 1.72 1.64 1.67 1.65 1.38 1.50 1.50 1.48 1.47
NM (kg/d) 0.08 0.10 0.09 0.09 0.09 0.07 0.08 0.08 0.08 0.08
NI (kg/d) 0.44 0.50 0.55 0.51 0.50 0.46 0.53 0.56 0.53 0.52
FN (kg/d) 0.14 0.20 0.21 0.19 0.18 0.14 0.20 0.20 0.19 0.18
UN (kg/d) 0.17 0.14 0.20 0.16 0.16 0.18 0.13 0.21 0.16 0.16
NR (kg/d) 0.04 0.04 0.05 0.05 0.06 0.05 0.09 0.05 0.08 0.07
NVR (kg/d) 0.01 0.02 0.00 0.02 0.01 0.02 0.03 0.02 0.02 0.03
UV (L) 41.33 37.75 56.16 44.61 42.38 42.35 37.32 56.99 51.91 49.39
Ur /d 12.00 13.00 21.00 15.00 14.00 13.00 15.00 26.00 23.00 21.00
(UN+FN)/NI 0.72 0.68 0.66 0.69 0.66 0.71 0.59 0.67 0.65 0.66
NM/NI 0.18 0.19 0.15 0.18 0.19 0.16 0.14 0.13 0.15 0.15
NSh 0.11 0.14 0.11 0.12 0.09 0.11 0.11 0.04 0.05 0.03
NP 0.89 0.86 0.89 0.88 0.91 0.89 0.84 0.96 0.95 0.97
New Zealand Journal of Animal Science and Production 2018. Vol 78: 151-156
153
allocating in AM compared with PM resulted in lower daily UN excretion but also lower milksolids yield. Alternating RG and PL feeding frequency, as with 1D, 5D and 10D treatments, resulted in greater urine volume compared with continuous feeding of either PL or RG – both of which had similar UV. Feeding PL on alternate days (1D) resulted in the greatest urine volume and urination frequency, greater UN and improved MS yield compared with RG.
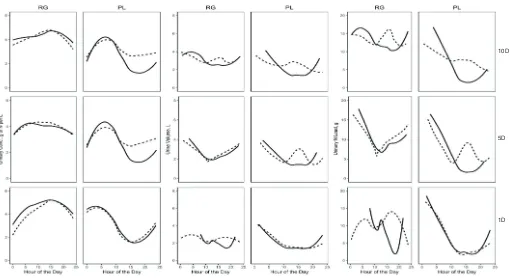
When swards were offered in the PM, there was no effect of frequency of PL allocation compared with RG on the proportion of urinary N deposited in the paddock (mean less than 90%). However, when swards were offered in AM, more than 95% of UN was deposited in the paddock for 1D, 5D and 10D feeding frequency. Continuous allocation of pure PL reduced NP compared with RG (85 vs 89%). The coefficient of variation of UN (16, 17%), UC (3, 6%) and NSh (10, 21%) for the mean of 1D, 5D and 10D in AM and PM suggests considerable effects of frequency×timing of PL allocation. Figure 1 reflects the effect of frequency and timing of PL allocation on diurnal changes of N loads (g). Dietary proportion and timing of PL allocation
Model outputs are presented in Table 2. Apparent NI was relatively lower when PL was 50 compared with 25% of the diet, and lower when offered in PM compared with AM. Despite the relatively small difference in apparent NI, predicted UN and UC were 139 and 157 g/d, and 3.6 and 3.9 g/L, respectively, when PL was allocated as 50 and 25% of the diets. Compared to AM, PM allocations of these PL proportions reduced MS by 3 and 5.6% and increased UN
Figure 1 Summary of predicted effect of frequency and timing of PL allocation on diurnal urination pattern and UN excretion of grazing dairy
cows (RG, ryegrass, PL, plantain; Every 1, 5 and 10 d, PL monoculture was grazed for 1, 5 and 10 consecutive days; AM and PM daily pasture
breaks of either RG or PL were allocated either after the morning [AM, solid lines] or afternoon [PM, dashed lines] milking)
Figure 1 Summary of predicted effect of frequency and timing of plantain (PL) and ryegrass (RG) monocultures allocation on diurnal urination pattern and UN excretion of grazing dairy cows. Frequency: monocultures of either PL or RG were grazed for 1, 5 or 10 days consecutive days (1D, 5D and 10D). Daily pasture breaks of each monoculture were either allocated after the morning or afternoon milking (AM and PM, respectively).
Table 2 Predicted effect of timing of and dietary proportion of PL allocation on milk production, N intake, N excretion and urination behaviour of grazing dairy cows
Variable1 PM AM
PL50 PL25 PL50 PL25
DMI (kg/d) 16.43 16.99 16.91 17.95
MS (kg/d) 1.39 1.39 1.42 1.43
NM (kg/d) 0.07 0.07 0.08 0.08
NI (kg/d) 0.44 0.47 0.45 0.48
FN (kg/d) 0.15 0.15 0.16 0.16
UN (kg/d) 0.15 0.17 0.13 0.14
NR (kg/d) 0.05 0.06 0.06 0.07
NVR (kg/d) 0.02 0.02 0.02 0.02
UV (L) 38.45 41.14 37.29 38.24
Ur /d 12.48 12.87 12.24 13.09
(UN+FN)/NI 0.67 0.68 0.65 0.62
NM/NI 0.17 0.17 0.16 0.16
NSh 0.17 0.10 0.12 0.10
NP 0.83 0.90 0.88 0.90
1DMI, dry matter intake; MS, milksolids production; NM, N in milk; NI, N intake; FN, fecal N; UN, urinary N; NR, N retained in the body; NVR, estimated N incorporated in viscera tissue and re-cycled as urea in the rumen; UV, urine volume; Ur/d, daily urina-tion frequency; NSh, proporurina-tion of UN deposited on the milking shed surface; and NP, proportion of UN deposited onto pasture.
and UC by 7 and 15% and 4.5 and 9%, respectively. Figure 2 presents the effect of dietary proportion and timing of PL allocation on diurnal changes of N loads (g).
10D
5D
urination pattern and UN excretion of grazing dairy cows. (100RG, 100%ryegrass, 100PL,
100% plantain; 25PL, 25% plantain; 50PL, 50% plantain; AM and PM daily pasture breaks
of either 100RG or PL were allocated either after the morning [AM, solid lines] or afternoon
[PM, dashed lines] milking)
Discussion
At the same amount of resource allocation (i.e., kg forage DM), this modelling study explored the effect of dietary content, timing and frequency of PL monocultures allocation on UN and diurnal pattern of urination. Based on the present predictions of MINDY, we accept that hypothesis and suggest that: It is not only the dietary content of PL, but also how we graze it…
MINDY predicted marked reductions in UN and an increase in FN when grazing monocultures of PL as compared to RG (both PM and AM), even though NI increased (as a product of grater DMI) with PL (Table 1). As expected, PL reduced UC also (Figure 2). These predictions are supported by Bryant et al. (2017) and Box et al. (2017), who reported considerable reductions in UC by dairy cows consuming increasing proportions of PL. Interestingly, grazing PL monoculture, did not increase UV, if anything it caused a small reduction (Table 1 and 2). Lower UV is related to less drinking water from troughs, because of more water consumption with the forage (Church 1988; Gregorini et al. 2018). Plantain has lower DM content
than does RG, especially in summer, as in our simulations. Increments in frequency of urination (Ur/d), are related to faster rumen outflows of water, and faster urine inflows from kidneys to bladder (Andersson & Arner 2004; Gregorini et al. 2018). These phenomena not only relate to greater water ingestion, but also inflows of minerals (ash) into the rumen changing osmotic pressure and water dynamics in the rumen (Gregorini et al. 2015; 2018).
Increasing proportion of PL in the diet, as is shown in Figure 2, reduced UC considerably, which counteracted the lower UV and ended up in MINDY predicting considerably lower loads UN as PL proportion increased for both AM and PM. However, allocating PL or proportions of it in the AM had a greater benefit, i.e., reduction UN load (Figure 2), as supported by the N-use efficiency [(UN+FN)/NI] presented in Table 2. These results can be explained as followed: Allocating PL or proportions of it in the AM increases rumen digesta outflow rate in the morning and noon, allowing greater intake of DM in the afternoon when RG has greater content of WSC and less CP, as shown in Table 1 for PL allocated AM vs PM.
New Zealand Journal of Animal Science and Production 2018. Vol 78: 151-156
155
To the knowledge of the authors, there is no data on the effect of frequency of PL allocation on milk production or N excretion. Therefore, the results of this study are the first of their kind. On average (whole simulation run), as frequency of PL allocation was reduced (E1 to E10), MINDY predicted a marked reduction in UN and UV and an increasing ratio FN:UN. Reductions in UN related to the decrease in DM and N intake. Interestingly, less- frequent PL allocation did not seem to reduce MS production by a great magnitude. In addition to this trend, timing of herbage allocation had an effect on these variables. As frequency of PL allocation was reduced, allocating it in the AM increased the volume and the frequency of urination, and consequently UC. Nitrogen deposited onto pasture increased with less-frequent and AM allocations of PL. The magnitude of these effects, however, was very low.
At the same frequency of PL allocation, PM grazing increased MS production and NM/NI. Several works reporting increments in milk and beef production with cattle allocated to the pasture in the afternoon support these results (Gregorini 2012). From dawn to dusk, the nutritive value of herbage increase, and one of the main changes is the reduction of CP to WSC ratio. Gregorini et al. (2008) reported greater microbial yield and flow to the duodenum of cattle allocated herbage in the PM. Vibart et al. (2017) reported that grazing dairy cows allocated to pasture in the PM had a greater N-use efficiency, deviating more N to the milk. The latter supports MINDY’s prediction of NM/NI (Table1). Thus, MINDY’s prediction suggests that allocating PL less frequently and in the PM will produce more MS, with more N in it, and consequently less environmental impact per kg of MS. Moreover, allocating PL in the PM increases NSh and reduced NP significantly, as compared to AM (Table 1).
Overall, these results suggests that, at the same resource allocation, managing the frequency and timing of PL allocation can even further reduce environmental impact.
Conclusions
This study supports the premise that including PL in the diet of cattle reduces UN and UC, but suggests that it is not only the dietary content of PL, but also the frequency and timing of its allocation, which can help to reduce environmental impact further while maintaining or increasing MS.
Acknowledgements
This study was completed as part of the Forages for Reduced Nitrate Leaching programme with principal funding from the New Zealand Ministry of Business, Innovation and Employment. The programme is a partnership between DairyNZ, AgResearch, Plant & Food Research, Lincoln University, Foundation for Arable Research and Landcare Research.
References
Andersson KE, Arner A 2004. Urinary bladder contraction and relaxation: physiology and pathophysiology. Physiological Reviews 84: 935-986.
Appuhamy J, Wagner-Riddle C, Casper D, France J, Kebreab E 2014. Quantifying body water kinetics and fecal and urinary water output from lactating holstein dairy cows. Journal of Dairy Science 97: 6177-6195.
Baldwin R 1995. Modeling ruminant digestion and metabolism. Chapman & Hall, London, UK.
Bannink A, Valk H,Van Vuuren A 1999. Intake and excretion of sodium, potassium, and nitrogen and the effects on urine production by lactating dairy cows. Journal of Dairy Science 82: 1008-1018.
Betteridge K, Costall D, Li F, Luo D, Ganesh S 2013. Why we need to know what and where cows are urinating–a urine sensor to improve nitrogen models. Proceedings of the New Zealand Grassland Association, pp. 119-124.
Box LA, Edwards GR, Bryant RH 2017. Milk production and urinary nitrogen excretion of dairy cows grazing plantain in early and late lactation. New Zealand Journal of Agricultural Research 60: 470-482. Bryant R, Miller M, Greenwood S, Edwards G 2017. Milk
yield and nitrogen excretion of dairy cows grazing binary and multispecies pastures. Grass and Forage Science 72: 806-817.
Cardot V, Le Roux Y, Jurjanz S 2008. Drinking behavior of lactating dairy cows and prediction of their water intake. Journal of Dairy Science 91: 2257-2264. Castillo A, Kebreab E, Beever D, Barbi J, Sutton J,
Kirby H, France J 2001. The effect of protein supplementation on nitrogen utilization in lactating dairy cows fed grass silage diets. Journal of Animal Science 79: 247-253.
Church DC 1988. The ruminant animal. Digestive physiology and nutrition. Prentice Hall.
Gregorini P 2012. Diurnal grazing pattern: its physiological basis and strategic management.
Animal Production Science 52: 416-430.
Gregorini P, Beukes PC, Romera AJ, Levy G, Hanigan MD 2013. A model of diurnal grazing patterns and herbage intake of a dairy cow, MINDY: Model description. Ecological Modelling 270: 11– 29. Gregorini P, Villalba JJ, Provenza FD, Beukes PC, Forbes
JM 2015. Modelling preference and diet selection patterns by grazing ruminants. Animal Production Science 55: 360-375.
Gregorini P, Beukes P, Waghorn G, Pacheco D, Hanigan M 2015. Development of an improved representation of rumen digesta outflow in a mechanistic and dynamic model of a dairy cow, Molly. Ecological Modelling 313: 293-306.
Holter J, Urban Jr W 1992. Water partitioning and intake prediction in dry and lactating Holstein cows. Journal of Dairy Science 75: 1472-1479.
Khelil-Arfa H, Boudon A, Maxin G, Faverdin P 2012. Prediction of water intake and excretion flows in Holstein dairy cows under thermoneutral conditions. Animal 6: 1662-1676.
Murphy M 1992. Water metabolism of dairy cattle. Journal of Dairy Science 75: 326-333.
Nobilly F, Bryant RH, McKenzie BA, Edwards GR Productivity of rotationally grazed simple and diverse pasture mixtures under irrigation in Canterbury. Proceedings of the New Zealand Grassland Association 75: 165-172
Provenza F, Gregorini P, Carvalho PdF 2015. Synthesis: foraging decisions link plants, herbivores and human beings. Animal production Science 55: 411-425.
Silanikove N 1992. Effects of water scarcity and hot environment on appetite and digestion in ruminants: a review. Livestock Production Science 30: 175-194. Team RC 2017. : R, a language and environment for
statistical computing. R Foundation for Statistical Computing, Vienna, Austria.
Totty V, Greenwood S, Bryant R, Edwards GR 2013. Nitrogen partitioning and milk production of dairy cows grazing simple and diverse pastures. Journal of Dairy Science 96: 141-149.
Vibart RE, Tavendale M, Otter D, Schwendel BH, Lowe K, Gregorini P, and Pacheco D 20017. The effects of time of allocation of a ryegrass-based pasture on milk production, milk composition, nitrogen utilization, and grazing behavior of late-lactation dairy cows. Journal of Dairy Science 100: 5305–5318
Wickham 2009. GGPLOT2: Elegant graphics for data analysis. Springer-Verlag, New York.