OPTIMIZATION OF MICROWAVE ASSISTED EXTRACTION OF PHENOLIC COMPOUNDS FROM DECALEPIS HAMILTONII ROOT USING RESPONSE SURFACE METHODOLOGY
7
0
0
Full text
(2) Krishna Murthy T P et al. Int. Res. J. Pharm. 2015, 6 (11) The roots are largely used in making pickles along with lime and also in the preparation of health drink (Nayar et al., 1978; Nayak et al., 2010) The optimization of microwave-assisted extraction of phenolic compounds from Decalepis hamiltonii root was conducted in the present study with the objective of recovering maximum phenolic and flavonoids content. Response surface methodology (RSM) was used to evaluate the effect of multiple factors like extraction time, ethanol concentration and solid to solvent ratio. MATERIALS AND METHODS Sample Preparation The roots Decalepis hamiltonii were procured from Local Market, Malleshwaram, Bangalore, India. The roots were repeatedly washed with tap water and dried in shade for about 2-3 days. The dried sample was grounded using a domestic grinder to obtain powder. The powder was then separated into different particle size fractions using a set of sieves in a laboratory sieve shaker (M/s Muhlenbau, Germany).. extraction of total phenolic content and total flavonoid content were optimized using response surface methodology and Box-behnken design was employed in this regard. Extraction of time (X1), solid to solvent ratio (X2) and ethanol concentration (X3) were selected as independent variables. The experimental design is presented in Table 1 with coded and uncoded values of selected variables. The experimental design consists of 12 factorial experiments and 3 replicates of the central point. Determination of Total Phenolic Content Total phenolic content (TPC) assay was performed according to method of Singleton and Rossi using Folin-Ciocalteu reagent with some modifications. 0.5 ml of pre diluted extracts was mixed with 2.5 ml of 1:10 diluted Folin-Ciocalteu reagent and after 4 min 2 ml (75g/l) of sodium carbonate was added into reaction mixture. Absorbance was taken using UV- Spectrophotometer against blank at 725 nm after incubation for one hour at room temperature. Gallic acid was used as standard and total phenolic content of the extracts were expressed as milligram of gallic acid equivalent (GAE)/mg of dry Decalepis hamiltonii root powder (Sushma et al., 2014). Determination of Total Flavonoid Content. Chemicals and Reagents Ethanol used for the extraction studies was analytical grade. Aluminium chloride, Sodium hydroxide and Folin-Ciocalteau were obtained from SDFCL. Gallic acid and Rutin was purchased from Sigma-Aldrich Company Ltd. Sodium nitrate and Sodium bi-carbonate were purchased from Merck specialties private limited. The water used for the extraction and analysis was triple distilled water. Extraction and Experimental Design Microwave assisted extraction of polyphenolic compounds was carried in domestic digital microwave oven (LG,India; Model MC-8087ABR) at constant microwave power of 360 Watts. All the experiments were conducted in 100 ml of conical flask with the solvent volume of 25 ml. The rotating plate provides equal distribution of microwave radiation energy throughout the flask. The effect of selected operating parameters on microwave assisted. Total flavonoids were determined by the aluminum chloride colorimetric assay. 0.5 ml of diluted extract was mixed with 2 ml of distilled water and subsequently with 0.15 ml of a 5% NaNO2 solution. After 6 min, 0.15 ml of a 10% AlCl3 solution was added and allowed to stand for 6 min, then 2ml of 4% NaOH solution was added to the mixture. Water was added immediately to bring the final volume to 5 ml, and then the mixture was thoroughly mixed and allowed to stand for another 15 min. Absorbance of the mixture was determined at 510 nm versus a prepared blank. Rutin was used as standard compound for the quantification of total flavonoids. All values were expressed as milligrams of rutin equivalent per milligram Decalepis hamiltonii root powder (Mathew et al., 2013). Statistical Analysis The behavior of the system was explained by second order quadratic polynomial model. The mathematical model corresponding to the Box–behnken design was. Eq. 1 Where Y was the predicted total phenolic content and total flavoinoid content, β0 was the intercept, β1, β2, β3were linear coefficients, β4, β5, β6 were quadratic coefficients, β7, β8, β9 were interaction coefficients and ε was random error. Data analysis tool in Microsoft Excel 2010® was used to analyze the experimental results of the response surface designs and KY Plot 2.0 was used to generate response surface graphs. The adequacy of the model was determined by evaluating the lack of fit, coefficient of determination (R2) and the Fisher test value. (F-value) obtained from the analysis of variance (ANOVA) that was generated. Differences were considered significant if P <0.05. SOLVER function of the MS-Excel-2010® software was used to search for optimum yield within the range of variables. To confirm the optimum results predicted by the RSM model, experimental runs were carried out in triplicate under the predicated optimized conditions (Murthy & Manohar, 2014).. Table 1. Codes and levels of independent variables in RSM design Independent Variable Time (min) Solid: Solvent Ratio (gm/25 ml) Ethanol Concentration (%). Symbols X1 X2 X3. -1 1 0.5 30. Coded values 0 3 1.75 60. 1 5 3 90. 745.
(3) Krishna Murthy T P et al. Int. Res. J. Pharm. 2015, 6 (11) Table 2. Experimental and predicted data for the TPC and TFC obtained from Box–behnken design. Coded Values. Uncoded Values. TPC (mg GAE/mg DHRP). TFC (mg RE/mg DHRP). Sl.No X1 X2 X3 X1 X2 X3 Y(Exp) Y(Pre) Y(EXP) Y(Pre) ε ε -1 1 0 1 3.00 60 0.0147 0.0146 1.28E-04 0.0745 0.0731 1.42E-03 1 2 -1 -1 0 1 0.50 60 0.0050 0.0057 -7.02E-04 0.0274 0.0329 -5.48E-03 3 -1 0 -1 1 1.75 30 0.0108 0.0111 -3.49E-04 0.0565 0.0554 1.03E-03 -1 0 1 1 1.75 90 0.0068 0.0059 9.24E-04 0.0355 0.0324 3.03E-03 4 0 1 -1 3 3.00 30 0.0266 0.0264 2.21E-04 0.0671 0.0695 -2.45E-03 5 6 0 -1 1 3 0.50 90 0.0161 0.0163 -2.21E-04 0.0218 0.0194 2.45E-03 7 0 -1 -1 3 0.50 30 0.0169 0.0159 1.05E-03 0.0268 0.0223 4.45E-03 0 0 0 3 1.75 60 0.0281 0.0281 1.39E-17 0.0607 0.0607 -2.08E-17 8 0 1 1 3 3.00 90 0.0204 0.0214 -1.05E-03 0.0510 0.0554 -4.45E-03 9 10 0 0 0 3 1.75 60 0.0281 0.0281 1.39E-17 0.0607 0.0607 -2.08E-17 11 0 0 0 3 1.75 60 0.0281 0.0281 1.39E-17 0.0607 0.0607 -2.08E-17 1 0 1 5 1.75 90 0.0104 0.0101 3.49E-04 0.0402 0.0413 -1.03E-03 12 13 1 1 0 5 3.00 60 0.0155 0.0148 7.02E-04 0.0743 0.0688 5.48E-03 14 1 0 0 5 0.50 60 0.0079 0.0080 -1.28E-04 0.0244 0.0258 -1.42E-03 15 1 -1 -1 5 1.75 30 0.0085 0.0095 -9.24E-04 0.0322 0.0353 -3.03E-03 X1-Time of extraction, min; X2-Solid to solvent ratio (gm/25ml of solvent); X3-Ethanol Concentration (%); Yexp-Experimental yield; Ypre-Model predicted yield; ε-residuals (Yexp-Ypre) Table 3. Regression Statistics and Analysis of variance (ANOVA) for TPC and TFC. TPC. Regression Residual Total. TFC. Regression Statistics Multiple R R Square Adjusted R Square Standard Error Observations ANOVA. Regression Residual Total. TPC 0.9972 0.9945 0.9846 0.0010 15.0000 df 9 5 14 df 9 5 14. TFC 0.9860 0.9722 0.9221 0.0052 15.0000. SS 0.000953 5.28E-06 0.000958 SS 0.004767 0.000136 0.004903. MS 0.000106 1.06E-06. F 100.3109. Significance F 4.14E-05. MS 0.00053 2.73E-05. F 19.41931. Significance F 0.00224. Table 4. Regression coefficient of polynomial functions of response surface of total phenolic content and total flavonoid content.. A0 A1 A2 A3 A4 A5 A6 A7 A8 A9. Coefficients -0.03407 0.020373 0.013136 0.000601 -0.00352 -0.00206 -5.4E-06 -0.00021 2.42E-05 -3.6E-05. TPC Standard Error 0.003493 0.001034 0.001604 8.04E-05 0.000134 0.000342 5.94E-07 0.000205 8.56E-06 1.37E-05. t Stat -9.75168 19.70405 8.188509 7.476337 -26.3626 -6.02902 -9.10275 -1.02031 2.828402 -2.62394. P-value 0.000193 6.22E-06 0.000442 0.000676 1.47E-06 0.001807 0.000268 0.354385 0.036744 0.046875. Coefficients -0.01866 -0.00083 0.031423 0.001497 -0.00139 -0.00319 -1.6E-05 0.000285 0.000121 -7.4E-05. TFC Standard Error 0.01776 0.005256 0.008156 0.000409 0.000679 0.001739 3.02E-06 0.001044 4.35E-05 6.96E-05. t Stat -1.05085 -0.15817 3.852921 3.66423 -2.04357 -1.83647 -5.16505 0.273298 2.774896 -1.06561. P-value 0.341441 0.880511 0.011966 0.014531 0.09643 0.125717 0.00357 0.795553 0.039138 0.335329. Table 5. Experimental and predicted values of TPC and TFC under optimum conditions.. TPC TFC. Time. Solid: Solvent Ratio. 3.00 2.15. 2.56 3.00. Ethanol Concentration (%) 53.77 49.18. Experimental. Predicted. % Error. 0.0302 0.0813. 0.0295 0.0782. 2.28 3.80. 746.
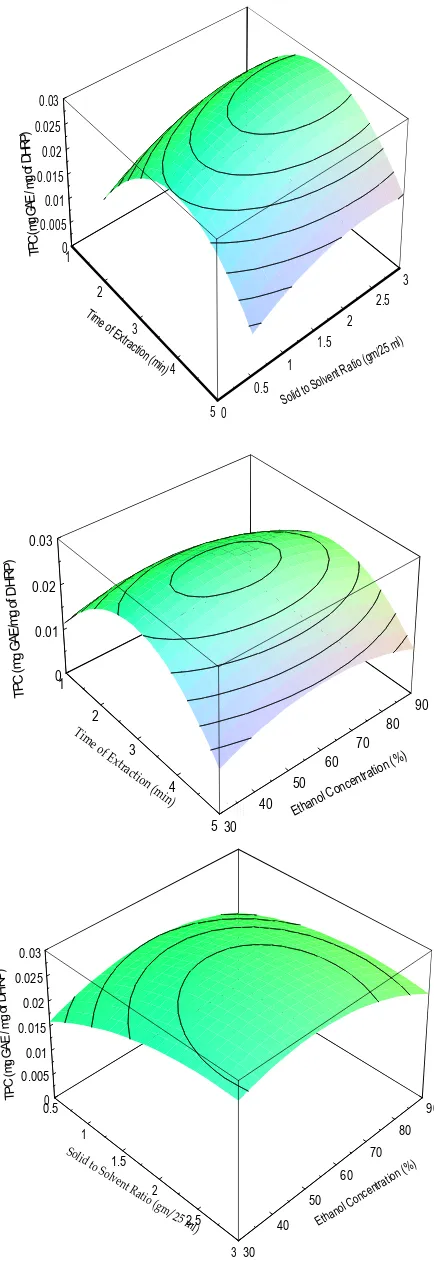
(4) Krishna Murthy T P et al. Int. Res.T iJ.t l e Pharm. 2015, 6 (11). 0.03 DHRP) TPC(mgGAE/ mgof. 0.025 0.02. 0.015 0.01. 0.005 0 1 3. 2 Tim eo. 2.5 fE 3 xtra ctio n. 2 1.5. (mi n) 4. 1 0.5 50. d Soli. o to S. l) 25 m gm/ tio ( a R t lven. DHRP). 0.03. of TPC (mg GAE/mg. 0.02 0.01 0 1 90. 2. Ti m eo. 80 fE. xt r. 70. 3. act. ion. 60 50. (m 4 in). ano Eth. T i t l e 40 5 30. l. i trat cen C on. on (. %). g of TPC (mg GAE / m. DHRP). 0.03 0.025 0.02 0.015 0.01 0.005 0 0.5. 90 So l. 80. 1 id t. o S 1.5 o lv ent Rat 2 io ( gm /2 5. 70 60 50 m2.5 l). 40. ano Eth. lC. rati ent onc. on. ) (%. 3 30. Figure 1. Response surface graphs illustrating the effect of (a) time of extraction and solid to solid ratio (b) time of extraction and ethanol concentration and (c) solid to solvent ratio and ethanol concentration on total phenolic content (TPC).. 747.
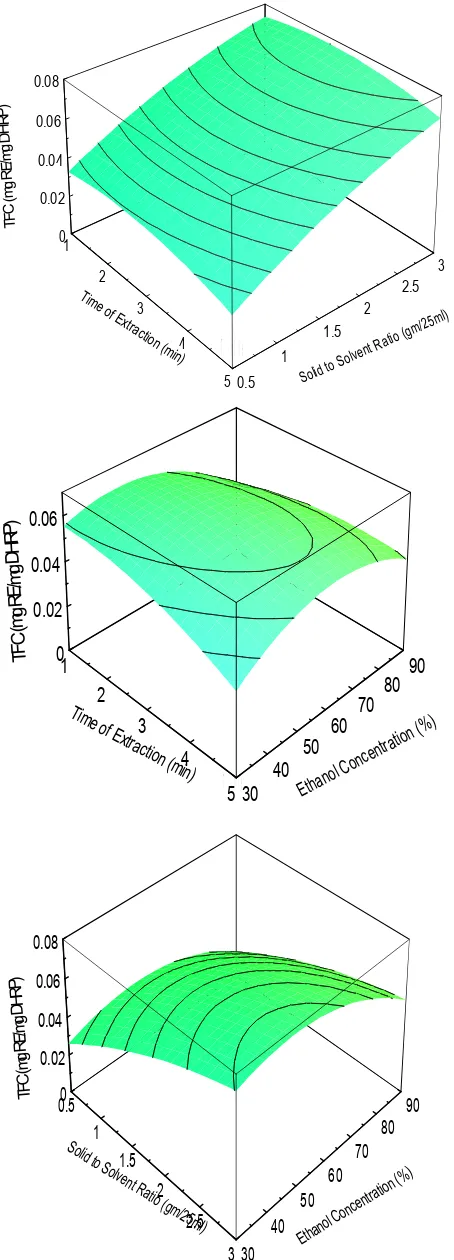
(5) t le Krishna Murthy T P et al. Int. Res. J.T i Pharm. 2015, 6 (11). ) TFC (mg RE/mg DHRP. 0.08 0.06 0.04 0.02 0 1 3. 2 Ti m eo. 2.5 fE 3 xtra ctio n. 2 (mi 4 n). T it le. 1.5 1. 5 0.5. d to So li. So lv. e nt. o( R a ti. g m /2. 5 ml). TFC(mgRE/mgDHRP). 0.06 0.04 0.02 0 1 2. Tim e of. Extr 3. acti on ( 4 min ). T it le 5 30. 40. 50 Etha. 60 nol. 70. 80. 90. n atio entr c n Co. ( %). P) TFC(mgRE/mgDHR. 0.08 0.06 0.04 0.02 0 0.5 Soli d. 90 80. 1. 70. to S 1.5 olve nt R atio2 (gm /25m 2.5l). 60 50 40 3 30. ano Eth. l Co. nc. (%) ion t a r ent. Figure 2. Response surface graphs illustrating the effect of (a) time of extraction and solid to solid ratio (b) time of extraction and ethanol concentration and (c) solid to solvent ratio and ethanol concentration on total flavonoid content (TFC). 748.
(6) Krishna Murthy T P et al. Int. Res. J. Pharm. 2015, 6 (11) RESULT AND DISCUSSION Extraction Model and Statistical Analysis The microwave assisted extraction efficiency of polyphenols from plant materials may get affected by parameters such as microwave power, extraction time, solvent type, composition of solvent, solvent to solid ratio, soaking time, particle size of sample and extraction cycles. In this present investigation, the relationship between yield of polyphenols extraction and the process variables (extraction time, solid to solvent ratio and ethanol concentration) were identified by three factors Box-behnken design and further process variables were optimized. There were a total of 15 experimental runs for optimizing the three selected variables. The range of extraction parameters chosen in this study were based on preliminary experiments. The influence the extraction include extraction time (X1; 1–5 min), Solid: Solvent Ratio (X2; 0.5-3 gm/25 ml), Ethanol Concentration (X3; 30-90). Since the variables have different units and ranges, each of the variables must first be normalised and forced to arrange from-1 to +1 in order to obtain a more even response (Bas & Boyac, 2007; Setyaningsih et al., 2015). The different combinations of the independent variables and their experimentally measured predicted response in terms of Total Phenolic Content and Total Flavonoid Content are presented in Table 2. The analysis of variance (ANOVA) of yield of TPC and TFC extraction yield and regression statistics showed that experimental data had correlation coefficient (R2) of 0.9945 and 0.9722 for TPC and TFC respectively with the calculated model suggesting that the model was well fitted and could be used to predict the total phenols from microwave-assisted DHRP extract. Table 3 indicates that the model is highly significant, which is evident from the high Fisher (F) ratio value. Effect of Extraction on Total Phenolic content and Total Flavonoid Content The coefficients of the response surface model as provided by Eq. 1 were evaluated for TPC and TFC. The final predictive equation constants obtained for TPC and TFC were given in Table 4.The effect of extraction time, solid to solvent ratio and ethanol concentration on TPC were also shown in response plots (Figure 1). In the present study the effects of linear terms and quadratic terms on extraction of TPC were highly significant as p < 0.001. There was no significant effect of interaction between extraction time and extraction temperature but interaction between extraction time and ethanol concentration and that of ethanol concentration and solid to solvent ratio were found to be significant (p < 0.05). The effect of extraction conditions on total flavonoid content is shown in Figure 2. The effect of linear terms, quadratic and interaction terms are highly significant on the extraction of total flavonoid content at given experimental conditions. A positive sign of the coefficient means a synergistic effect, while a negative sign represents an antagonistic effect (Karimi et al., 2012). Optimization of Microwave Assisted Extraction Parameters and Validation of Model Optimization of process variables is one the important steps in design and analysis of experiments. The main objective of the experimentation is to find the levels of factors which optimize response. The process parameters selected in this study was optimized using the SOLVER function of MS-Excel-2010®software. The predicted optimum time, solid to solvent ratio and ethanol concentration was found to be 3 min, 2.56 g/25 ml and 53.77 %respectively. The predicted yield to be 0.03 mg GAE/mg DHRP of total phenolic content. For extraction of Total Flavonoid Content the Optimum conditions of time, solid to solvent ratio and ethanol. concentration to be were found to be 2.15 min, 3 g/25 ml and 49.18% respectively. The predicted yield was 0.079 mg RE/ mg DHRP. Three trials of the experiment were conducted at optimum conditions and average values are presented in Table 5. The experimental results were showing 2.28 % and 3.8 % error predicted yield for TPC and TFC respectively. This shows that optimization is reliable in the present study. CONCLUSION In the present study microwave assisted extraction process was optimized for the extraction of polyphenols from Decalepis hamiltonii powder using three levels of Box-behnken design. MAE was found to be a viable alternative to traditional solvent extraction techniques for the recovery of polyphenols from Decalepis hamiltonii. The high correlation of the mathematical model indicated that a quadratic polynomial model could be employed to optimize the microwave assisted extraction of polyphenols. Under the optimum conditions, total phenolic content and total flavonid content obtained was 0.03mg GAE/mg DHRP and0.079 mg RE/ mg DHRP respectively. The optimum conditions of time, solvent to solid ratio and ethanol concentration for TFC and TPC was found to be 3 min, 2.56g/25 ml, 53.77 % and 2.15 min, 3 g/25 ml, 49.18% The experimental results were showing 2.28 % and 3.8 % error predicted yield for TPC and TFC respectively. REFERENCES 1. Mariat George, S. John Britto. Phytochemicaland antioxidant studies on the essential oil of the rhizome of Curcuma aeruginosa Roxb. Int. Res. J. Pharm. 2015; 6(8):573-579 http://dx.doi.org/10.7897/2230-8407.068113 2. Hayat, Khizar, Sarfraz Hussain, Shabbar Abbas, Umar Farooq, Baomiao Ding, Shuqin Xia, Chengsheng Jia, Xiaoming Zhang, Wenshui Xia. Optimized microwave-assisted extraction of phenolic acids from citrus mandarin peels and evaluation of antioxidant activity in vitro, Separation and Purification Technology 2009; 70(1):63-70. 3. Ajila CM, Brar SK, Verma M, Tyagi RD, Godbout S, Valero JR. Extraction and analysis of polyphenols: recent trends. Critical reviews in biotechnology 2011; 31(3):227-49. 4. Dahmoune F, Nayak B, Moussi K, Remini H, Madani K. Optimization of microwave-assisted extraction of polyphenols from Myrtuscommunis L. leaves, Food chemistry 2015; 166:585-95. 5. Kaufmann B, Christen P. Recent extraction techniques for natural products: microwave‐assisted extraction and pressurised solvent extraction, Phytochemical analysis 2002; 13(2):105-113. 6. Chandrasekar, Vaishnavi MF, San Martín‐González, Peter Hirst, Tameshia S, Ballard. Optimizing Microwave‐Assisted Extraction of Phenolic Antioxidants from Red Delicious and Jonathan Apple Pomace, Journal of Food Process Engineering 2015; 38(6):571–82. 7. Ballard TS, Mallikarjunan P, Zhou K, O’Keefe S. Microwave-assisted extraction of phenolic antioxidant compounds from peanut skins. Food Chemistry 2010; 120(4):1185-92. 8. Ilaiyaraja N, Likhith KR, Babu GS, Khanum F. Optimisation of extraction of bioactive compounds from Feronialimonia (wood apple) fruit using response surface methodology (RSM). Food chemistry 2015; 173:348-54. 9. Alberti A, Zielinski AAF, Zardo DM, Demiate IM, Nogueira A, Mafra LI. Optimisation of the extraction of phenolic compounds from apples using response surface methodology. Food chemistry 2014; 149:151-58. 10. Zhang YL, Kong LC, Yin CP, Jiang DH, Jiang JQ, He J, Xiao WX. Extraction optimization by response surface methodology, purification and principal antioxidant metabolites of red pigments. 749.
(7) Krishna Murthy T P et al. Int. Res. J. Pharm. 2015, 6 (11). 11.. 12.. 13.. 14.. 15.. extracted from bayberry (Myricarubra) pomace. LWT-Food Science and Technology (2013); 51(1): 343-47. Nayaka MH, Sathisha UV, Dharmesh SM. Cytoprotective and antioxidant activity of free, conjugated and insoluble-bound phenolic acids from swallow root (Decalepis hamiltonii). Food chemistry 2010; 119(4):1307-1312. Srivastava A, Rao LJM, Shivanandappa T. Isolation of ellagic acid from the aqueous extract of the roots of Decalepis hamiltonii: Antioxidant activity and cytoprotective effect. Food chemistry 2007; 103(1): 224-33. Nayar RC, Shetty JP, Mary Z, Yoganarasimhan SN. Pharmacognostical studies on the root of Decalepis hamiltonii Wt. and Arn., and comparison with Hemidesmus indicus (L.) R. Br. In Proceedings of the Indian Academy of Sciences-Section B, Springer India 1978; 87(2):37-48. Sushma R, Dharini H, Sadiya Tabassum, Krishna Murthy TP, Bhavya S G, Manjunath Dammalli. Research Journal of Pharmaceutical, Biological and Chemical Sciences Extraction of Polyphenols from Decalepis hamiltonii Root, Optimization Of Batch Extraction Process Parameters 2014; 5(4): 624. Mathew BB, Shajie D, Wadhwa N, Murthy NK, Murthy TPK, Rashmi M. Comparative antioxidant efficacy of Citrus limonum pulp and peel–An in vitro study, Drug Invention Today 2013; 5(4):296-301.. 16. Murthy TPK, Manohar B. Optimization of supercritical carbon dioxide extraction of phenolic compounds from mango ginger rhizome (Curcuma amadaroxb.) using response surface methodology, Biomedicine and Biotechnology 2014; 2(1):14-19. 17. Baş D, Boyac, İH. Modeling and optimization I: Usability of response surface methodology, Journal of Food Engineering 2007; 78(3):836-45. 18. Setyaningsih W, Saputro IE, Palma M, Barroso CG. Optimisation and validation of the microwave-assisted extraction of phenolic compounds from rice grains, Food chemistry 2015; 169: 141-49. 19. Karimi F, Rafiee S, Taheri-Garavand A, Karimi M. Optimization of an air drying process for Artemisia absinthium leaves using response surface and artificial neural network models, Journal of the Taiwan Institute of Chemical Engineers 2012; 43(1):29-39. Cite this article as: Krishna Murthy T P, Bhavya S G, Mamatha M, Blessy B Mathew, Manjunath Dammalli. Optimization of microwave assisted extraction of phenolic compounds from Decalepis hamiltonii root using response surface methodology. Int. Res. J. Pharm. 2015; 6(11):744-750 http://dx.doi.org/10.7897/2230-8407.0611145. Source of support: Nil, Conflict of interest: None Declared Disclaimer: IRJP is solely owned by Moksha Publishing House - A non-profit publishing house, dedicated to publish quality research, while every effort has been taken to verify the accuracy of the content published in our Journal. IRJP cannot accept any responsibility or liability for the site content and articles published. The views expressed in articles by our contributing authors are not necessarily those of IRJP editor or editorial board members.. 750.
(8)
Figure
Related documents
In addition, antioxidant potentials were determined spectrophotometrically through the DPPH assay, Ferric ion (Fe +3 ) reducing antioxidant power assay, Ferric (Fe +3 )
Spectacle accuracy (pro- portion of children with absolute power of vector difference between cycloplegic refraction and power of current spectacles in the better-see- ing eye ⱕ 1 D)
In Table 3, the Bayes-Stein strategy, “bs,” has a lower out-of-sample Sharpe ratio than the 1/N strategy for all the datasets except “MKT/SMB/HML” and “FF-4-factor,” and even
Es muss jedoch beachtet werden, dass eine länger andauernde Hyperglykämie beim Hund auch zur Zerstörung der β -Zellen führt (IMAMURA et al., 1988), und damit ein IRD auch zum
We developed a new package named fastclime , for solving linear programming problems with a relaxation parameter and high dimensional sparse precision matrix estimation. We plan
In order to optimize the interconnectivity of a small or medium-size ISP, the approach needs AS- level topology information, measurement information about the number of
An online tool for evaluating diagnostic and prognostic gene expression biomarkers in bladder cancer
Specifically, BC-BET calculates how strongly a gene ’ s expression is associated with tumor presence (distinguishing tumor from normal samples), tumor grade (distinguishing low-
