University of Pennsylvania
ScholarlyCommons
Publicly Accessible Penn Dissertations
2019
Adult Health And Mortality In The United States
Yana Vierboom
University of Pennsylvania, yvierboom@gmail.com
Follow this and additional works at:https://repository.upenn.edu/edissertations Part of theDemography, Population, and Ecology Commons
This paper is posted at ScholarlyCommons.https://repository.upenn.edu/edissertations/3383 For more information, please contactrepository@pobox.upenn.edu.
Recommended Citation
Vierboom, Yana, "Adult Health And Mortality In The United States" (2019).Publicly Accessible Penn Dissertations. 3383.
Adult Health And Mortality In The United States
Abstract
Good health is the cornerstone of a happy and productive life. Unfortunately, health is not distributed evenly among and within populations. This dissertation contains three chapters on adult health and mortality in the contemporary United States, paying special attention to social inequalities therein. Together, the chapters make both substantive and methodological contributions to the field of demography. In the first chapter, I use data from the National Health and Nutrition Examination Survey (NHANES) to consider the role of
educational differences in weight history in shaping educational disparities in all-cause mortality over the period 1988-2010. I find that 10-12% of educational mortality differences are driven by the higher likelihood of groups with less formal schooling to have weighed more in the past. In the second chapter, I combine data from vital registration and the National Health Interview Survey (NHIS) to produce the first estimates of related mortality rates by educational attainment in the U.S., for years 2000-2017. I find that alcohol-related mortality rates rose for both sexes and all levels of educational attainment. Increases were often larger for less educated groups, exacerbating already existing disparities. In the third chapter, I find that social inequalities shape not only the length of life and the ultimate cause of death, but also the quality of life at its very end. Using the NHIS, I examine trends in end-of-life health for years 1997-2015. People who are less educated, are black, immigrated to the U.S., are residents of the South, and have ever smoked experience longer periods of poor health at the end of life. Together, these three chapters illustrate the intricate nature of health inequalities.
Degree Type Dissertation
Degree Name
Doctor of Philosophy (PhD)
Graduate Group Demography
First Advisor Irma Elo
Keywords
educational disparities, health, inequalities, mortality
Subject Categories
ADULT HEALTH AND MORTALITY IN THE UNITED STATES
Yana Vierboom
A DISSERTATION in
Demography and Sociology
Presented to the Faculties of the University of Pennsylvania in
Partial Fulfillment of the Requirements for the Degree of Doctor of Philosophy
2019
Supervisor of Dissertation
__________________________________ Irma Elo
Professor of Sociology
Graduate Group Chairperson
__________________________________
Hans-Peter Kohler, Frederick J. Warren Professor of Demography Chair, Graduate Group in Demography
Dissertation Committee
Irma Elo, Professor of Sociology
ii
ACKNOWLEDGMENTS
This dissertation would not exist without the wonderful and patient teachers I
have had for the last 30 years. Frau Klütt taught me to draw letters in 1st grade, Mr.
Poretta of 6th grade language arts gave my family our first computer, Ms. Davies taught
me how to write better in 10th grade, and Mrs. Lahey taught me high school French along
the way (most of which I have forgotten, through no fault of hers).
Year later, I landed at the Penn GGD, where Irma Elo taught my cohort our first demographic methods (with immense patience for our repetitive questions and boundless anxieties). Irma treats her students as peers, and she has the same high standards for them as she does for her own work. She makes us all better researchers.
Sam Preston’s confidence in my skills as a fledgling demographer made me feel like grad school maybe wasn’t a mistake, something that I think Sam has done for many students. His way of transforming most research questions into demographic formulas is inspiring. One of my favorite things about Sam is that when I arrive at an utterly incorrect
interpretation, he invariably responds with some form of the encouraging phrase I didn’t
think of it that way—how interesting.
Michel Guillot taught my cohort and me the basic intellectual foundations of demography—in the most calming and methodical way. Michel magically distills complicated things into things that don’t seem so complicated after all. His insights have been very helpful throughout the years.
Many, many students shaped my time at Penn through teaching, mentoring, listening, and discussing. For brevity, I’ll list only my brilliant cohort: Jeylan Erman, Aashish Gupta, Megan Reed, Amarachi Utah-Adjibola, and my very dear officemate for the last two years, Daesung Choi. Your comradery has been invaluable.
Finally, I’d like to thank my original teachers—my family. My mother, Linda, has been my greatest teacher and mentor, teaching me to be kind and good to others. She teaches by her example every day. Watching my father, Franz, run a restaurant taught me to work hard for the things I love (and also how to use a knife). My sister and
iii
Parts of Chapter 1 have appeared in Vierboom, Y.C. (2017). The contribution of differences in adiposity to educational disparities in mortality in the United States.
Demographic Research, 37(54). NIHMSID: 925801.
Parts of Chapter 2 have appeared in Vierboom, Y.C. (2019). Trends in alcohol-related
mortality by educational attainment in the U.S., 2000-2017. Population Research and
iv
ABSTRACT
ADULTS HEALTH AND MORTALITY IN THE UNITED STATES
Yana Vierboom
Irma Elo
v
TABLE OF CONTENTS
ACKNOWLEDGMENTS ... II
ABSTRACT ... IV
LIST OF TABLES ... VII
LIST OF FIGURES ... IX
INTRODUCTION... X
CHAPTER 1: THE CONTRIBUTION OF DIFFERENCES IN ADIPOSITY TO
EDUCATIONAL DISPARITIES IN MORTALITY IN THE UNITED STATES ... 1
Abstract ... 1
Introduction ... 2
The socio-economic gradient in mortality ... 2
Maximum BMI: A better way to estimate adiposity in studies of mortality disparities ... 4
Study aim ... 7
Data and methods ... 8
Data source and sample ... 8
Variable design ... 9
Analytic strategy ... 11
Results ... 13
Descriptive statistics and age-standardized mortality rates ... 13
Model performance ... 16
Karlson, Holm, & Breen decompositions ... 22
Discussion and conclusion ... 25
References ... 28
CHAPTER 2: TRENDS IN ALCOHOL-RELATED MORTALITY BY EDUCATIONAL ATTAINMENT IN THE U.S., 2000-2017 ... 33
Abstract ... 33
Background ... 35
Alcohol-related causes of death ... 35
vi
Methods & Data ... 38
Overview ... 38
The dual data source bias ... 39
Calculating the proportion of deaths attributable to alcohol (Ralc) ... 40
Calculating all-cause mortality rates by educational attainment (Mall) ... 42
Combining Ralc and Mall ... 44
The Relative Index of Inequality (RII) ... 46
Results ... 47
Discussion ... 54
Findings in context ... 54
Strengths and limitations ... 59
Conclusion ... 61
References ... 72
CHAPTER 3: LIFE BEFORE DEATH: SELF-RATED HEALTH AND DISABILITY AT THE END OF LIFE ... 77
Abstract ... 77
Introduction ... 78
Background ... 80
Years lived and left to live ... 80
Trends in aging ... 82
Heterogeneity in aging ... 84
Methods ... 86
Data ... 86
The sample ... 86
Years-to-death ... 86
Health outcomes... 87
Population characteristics ... 88
Causes of death ... 88
Analytic approach ... 89
Age standardization ... 90
Results ... 91
Discussion ... 104
Limitations ... 109
Conclusion ... 110
vii
LIST OF TABLES
Chapter 1
Table 1. Sample characteristics of adults aged 40-74 at baseline by educational attainment, NHANES 1988-2011.
Table 2. Sample characteristics of adults aged 40-74 at baseline, by sex and smoking status, NHANES 1988-2011.
Table 3. Odds ratios of dying from all-cause mortality for adults aged 40-74 at baseline, NHANES 1988-2011.
Chapter 2
Table 1. Sample sizes in NHIS person-year file used to estimate all-cause mortality rates
(Mall).
Table 2. Percentage of deaths in vital statistics attributable to alcohol (Ralc * 100).
Table 3. Age-standardized mortality rate (per 100,000) and relative index of inequality in all-cause and alcohol-related mortality by period, adults 30+.
Table 4. Age-standardized mortality rate (per 100,000) and relative index of inequality in alcohol-related mortality, by age and period.
Table 5a. Relative index of inequality in alcohol-related mortality, by age & cohort. Males.
Table 5b. Relative index of inequality in alcohol-related mortality, by age & cohort. Females.
Appendix Table 1. Alcohol-attributable fractions (AAF) and ICD-10 codes for alcohol-related adult causes of death.
Appendix Table 2. Relative index of inequality in alcohol-related mortality (per 100,000), by age & period, for 100% alcohol-attributable causes only.
Appendix Table 3. Slope index of inequality in alcohol-related mortality (per 100,000), by age & period.
viii
Chapter 3
Table 1. Characteristics of adults dying within 6 years of interview, NHIS 1997-2014.
Table 2. Self-rated health and disability in the last 6 years of life by social characteristic, NHIS 1997-2014.
ix
LIST OF FIGURES
Chapter 1
Figure 1. Percentage of mortality differences between college graduates and others mediated by adiposity, by adiposity measure.
Figure 2. Percentage of mortality differences between college graduates and others mediated by maximum BMI, by sex and smoking status.
Chapter 2
Appendix Figure 1. Distribution of alcohol-related cause-of-death components between 2000 and 2017.
Appendix Figure 2. Period patterns of drinking behavior, by educational attainment.
Chapter 3
Figure 1. Proportion of last 6 years lived with poor health or disability, over time. NHIS decedents 65+.
Figure 2. Prevalence of poor health and disability in the last 6 years of life, by age at death. NHIS decedents 65+.
Figure 3. Prevalence of poor health and disability in the last 6 years of life, by race. NHIS decedents 65+.
Figure 4. Prevalence of poor health and disability in the last 6 years of life, by educational attainment. NHIS decedents 65+.
Figure 5. Prevalence of poor health and disability in the last 6 years of life by causes of death, ages 65-79 at death.
x
INTRODUCTION
“The case is one where…we have been compelled to reason backward from effects to causes.”
~Sherlock Holmes in The Adventure of the Cardboard Box (1893)
The last 200 years have seen far-reaching changes in human life. Scientific
discoveries have improved our health, transformed the labor we do and where we do it,
altered our diets, and changed how and with whom we communicate. As a result of these
and other changes, we also live longer. John Graunt of London published the first early
life tablesin 1662, a time when life expectancy in England and Wales was nearly half
what it is today (Office for National Statistics 2015). Indeed, a person of the median age
in the contemporary U.S. has roughly the same amount of life ahead of them as the
average person in Graunt’s time could expect to live from birth (Arias and Xu 2018;
Office for National Statistics 2015; U.S. Census Bureau 2018). The infectious causes of
death common in Graunt’s accounts, like fever, bloody flux (dysentery), and
consumption (tuberculosis), have been nearly eradicated in the U.S. and other
high-income countries. Instead, we are more likely to die from chronic diseases that were
uncommon or unheard of in Graunt’s time.
And yet, for all the changes our world has seen since the Industrial Revolution,
the structures that systematically advantage some groups at the expense of others
persist—though their strength has hopefully diminished. The tendrils of social inequality
xi
conditions in utero, who receives the very best education, who smokes and who
exercises, who works dangerous or precarious jobs, who marries whom, and so on. All of
these inequalities translate into more than just differences in zip codes and material
goods, they also contribute to the biggest inequalities of all—those in health and
longevity. Not only do some of us lead more comfortable lives, we also get to enjoy them
for longer because they are comfortable.
Each death is the unique product of a lifetime of social, behavioral, and genetic
factors—and so each tells a story. The following three chapters consider a tiny fraction of
these stories. In Chapter 1, I examine the role of obesity in reproducing educational
differences in mortality. Although previous work has found differences in obesity to
explain little to none of the mortality differences between the least and most educated
groups, I find that conclusions are sensitive to how obesity is measured. Health surveys
that collect measured or self-reported weight typically do so at the time the survey is
administered. However, as Preston & Stokes (2016) write, this method overlooks the
salience of socially-patterned weight histories. In this chapter, I find that groups with
lower levels of formal schooling are more likely than others to have ever been obese, at a
far higher magnitude than they are more likely to be obese at survey. Illness-related
weight loss is a likely reason for this phenomenon. Since the incidence of illness and
educational attainment are negatively correlated, using a cross-sectional measure of
weight obscures between-group differences. By using a measure of highest-ever weight, I
find that 10-12% of educational differences in mortality are driven by the higher
xii
The second chapter also examines educational differences in mortality by
considering inequality in related mortality. A thorough examination of
alcohol-related mortality rates by educational attainment in the U.S. has not before been
undertaken, possibly due two significant methodological challenges. The first is the
difficulty of assembling various causes of death that are not entirely attributable to
alcohol, but whose mortality risks may be heightened by alcohol use. I address this issue
by applying a CDC-recommended method which uses estimates of the percentage of
deaths from a particular cause attributable to alcohol. The second methodological hurdle
is the limited accuracy of educational attainment on death certificates. For obvious
reasons, educational attainment is not self-reported on death certificates, but rather
reported by whomever is filling out the certificate. I use a method proposed by Ho (2017)
to adjust for bias introduced by misreporting. I find that alcohol-related mortality rates
increased between 2000-2017, at all levels of educational attainment. Increases were
often largest for less educated groups, widening already existing disparities.
The experiences and exposures accumulated during the life course shape not only
one’s ultimate cause of death, but also the months, days, and moments preceding death.
This is the subject of the final chapter. Population aging in the U.S. and elsewhere
naturally raises concerns about the quality of life at advanced ages. Are we aging “better”
than in the past, or are we spending more time in bad health? What can we expect from
the final stage of life? Research has traditionally explored these questions using measures
of chronological age. However, this work overlooks the distinction between studying
xiii
end of life for some people). In this chapter, I consider changes in self-rated health and
disability in the last six years of life, for adults who died at ages 65+. I find that the
amount of time lived with a disability at the end of life did not change between
1997-2010, though there were some improvements in self-rated health among women. While
some people will not be disabled and report good health at the end of life, the majority of
us should expect at least some time with a disability or poor health. Women and people
who live to older ages, are black, are less educated, live in the South, and are
foreign-born typically experience longer than average periods of disability, as do decedents dying
from respiratory and cerebrovascular diseases.
Death is inevitable for all humans, a fact which demographers do not have the
skillset to change. Instead, demographers can help change the nature and circumstances
of death. This feat requires a careful and methodical retrospection of the life course. By
doing so, we might shed light on the causes resulting in the unequal distribution of life.
References
Arias E, Xu JQ. 2018. United States life tables, 2015. National Vital Statistics Reports. 67(7). Hyattsville, MD: National Center for Health Statistics.
Graunt, J. 1662. Natural and Political Observations Mentioned in a Following Index and
Made Upon the Bills of Mortality. London.
Ho, J. Y. (2017). The contribution of drug overdose to educational gradients in life
expectancy in the united states, 1992-2011. Demography, 54(3), 1175-1202.
Office for National Statistics. 2015. How has life expectancy changed over time?
xiv
https://www.ons.gov.uk/peoplepopulationandcommunity/birthsdeathsandmarriages/lif eexpectancies/articles/howhaslifeexpectancychangedovertime/2015-09-09.
Stokes, A., & Preston, S. H. (2016). How dangerous is obesity? issues in measurement
and interpretation. Population and Development Review, 42(4), 595-614.
US Census Bureau. 2018. Age and Sex from the 2013-2017 American Community
Survey 5-year estimates. Retrieved from:
C
HAPTER1
:THE CONTRIBUTION OF DIFFERENCES IN ADIPOSITY TO
EDUCATIONAL DISPARITIES IN MORTALITY IN THE UNITED STATES
Abstract
Background: There are large differences in life expectancy by educational attainment in the United States. Previous research has found obesity’s contribution to these differences to be small. Those findings may be sensitive to how obesity is estimated.
Methods: This analysis uses discrete time logistic regressions with data from the National Health and Nutrition Examination Survey (NHANES), pooled from 1988-1994 and 1999-2010, to estimate the contribution of differences in adiposity, or body fat, to educational differences in mortality. I show that results depend upon the measure of adiposity used: body mass index (BMI) at survey or lifetime maximum BMI.
Results: College graduates were less likely than high school graduates to be obese at survey (25.0% vs 34.6%, respectively) and were also less likely to have ever been obese (35.7% vs. 49.4%, respectively). Lifetime maximum BMI performed better than BMI at survey in predicting mortality using criteria for model selection. Differences in maximum BMI were associated with between 10.3% and 12.0% of mortality differences between college graduates and all others, compared to between 3.3% and 4.6% for BMI at survey. Among non-smokers, between 18.4% and 27.6% of mortality differences between college graduates and all others were associated with differences in maximum BMI.
Introduction
The socio-economic gradient in mortality
Life expectancy and disease patterns follow a well-documented socio-economic
gradient in many high-income countries (see e.g., Elo 2009; Hayward et al. 2015; Laditka
and Laditka 2016; Mackenbach et al. 2008). Between 1999 and 2011, for example, life
expectancy for a 40 year-old white woman with a high level of education was 42.7 years,
compared to 29.6 years for a woman with low education (Laditka and Laditka 2016).
Substantial disparities in mortality rates by educational attainment have similarly been
observed in many European countries (Mackenbach et al. 2008). Recent evidence
suggests that differentials in the United States and elsewhere may be widening (see, e.g.,
Mackenbach et al. 2015; National Academies of Sciences, Engineering, and Medicine
2015), adding further urgency to an already urgent issue.
An extensive body of research seeks to identify the mechanisms driving the
relationship between education and mortality. One branch of this work focuses on the
impact of modifiable health behaviors, such as smoking, alcohol and drug use, and
obesity. Obesity, defined as having a body mass index (BMI) of 30 or greater, is a salient
factor in view of the growing prevalence of obesity in many countries (Devaux and Sassi
2013; Flegal et al. 2007; Ogden et al. 2010; Ogden et al. 2015; Robertson et al. 2007), a
global trend that is well-illustrated in the United States ("Global Health Observatory
(GHO) data: Obesity" 2016; Finucane et al. 2011). In 1980, for example, 16% of US
women and 12% of US men were considered obese, compared to 36% of women and
obesity rates have increased for all segments of the US population in recent decades,
poorer and less educated people continue to be more likely to be obese (Chang and
Lauderdale 2005; Ogden et al. 2010; Yu 2012), an association that may have
strengthened during the Great Recession (Wang et al. 2016). This relationship is
worrisome, given the health and mortality risks associated with obesity. Stokes and
Preston (2016) estimate that nearly one in six deaths occurring in the United States
between 1988 and 2004 can be attributed to obesity. Obesity influences health and
mortality through a variety of channels, such as by increasing the risk of diabetes
(Abdullah et al. 2011), cardiovascular diseases (Tarleton et al. 2014), cancer (Wolin et al.
2010), and disability (Alley and Chang 2007; Reynolds et al. 2005). Growing educational
disparities in obesity prevalence could exacerbate existing mortality differentials.
Despite the health implications of obesity and its possibly strengthening inverse
relationship with socio-economic status (SES), obesity has not been adequately examined
as a determinant of socio-economic mortality differentials in the United States.
Surprisingly, research that has explored this topic, such as the work on health behaviors
by Mehta, House, and Elliott (2015) or Montez and Zajacova (2013), finds no significant
contribution of adiposity, or body fat, to socio-economic differences in mortality. It is
possible that these and other findings are sensitive to bias in estimating the mortality
Maximum BMI: A better way to estimate adiposity in studies of mortality disparities
Prior studies on health behaviors and SES commonly estimate adiposity using one
cross-sectional observation of BMI, a weight-to-height ratio calculated as weight in
kilograms over height in meters squared, measured at time of survey. BMI at survey can
be a problematic measure in quantifying the relationship between adiposity and mortality
because it is susceptible to bias from reverse causation due to illness. Formerly-obese
individuals who have lost weight from an illness may present a healthy BMI at survey
time but have an elevated risk of mortality due to the underlying illness. This process is
illustrated by the finding that mortality risks are often highest among individuals who
have lost weight (Stokes and Preston 2016; Yu et al. 2016). The process of ill individuals
being selected out of the obese population artificially inflates mortality rates for lower
BMI ranges and deflates mortality rates for higher ones (Stokes 2014; Stokes and Preston
2016; Stokes and Preston 2016). As a result, estimates of the risks associated with obesity
may be biased downwards, sometimes creating the illusion of a survival advantage for
overweight or obese individuals (Stokes and Preston 2016). Since less educated
individuals are more likely to contract illnesses that result in weight loss, as I demonstrate
in Section 3.1 below, reverse causation is of particular concern in studying
socio-economic mortality differentials.
One common approach to addressing reverse causation due to illness when using
longitudinal data is to delay the onset of analysis, often by five years, to exclude
individuals who are most ill (Flegal et al. 2007; Global BMI Mortality Collaboration, a.
sample size and statistical power (Flegal et al. 2007; Global BMI Mortality
Collaboration, a. 2016; Hu 2008; Stokes and Preston 2016). Additionally, weight-loss
trajectories vary considerably by age and disease (Alley et al. 2010). A second method
excludes individuals who report having a disease associated with weight loss (Flegal et
al. 2007; Global BMI Mortality Collaboration, a. 2016; Hu 2008; Stokes and Preston
2016). In addition to reducing sample size and missing undiagnosed cases, conditioning
on diseases that may be on the pathway from obesity to mortality can underestimate the
relative risks associated with obesity (Flegal et al. 2007; Global BMI Mortality
Collaboration, a. 2016; Hu 2008).
One recently-proposed solution for addressing reverse causation bias that avoids
some of the pitfalls of other methods is to use lifetime maximum BMI, based on
highest-ever weight (Stokes 2014; Stokes and Preston 2016; Stokes and Preston 2016). Because
maximum weight is likely attained at a time free of illness, this approach minimizes the
likelihood of illness-induced weight loss without reducing sample size, conditioning on
pre-diagnosed morbidity, or otherwise restricting the generalizability of the findings
(Stokes and Preston 2016).
The advantages of maximum BMI are not limited to reducing bias from reverse
causation. A growing literature documents that elements of weight history are predictive
of mortality (Preston et al. 2013). The mortality risks of obesity, for example, increase
with the duration of obesity (Abdullah et al. 2011; Abdullah et al. 2014). Given that
duration and peak weight were positively correlated in one analysis at 0.62 (Mehta et al.
factors influencing mortality than does a single, cross-sectional observation. This
measure is especially salient for examining socio-economic differentials in health and
mortality, since we know from existing research that SES and health behaviors are
closely linked. Pampel, Krueger, and Denney (2010) identify a set of broad mechanisms
through which SES influences health behaviors, many of which predict socio-economic
differences in weight history. Individuals of lower SES, for example, tend to experience
more negative life events which may trigger weight gain, may not have information about
the risks of excess weight, and may lack access to resources that make it easier to
maintain a healthy weight.
An early variant of lifetime maximum BMI, peak BMI, was first used in a cohort
study of Finnish adults by Mehta et al. (2014). The authors calculated peak BMI from
self-reported weight at ten-year age intervals, finding that peak BMI was positively
associated with increased mortality, net of BMI at survey. Recent research building on
Mehta et al.’s work has consistently found an association between mortality and having
ever been obese. In their comparison of maximum and survey BMI in three large cohort
studies, Yu et al. (2016) find that the power of having ever been obese to predict
mortality is far greater than the predictive power of obesity at time of survey. Research
by Stokes and Preston (2016) uses model selection criteria to conclude that maximum
BMI is a more robust predictor of mortality than survey BMI. In one of the first studies to
apply the measure beyond testing its robustness, Elo, Preston, and Mehta (forthcoming)
maximum BMI account for 29% of black-white differences in mortality among women
and 1% among men.
Although peak BMI was initially developed using cohort data, many studies,
including the present one, calculate maximum BMI in cross-sectional surveys using
measured height and self-reported maximum weight (Elo et al. 2016; Stokes and Preston
2016; Stokes and Preston 2016). While bias introduced by using self-reported weight is a
concern, Preston, Fishman, and Stokes (2015) demonstrate that biases are sharply
reduced by using a continuous measure of BMI. Additionally, the biases may not be in
the expected direction: while individuals generally under-estimate current weight
(Preston et al. 2015), they appear to over-estimate past weight (Stokes and Ni 2016).
Study aim
This study investigates the contribution of adiposity to educational mortality
differentials in the United States, using several measures of adiposity. Previous research
finding no contribution of obesity to educational mortality differences relies on BMI at
time of survey, a measure which underestimates the risks of obesity (Stokes and Preston
2016; Stokes and Preston 2016). Maximum BMI has already been applied to investigate
racial differences in mortality (Elo, Preston, and Mehta forthcoming), but has not before
been used to examine educational differences in mortality. Accurately quantifying
adiposity’s contribution to educational mortality differentials is crucial for reducing
mortality disparities in a context of increasing obesity prevalence.
Although this analysis uses data from the United States, given the country’s
analysis are likely generalizable to other high-income countries with comparable
inequalities in mortality and obesity by educational attainment. Existing research
indicates that many European countries may fit this description (Devaux and Sassi 2013;
Mackenbach et al. 2008; Robertson et al. 2007).
Data and methods
Data source and sample
I use data from the National Health and Nutrition Examination Survey
(NHANES), an annual cross-sectional health survey administered by the National Center
for Health Statistics. I combine data from NHANES III (1988-1994) and NHANES
Continuous (1999-2010) waves, weighted to be nationally representative of the
non-institutionalized US population. In addition to participating in detailed in-person
interviews, adult respondents visit mobile examination centers for physical examinations.
The participation rates for the years included in the sample range from 75% to 80%
("NHANES Response Rates and Population Totals" 2015). Each wave has been linked to
the National Death Index through December 2011, allowing for mortality follow-up.
More detailed information on survey design and sampling procedures are available
elsewhere (Centers for Disease Control and Prevention 1996; Johnson et al. 2013).
I restrict the study population for the main analysis to respondents aged 40 to 74
at time of survey who were physically examined, not pregnant, and not missing
information on height or any of the weight measures. I exclude respondents missing
analysis is to examine the contribution of obesity to mortality differences, I exclude
respondents who have always been underweight (maximum BMI<18.5) (n=18) or who
are currently underweight (survey BMI<18.5) (n=261). I also exclude respondents with
maximum BMI values of 60 or greater (equivalent to being 5’10” tall and weighing 420
pounds) (n=70), to avoid the influence of outliers. Respondents are censored upon
reaching age 85 during mortality follow-up. The final sample consists of 22,703
respondents experiencing 3,784 deaths from all causes across 215,066 person-years of
follow-up. The mean length of follow-up is 10.9 years.
Variable design
Outcome variable
The dependent variable is all-cause mortality as registered in the National Death
Index between participation in the survey and December 31st, 2011.
Education
Earlier NHANES waves (1988-1994) measured education as years of completed
schooling, ranging from 0 to 17 years. Later waves (1999-2010) collected this
information using a five-level categorical variable (<9 years, <high school, high school
degree/GED, some college/associate’s degree, bachelor’s degree or more). I convert data
from earlier waves into these five categories, using years of completed schooling. Since
state-level compulsory schooling laws in the United States mandate schooling until at
sampled population with less than 9 years of schooling is foreign-born. To minimize bias
from nativity, I combine categories <9 years and <high school into one category, <high
school.
Measures of Adiposity
In the main analysis, I examine two measures of BMI: BMI at time of survey and
lifetime maximum BMI. BMI, calculated as weight in kilograms over height in meters
squared, is a commonly used estimator of adiposity. Values between 18.5 kg/m2 and 25
kg/m2 are considered healthy, values between 25 kg/m2 and 30 kg/m2 are considered
overweight, and values of 30 kg/m2 or higher are considered obese. I use the terms
adiposity and obesity interchangeably throughout this study.
I construct a continuous measure for BMI at survey using height and weight, both
measured at a mobile examination center at the time of examination. Consistent with
previous studies, I construct a variable for maximum BMI using measured height and
self-reported highest-ever weight. Preston, Fishman, and Stokes (2015) show that bias
from weight misreporting in estimates of the mortality consequences of obesity are
greatly reduced if using a continuous measure of BMI.
In a sensitivity analysis, I examine two additional estimates of adiposity. The first
is BMI at age 25, constructed using height measured at time of survey and self-reported
weight at age 25. The second is waist circumference in centimeters, measured at time of
Other covariates
Age, sex, and race/ethnicity are correlated with BMI (Elo et al. 2016; Heymsfield
et al. 2016; Reynolds et al. 2005; Zhang and Wang 2004) and included as additional
covariates, as are continuous variables for age at baseline and years since interview.
I also include a categorical variable for smoking history, capturing never smokers, former
smokers, and current smokers. Because smokers, especially life-long smokers, have a
higher risk of death and are more likely to have a healthy BMI (Audrain-McGovern and
Benowitz 2011; Stokes and Preston 2016), cigarette use can obscure the relationship
between obesity and mortality (Stokes and Preston 2016). Threats of confounding are
particularly serious in studies of educational attainment and mortality, given the inverse
relationship between smoking and education (Jamal et al. 2015).
Analytic strategy
I model the relationship between education and mortality using discrete time
logistic regressions. The full models include variables for age at baseline, years since
interview, sex, race/ethnicity, education, smoking, and one to two adiposity measures. I
compare models using model performance criteria Akaike information criterion (AIC)
and Bayesian information criterion (BIC).
Next, I estimate the percentage of the education-mortality relationship that is
mediated by educational differences in adiposity. In a logistic model, coefficients can
change across nested models both because an added variable z (adiposity) mediates the
variable y (mortality) and because the underlying scale of the model has shifted (Karlson
et al. 2012). It is not sufficient, therefore, to estimate the percentage of the
education-mortality relationship that is associated with obesity by examining the percent change in
the education coefficients across nested models before and after controlling for adiposity.
If done this way, it is unclear how much the coefficients for education have changed due
to: 1) obesity mediating the association between education and mortality; and 2) the shift
in the scale caused by the introduction of a new variable. Failure to correct for rescaling
often underestimates the mediating role of variable z in the relationship between x and y,
“increasing the likelihood of our concluding, incorrectly, that changing z would have
little or no impact on the x-y relationship (Karlson et al. 2012).”
To address this issue, I apply a method proposed by Karlson, Holm, and Breen
(2012) (KHB), using the khb command in Stata version 15 (StataCorp 2017). To isolate
the separate effects of rescaling and confounding, the method linearly regresses z
(adiposity) on x (education) and uses the x-residualized z-variable in the full model to
remove any correlation between x and z. Because the original and corrected models have
the same scale, we can determine the change in the coefficient attributable to
confounding from variable z, net of rescaling, by subtracting the coefficient for x in the
original model with the x-z correlation from the coefficient for x in the corrected model
without the correlation. The underlying discrete time logistic regressions model both
smoking and adiposity as mediators in the relationship between education and mortality.
The models additionally include demographic controls for age at baseline, years
decomposition examining the contribution of two additional estimates of adiposity to
educational mortality differences: waist circumference measured at survey time and BMI
at age 25.
Finally, I repeat the above khb procedure restricting the sample by sex and
non-smoking status using only the best performing estimate of adiposity. Since non-smoking
increases risk of death and is inversely related to obesity (Audrain-McGovern and
Benowitz 2011; Stokes and Preston 2016), measurement error in smoking status, such as
the inability to account for smoking duration and intensity, may bias estimates of the
relationship between obesity and mortality (Stokes and Preston 2016). Although not
generalizable to the overall population, results for never-smokers present a less biased
picture of obesity’s contribution to mortality differences.
Results
Descriptive statistics and age-standardized mortality rates
Table 1 presents characteristics of the sample by educational attainment, weighted
to be nationally-representative of the non-institutionalized population. The majority
(61%) of respondents have at most a high school degree, and just over one-fifth (21%) of
respondents have some college experience or an associate’s degree, but no bachelor’s
degree. Respondents with bachelor’s degrees are more likely than those without four-year
degrees to be younger, non-Hispanic white never-smokers. At survey, one-quarter (25%)
of college-educated respondents were obese, compared to one-third (35%) of those with a
been obese, as measured by maximum BMI, compared to nearly half (49%) of those with
a high school degree. The relationship between education and past obesity is somewhat
more linear than between education and obesity at survey, suggesting that BMI at survey
masks heterogeneity in weight histories. Some of this heterogeneity is illustrated by the
negative association between education and weight loss shown in Table 1. On average,
those with less than a high school degree weighed 2.3 kg/m2 less at survey time than they
did at their highest weight, compared to college graduates who lost 1.6 kg/m2.
Differences in weight loss may be influenced both by illness and by the educational
patterning of current smoking (Jamal et al. 2015), as smoking is negatively correlated
with current weight (Audrain-McGovern and Benowitz 2011). Among those with less
than a high school degree, 32% reported being current smokers, compared to 11% of
those with at least 4 years of college.
Table 1 also shows mortality rates by education and sex for the studied
population, calculated using weighted deaths and person-years, and adjusted using the
age distribution of adults aged 40-84 in the 2000 Census. As expected, education and
mortality are highly negatively correlated. Those without a high school degree were more
than twice as likely as college-educated respondents to die during follow-up (12.41
deaths vs. 5.58 deaths per 1,000 for females and 16.61 vs. 7.10 deaths per 1,000 for
males, respectively). Using the same age standard, the death rate for the overall
population of 40-84 year-olds in 2000 National Vital Statistics data is 11.33 for females
and 17.35 for males (Miniño et al. 2002), compared to 10.85 for females and 14.26 for
T ab le 1 . S ampl e c ha ra ct eristi
cs of a
dult s a g ed 40 -74 a t base li ne b y e duc ati ona
l attainment, NH
AN E S 1988 -2011. a C haract er ist ics < H igh sc hoo l (95% C I) H igh sc hoo l (95% C I) Some col leg e, A ss oci at e’ s d egr ee (95% C I) B ach el or’ s degre e or m ore (95% C I) T ot al (95% C I) A dj us ted m or ta li ty r at e ( p er 1,000) b Fem al e 12.41 8.44 7.15 5.58 10.85 Ma le 16.61 15.18 11.72 7.10 14.26 A di pos it y C ur ren tl y obe se
c (
% ) 36.6 ( 34 .8 t o 38.7 ) 34.6 ( 32 .7 t o 36.5 ) 34.8 ( 32 .9 t o 36.7 ) 25.0 ( 23 .3 t o 26.7 ) 32.7 ( 31 .5 t o 33.8 ) Ev er obes e
c (%
) 52.9 ( 51 .3 t o 54.4 ) 49.4 ( 47 .3 t o 51.5 ) 48.7 ( 46 .5 t o 50.8 ) 35.7 ( 33 .5 t o 37.9 ) 46.5 ( 45 .2 t o 47.8 ) B MI sur v e y ( m ea n) 28.9 ( 28 .7 t o 29.1 ) 28.7 ( 28 .5 t o 29.0 ) 28.7 ( 28 .4 t o 29.0 ) 27.4 ( 27 .2 t o 27.7 ) 28.4 ( 28 .3 t o 28.6 ) B MI m ax ( m ea n) 31.5 ( 41 .3 t o 31.7 ) 30 .9 ( 30 .7 t o 31.2 ) 30.8 ( 30 .5 t o 31.1 ) 29.2 ( 28 .9 t o 29.5 ) 30.6 ( 30 .4 t o 30.8 ) B MI l ost
c (
unlike Vital Statistics, excludes individuals who are institutionalized at baseline and
because I additionally exclude those who are underweight at baseline.
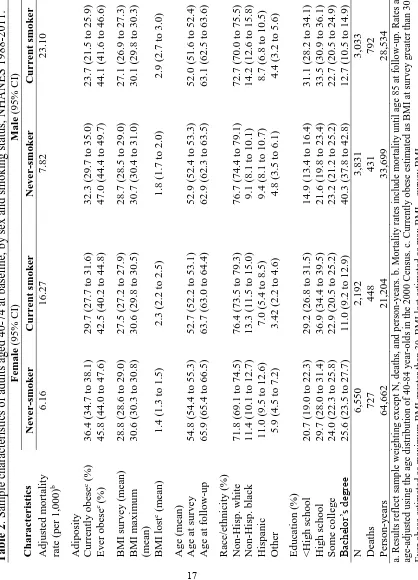
Table 2 presents characteristics of the sample for never and current smokers by
sex. Current smokers are less likely than never smokers to have a bachelor’s degree (11%
vs. 26%, respectively, for females and 13% vs. 40% for men). Current smokers are also
less likely to be currently obese, though these differences diminish if we consider having
ever been obese. Although never-smoking females were 23% more likely than currently
smoking females to be obese at time of survey, they were only 8% more likely to have
ever been obese. For males, these figures are 36% and 7%, respectively. Despite current
smokers’ healthier weight, current smokers experienced more than twice the mortality
rates of never smokers, illustrating smoking’s confounding role in the relationship
between obesity and mortality. The age-standardized mortality rate for currently smoking
males is 23.10 annual deaths per 1,000, about 15 deaths higher than the rate of 7.82
deaths per 1,000 among never-smoking men. For women, these rates are 16.27 and 6.16
deaths per 1,000, respectively.
Model performance
Table 3 presents odds ratios of dying from all causes during the follow-up period.
Model 1 estimates the baseline relationship between education and mortality, controlling
for age, sex, race/ethnicity, and smoking. In order to highlight differences between the
extreme ends of the education distribution, having a bachelor’s degree serves as the
T ab le 2 . S ampl e c ha ra ct eristi
cs of a
dult s a g ed 40 -74 a t base li ne , b y se x a n d sm oking status, NHA N ES 1988 -2011. a C haract er ist ics F em a le (95% C I) Mal e (95 % C I) N eve r-sm o ker C urre nt sm ok er N eve r-sm o ker C urre nt sm ok er A dj us ted m or ta li ty rat e ( p er 1, 000) b 6.16 16.27 7.82 23.10 A di pos it y C ur ren tl y obe se
c (
% ) 36.4 ( 34 .7 t o 38.1 ) 29.7 ( 27 .7 t o 31.6 ) 32.3 ( 29 .7 t o 35.0 ) 23.7 ( 21 .5 t o 25.9 ) Ev er obes e
c (%
) 45.8 ( 44 .0 t o 47.6 ) 42.5 ( 40 .2 t o 44.8 ) 47.0 ( 44 .4 t o 49.7 ) 44.1 ( 41 .6 t o 46.6 ) B MI sur v e y ( m ea n) 28.8 ( 28 .6 t o 29.0 ) 27.5 ( 27 .2 t o 27.9 ) 28.7 ( 28 .5 t o 29.0 ) 27.1 ( 26 .9 t o 27.3 ) B MI m axi m u m (m ea n) 30.6 ( 30 .3 t o 30.8 ) 30.6 ( 29 .8 t o 30.5 ) 30.7 ( 30 .4 t o 31.0 ) 30.1 ( 29 .8 t o 30.3 ) B MI l ost
c (
BMI and maximum BMI, respectively. Model 4 adds both adiposity estimates
simultaneously and Model 5 includes only the difference between them, representing
BMI units lost from maximum BMI. Although previous research has shown the inclusion
of a quadratic term for obesity estimates to improve model performance (Kivimaki et al.
2008), this was only the case for survey BMI and is therefore not shown for maximum
BMI. I did not find evidence of significant interactions between adiposity+sex,
adiposity+education, education+sex, or education+smoking in any of the models. There
is evidence of an interaction between age and adiposity throughout. However, since the
focus of the main analysis is the change in age-adjusted mortality differences by
education once controlling for adiposity, an interaction between age and adiposity does
not affect the main findings. To avoid including several age+adiposity interactions in
Model 4, and since these interactions had only a modest effect on the odds ratios in Table
3, age interactions are not shown in this table.
In Model 1, those with less than a high school degree are more than twice as
likely as college graduates to die during follow-up (odds ratio of 2.015), even after
controlling for differences in age, sex, race/ethnicity, and cigarette smoking. Those with a
high school degree or some college are also significantly more likely to die than those
with a four-year degree (odds ratios of 1.651 and 1.431, respectively). If we account for
the fact that less educated people are more likely to be obese at survey in Model 2, the
survival advantage of having a college degree is somewhat lessened. Here, the odds ratio
of dying for those without a high school degree decreases from 2.015 in Model 1 to 1.941
T
ab
le 3
. Odds r
ati
os of dy
in g fr om all -c aus e mortalit y for a dult s a g ed 40 -7 4 a t base li ne , NH AN ES 1988 -2011. a C haract er ist ics Model 1: B as el ine Model 2: Su rve y B M I Model 3: Max B M I Model 4: Max & Su rve y B MI Model 5: Max Su rve y B MI Educat ion (r ef : B A +) <H ig h sc hoo l 2.015 *** (1.646 t o 2.468 ) 1.941 *** (1.585 t o 2.375 ) 1.820 *** (1.491 t o 2.221 ) 1.822 *** (1.494 t o 2.222 ) 1.804 *** (1.480 t o 2.200 ) H ig h sc hool 1.651 *** (1.383 t o 1.970 ) 1.608 *** (1.346 t o 1.921 ) 1.533 *** (1.285 t o 1.828 ) 1.553 *** (1.300 t o 1.854 ) 1.536 *** (1.287 t o 1.832 ) Som e c ol leg e 1.431 *** (1.177 t o 1.740 ) 1.404 *** (1.156 t o 1.707 ) 1.354 ** (1.115 t o 1.64 4) 1.356 ** (1.121 t o 1.64 1) 1.347 ** (1.112 t o 1.63 2) A g e a t bas el ine 1.102 *** (1. 094 t o 1.110 ) 1.103 *** (1.095 t o 1.112 ) 1.104 *** (1.095 t o 1.112 ) 1.103 *** (1.095 t o 1.111 ) 1.102 *** (1.094 t o 1.110 ) Y rs s ince i n ter v iew 1.109 *** (1.098 t o 1.120 ) 1.111 *** (1.100 t o 1.123 ) 1.114 *** (1.103 t o 1.125 ) 1.115 *** (1.104 t o 1.127 ) 1.115 * ** (1.103 t o 1.126 ) Sex ( ref : f em al e) 1.352 *** (1.236 t o 1.479 ) 1.405 *** (1.274 t o 1.550 ) 1.361 *** (1.240 t o 1.495 ) 1.363 *** (1.237 t o 1.503 ) 1.325 *** (1.208 t o 1.453 ) R ac e ( re f: N H w hi te ) N H bl ac k 1.388 *** (1.248 t o 1.545 ) 1.326 **
* (1.190 t
when controlling for the fact that members of this group are more likely to have ever
been obese. There are similar declines in the odds ratios across Models 1, 2, and 3 for
high school graduates and those with some college. I account for rescaling using Karlson,
Holm, & Breen (2012) decompositions in Section 3.3 below.
Model 4 controls for maximum and survey BMI simultaneously. The odds ratios
for education in Model 4 are somewhat larger than those in the maximum BMI model
and somewhat smaller than those in the survey BMI model (though the differences are
not statistically significant). This indicates that, when analyzed jointly in the context of
educational mortality disparities, survey and maximum BMI may work in opposite
directions. As shown in Table 1, less educated individuals are both more likely to have
weighed more and to have lost more weight (likely due to illness): this reality is captured
when controlling for both survey and maximum BMI in a model of mortality. The
presence of maximum BMI in Model 4 shrinks mortality disparities by accounting for
having ever been obese, while survey BMI widens disparities by capturing weight loss.
That Model 4 is detecting illness-induced weight loss is further evidenced by the
odds ratios for the adiposity measures themselves. The nadir of the relationship between
survey BMI and mortality in Model 2 is 18.7 kg/m2, meaning that a higher BMI at survey
is associated with increased mortality above 18.7 kg/m2. In Model 4, however, survey
BMI does not have a positive association with mortality until a BMI value of 72.0 kg/m2.
The odds of dying in Model 4 are higher for obese individuals who have lost weight than
for similarly obese individuals who have maintained their weight: a finding indicative of
Model 5, which controls for both maximum BMI and weight lost from maximum
BMI, further supports the claim that reverse causation is at work in Model 4. In Model 5,
the odds of dying increase by 3.5% for each additional unit of maximum BMI, and
decrease by 5.0% for each BMI unit of weight loss. In this model, the survival advantage
of a college degree shrinks to an all-time low: we can explain a greater share of the
mortality gradient by controlling for the fact that while people with lower levels of
education tend to have weighed more than their higher educated counterparts in the past,
they also tend to have lost more weight, presumably because of illness. However, the
goal of the present analysis is not to account for the largest share of the gradient possible,
but rather to estimate the share of the gradient attributable to differential adiposity—not
adiposity and weight loss. Models 4 and 5 illustrate that when both maximum and current
BMI are in the model, the mortality hazards associated with weight loss become a
prominent factor. This reverse causal path is not the subject of this paper and creates a
statistical disturbance in investigating the subject of interest. As a result, I discard Models
4 and 5 for purposes of answering the fundamental question posed in this paper.
Having thus excluded Models 4 and 5, I turn to model performance criteria AIC
and BIC, presented in Table 3. Model 3, using maximum BMI, performs better than
Models 1 and 2 (AIC values of 35,320 versus 35,461 and 35,417, respectively; BIC
values of 35,456 versus 35,587 and 35,563, respectively). This finding is consistent with
previous research using model selection criteria to compare models using maximum and
Karlson, Holm, & Breen decompositions
Figure 1 displays direct results of the KHB decompositions, estimating the
percentage of the college-graduate mortality advantage that is associated with differences
in adiposity, using four different measures of adiposity. When estimated using maximum
BMI, the best-performing variable, adiposity is associated with between 10.3% and
12.0% of differences between those with and without four-year degrees. This is roughly
three times the explanatory power of survey BMI, which is associated with between 3.3%
and 4.6% of differences. Figure 1 also includes results examining the explanatory power
of two additional measures of body fat: waist circumference at survey and BMI at age 25.
BMI at age 25 performs similarly to survey BMI, explaining 2.7-4.9% of the differential,
while waist circumference is associated with a somewhat larger proportion of mortality
differences (5.1-7.0%).
Figure 2 presents results by sex and smoking status, using only maximum BMI.
Among women, differences in maximum BMI are associated with 15.1-16.8% of the
mortality advantage of college graduates. For men, this proportion is smaller and more
variable, ranging from 7.0-12.1%, likely due in part to the higher prevalence of smoking
among men (Jamal et al. 2015) and the stronger education-obesity gradient among
women (Yu 2012). Among never-smokers, adiposity is an even more powerful mediator
in the relationship between education and mortality: between 18.4% and 27.6% of the
mortality advantage for college graduates among never-smokers is associated with
Figure 1. Percentage of mortality differences between college graduates and others mediated by adiposity, by adiposity measure.
Karlson, Holm, & Breen (2012) decompositions of discrete time logistic regressions. All models include adiposity and smoking status as mediators of the relationship between education and mortality. All models include additional covariates for age at baseline, years since interview, sex, and race/ethnicity. Survey WC: waist
circumference measured at survey.
Figure 2. Percentage of mortality differences between college graduates and others mediated by maximum BMI, by sex and smoking status.
Karlson, Holm, & Breen (2012) decompositions of discrete time logistic regressions. All models include adiposity and smoking status (if applicable) as mediators of the relationship between education and mortality. All models include additional covariates for age at baseline, years since interview, sex (if applicable), and race/ethnicity.
Discussion and conclusion
Despite large gains in life expectancy in the United States and other high income
countries over the past century, substantial differences in mortality conditions persist
across subpopulations. One of many stratifying dimensions is educational attainment:
people with fewer years of schooling live fewer years, and spend fewer of these years
healthy (see e.g., Elo 2009; Hayward et al. 2015; Laditka and Laditka 2016; Mackenbach
et al. 2008; Mackenbach et al. 2015). Using nationally-representative data, I find that
educational differences in adiposity contribute to this disparity in the United States,
though the size of adiposity’s contribution is sensitive to how adiposity is measured.
The majority of prior work, finding little or no association between obesity and
educational differences in mortality, relies exclusively on a single, cross-sectional
observation of BMI at time of survey. This approach can underestimate the risks of
obesity since reverse causation due to illness biases the mortality risks of obesity
downward (Stokes and Preston 2016; Stokes and Preston 2016). Given that less educated
people are more likely to contract illnesses that induce weight loss, the likelihood of
reverse causation is especially great among less educated people, making analyses of
socio-economic differences in mortality particularly sensitive to the biases accompanying
BMI at survey. A growing body of research documents that lifetime maximum BMI is a
more reliable indicator of adiposity, both because it skirts issues of reverse causation and
because it contains information relating to weight history, which may have enduring
predictive power for mortality (Stokes and Preston 2016). This paper is the first to exploit
The main analysis compared models of mortality using BMI at survey and
lifetime maximum BMI, finding that, based on model performance criteria AIC and BIC,
a model with maximum BMI best explained the observed data. This result is consistent
with existing research demonstrating the strengths of maximum BMI as a variable to
estimate obesity (Preston et al. 2015; Stokes and Preston 2016). I find that having ever
been obese is associated with increased mortality, net of current weight, and that having
ever been obese accounts for roughly three times more of the educational gradient in
mortality than does current weight status. Between 10.3% and 12.0% of the mortality
advantage of college graduates over non-graduates is associated with differences in
maximum BMI, compared to between 3.3% and 4.6% with survey BMI. One explanation
for the greater explanatory ability of maximum BMI is that less educated individuals are
more likely to contract illnesses that result in weight loss: a distinction overlooked by
survey BMI. A second is that maximum BMI captures elements of weight history
predictive of mortality (Preston et al. 2013), elements which are likely to vary with SES
(Pampel et al. 2010).
A limitation of this study is that the maximum BMI measure does not indicate at
what age an individual reached peak weight, nor for how long that weight was
maintained. A second limitation of this analysis is that maximum weight in NHANES is
based on recalled highest-ever weight and, judging from patterns observed in the Health
and Retirement Survey (HRS), likely over-estimated. Nevertheless, measured and
recalled peak weight in the HRS are highly correlated at 0.948 (Stokes and Ni 2016).
bias from weight self-reporting (Preston et al. 2015). A third limitation is that the
demonstrated relationship is not causal: having ever been obese is associated with
educational disparities in mortality. Examining the pathways between maximum BMI
and mortality, and whether they are causal, are important avenues for future research.
This study also does not provide insight into the upstream factors shaping differential
obesity prevalence by educational attainment in the first place.
The superior performance of maximum BMI highlights the need for health
surveys to collect data on maximum weight. Without declines in obesity prevalence, the
role of obesity in shaping the education-mortality relationship is likely to grow. Although
the sharp decline in smoking in recent years (Jamal et al. 2015) is a positive development
for health outcomes, it also indicates that obesity may take on a larger role in driving
mortality differentials. Among the growing number of never-smokers, maximum BMI is
associated with over one-fifth (18.4-27.6%) of the survival advantage of college
graduates, underscoring the urgency of levelling differences in obesity prevalence by
References
Global Health Observatory data repository (2016).Obesity estimates by country
[electronic resource]. Geneva: World Health Organization. http://apps.who.int/gho/data/node.main.A900A?lang=en
Abdullah, A., Amin, F. A., Stoelwinder, J., Tanamas, S. K., Wolfe, R., Barendregt, J., and Peeters, A. (2014). Estimating the risk of cardiovascular disease using an
obese-years metric. BMJ Open 4(9).
Abdullah, A., Stoelwinder, J., Shortreed, S., Wolfe, R., Stevenson, C., Walls, H., de Courten, M., and Peeters, A. (2011). The duration of obesity and the risk of type 2
diabetes. Public Health Nutrition 14(1): 119-126.
Ahmed, J., Homa, D. M., O’Connor, E., Babb, S. D., Caraballo, R. S., Singh, T., Hu, S. S., and King, B. A. (2015). Current cigarette smoking among adults—United States
2005-2014.Centers for Disease Control and Prevention Morbidity and Mortality
Weekly Report64(44): 1233-40. Atlanta: National Center for Health Statistics.
Alley, D. E. and Chang, V. W. (2007). The changing relationship of obesity and
disability, 1988-2004. Journal of the American Medical Association 298(17):
2020-2027.
Alley, D. E., Metter, E. J., Griswold, M. E., Harris, T. B., Simonsick, E. M., Longo, D. L., and Ferrucci, L. (2010). Changes in weight at the end of life: Characterizing
weight loss by time to death in a cohort study of older men. American Journal of
Epidemiology 172(5): 558-565.
Audrain-McGovern, J. and Benowitz, N. L. (2011). Cigarette smoking, nicotine, and
body weight. Clinical Pharmacology & Therapeutics 90(1): 164-168.
Centers for Disease Control and Prevention. (2015). NHANES response rates and population totals [electronic resource]. Atlanta: National Center for Health Statistics. https://www.cdc.gov/nchs/nhanes/response_rates_cps.htm
Centers for Disease Control and Prevention. (1996). Analytic reporting guidelines: The third National Health and Nutrition Examination Survey, NHANES III (1988-94). Hyattsville: National Center for Health Statistics.
Chang, V. and Lauderdale, D. (2005). Income disparities in body mass index and obesity
in the United States, 1971-2002. Archives of Internal Medicine 165(18): 2122-2128.
Devaux, M. and Sassi, F. (2013). Social inequalities in obesity and overweight in 11
Elo, I. T., Preston, S. H., and Mehta, N. (Forthcoming). The contribution of weight status
to Black-White differences in mortality and life expectancy. Biodemography and
Social Biology.
Elo, I. T. (2009). Social class differentials in health and mortality: Patterns and
explanations in comparative perspective. Annual Review of Sociology 35: 553-572.
Finucane, M. M. et al. (2011). National, regional, and global trends in body-mass index since 1980: Systematic analysis of health examination surveys and epidemiological
studies with 960 country-years and 9.1 million participants. Lancet 377(9765):
557-567.
Flegal, K. M., Graubard, B. I., Williamson, D. F., and Gail, M. H. (2007a). Cause-specific excess deaths associated with underweight, overweight, and obesity.
Journal of the American Medical Association 298(17): 2028-2037.
Flegal, K. M., Graubard, B. I., Williamson, D. F., and Gail, M. H. (2007b). Impact of smoking and preexisting illness on estimates of the fractions of deaths associated
with underweight, overweight, and obesity in the US population. American Journal
of Epidemiology 166(8): 975-982.
Global BMI Mortality Collaboration (2016). Body-mass index and all-cause mortality: Individual-participant-data meta-analysis of 239 prospective studies in four
continents. Lancet 388(10046): 776-786.
Hayward, M. D., Hummer, R. A., and Sasson, I. (2015). Trends and group differences in the association between educational attainment and US adult mortality: Implications
for understanding education’s causal influence. Social Science & Medicine 127:
8-18.
Heymsfield, S. B., Peterson, C. M., Thomas, D. M., Heo, M., and Schuna, J. M., Jr. (2016). Why are there race/ethnic differences in adult body mass index-adiposity
relationships? A quantitative critical review. Obesity Reviews 17(3): 262-275.
Hu, F. (2008). Obesity and mortality. In F. Hu (ed.). Obesity epidemiology. New York:
Oxford University Press: 213-233.
Johnson, C. L., Paulose-Ram, R., and Ogden, C. L. (2013). National Health and Nutrition
Examination Survey: Analytic guidelines, 1999-2000.Vital and Health Statistics.
2(161). Atlanta: National Center for Health Statistics.
Karlson, K. B., Holm, A., and Breen, R. (2012). Comparing regression coefficients between same-sample nested models using logit and probit: A new method.
Kivimaki, M., Ferrie, J. E., Batty, G. D., Smith, G. D., Elovainio, M., Marmot, M. G., and Shipley, M. J. (2008). Optimal form of operationalizing BMI in relation to
all-cause and all-cause-specific mortality: The original Whitehall study. Obesity 16(8):
1926-1932.
Laditka, J. N. and Laditka, S. B. (2016). Associations of educational attainment with disability and life expectancy by race and gender in the United States: A
longitudinal analysis of the Panel Study of Income Dynamics. Journal of Aging and
Health 28(8): 1403-1425.
Mackenbach, J. P., Kulhanova, I., Menvielle, G., Bopp, M., Borrell, C., Costa, G., Deboosere, P., Esnaola, S., Kalediene, R., Kovacs, K., Leinsalu, M., Martikainen, P., Regidor, E., Rodriguez-Sanz, M., Strand, B. H., Hoffmann, R., Eikemo, T. A., Ostergren, O., Lundberg, O., and Eurothine EURO-GBD-SE Consortiums. (2015). Trends in inequalities in premature mortality: A study of 3.2 million deaths in 13
European countries. Journal of Epidemiology and Community Health 69(3):
207-217.
Mackenbach, J. P., Stirbu, I., Roskam, A. R., Schaap, M. M., Menvielle, G., Leinsalu, M., Kunst, A. E., and European Union Working Grp Socioec. (2008).
Socioeconomic inequalities in health in 22 European countries. New England
Journal of Medicine 358(23): 2468-2481.
Mehta, N. K., House, J. S., and Elliott, M. R. (2015). Dynamics of health behaviours and
socioeconomic differences in mortality in the USA. Journal of Epidemiology and
Community Health 69(5): 416-422.
Mehta, N. K., Stenholm, S., Elo, I. T., Aromaa, A., Heliovaara, M., and Koskinen, S. (2014). Weight histories and mortality among Finnish adults the role of duration
and peak body mass index. Epidemiology 25(5): 707-710.
Miniño, A. M., Arias, E., Kochanek, K. D., Murphy, S. L., and Smith, B. L. (2002). Deaths: Final Data for 2000. National Vital Statistics Reports. 50(15). Hyattsville, Maryland: National Center for Health Statistics.
Montez, J. K. and Zajacova, A. (2013). Explaining the widening education gap in
mortality among U.S. white women. Journal of Health and Social Behavior 54(2):
165-181.