382 | P a g e
AN EPISTEMOLOGY BASED STUDY TO IMPROVE
TEACHING METHODOLOGY FOR NON-CS
STUDENTS IN C-PROGRAMMING
Himdweep Khurana
1, Dr. Ajay Rana
21
Amity School of Engineering & Technology, Amity University, Noida (UP), (India)
2
ATPC, Amity School of Engineering & Technology, Amity University, Noida (UP), (India)
ABSTRACT
There is a strong need to build engineering attitude and aptitude in the engineering graduates to address the
grand engineering challenges of the 21st century. The biggest challenge in today’s scenarios which the faculty
members and curriculum designers face is how to impart and ensure the engineering know how being provided
to the engineering students is being learnt equally by all of their students. How they can help their students
learn more effectively and efficiently? How they can reduce the gap between the best performers in the class
and worst performers? How the class average can be improved while standard deviation can be reduced and
how can they be prepared for the future challenges of the corporate world where they need to work in teams?
The main goal of this paper is to show case how self-help groups helped in achieving the objectives stated above
especially in computer programing for non-computer science background students. The epistemology based
study was conducted on non-computer science background students using blended learning model with self-help
groups. The results showed significant improvement in learning of the entire groups of students.
Keywords – Blended Learning Model, Engineering Education, Epistemology, Learning Models,
Self-Help Groups
I INTRODUCTION
The biggest challenge which today’s faculty member’s face is how to impart and ensure the engineering know
how being provided to the engineering students is being learnt equally by all of their students. For this one needs
to fully understand how the various faculty members teach and how the students learn. The various ways in
which the Faculty members teach is some instructors lecture some of them demonstrate or discuss, some of
them focus on principles, some on applications, some emphasize memorizing and others on understanding.
Some of the instructors who are smart and creative use various styles based upon the topic they are teaching and
use which they feel is most appropriate. Further the faculty members who understand the nuances of it are able
to adapt to it and change their styles as per the need of the hour [1]. Similarly students learn in many ways - by
seeing and hearing; reflecting and acting; reasoning logically and intuitively; memorizing and visualizing and
drawing analogies and building mathematical models; steadily and in fits and starts. How much a given student
383 | P a g e
compatibility of his or her learning style and the instructor’s teaching style.[2] The following diagram [3]depicts the various ways in which people learn:
Figure 1: Peoples Learning Styles [3]
The past studies reveal mismatches exists between common learning styles of engineering students and
traditional teaching styles of engineering professors[4]. As a consequence of it students become bored and
inattentive in class and do poorly on tests which lead them to get discouraged about the courses, the curriculum,
and themselves. Most serious consequence is society loses potentially excellent engineers. The challenge is how
a Faculty can effectively and efficiently train its engineering students and ensure that they reach a common
minimum level of understanding of concepts and its applications. The challenge is to ensure the average score
(mean or µ) in the class improves and the standard deviation (σ) in the class reduces hence signifying that each
and every student has gained equally what the faculty or instructor wanted them to learn. To meet this challenge
one needs to use the blended learning model i.e. weaving in various teaching and learning styles. In one such
attempt we introduced and integrated self-help groups into the traditional teaching models such as learner
centered model, knowledge centered model, assessment centered model and community centered model
resulting in blended teaching model.
The figure below shows the blended learning model which is basis for our study:
384 | P a g e
Apart from the regular class work which already uses learner centric and assessment centric learning models andhands on practice the concept of self -help groups was introduced. In this concept the class was further divided
into different groups in which each group consisted of six students. Then one student from each group was
chosen as a leader and assigned the responsibility of completing the group assignments and ensuring that each of
his or her team members fully understands the concept as well as applications behind the assignment.
II. PROBLEM STATEMENT
The main goal of the study was to measure the quantitative improvements in learning of the students while using
the blended learning model with prime focus on cooperative / group learning and validate the hypothesis that
self-help groups help in improving the entire group’s performance. The various parameters to measure the
performance of group identified are average class marks (mean), range of marks, Standard Deviation. Minimum
marks, maximum marks and median.
III. METHODOLOGY
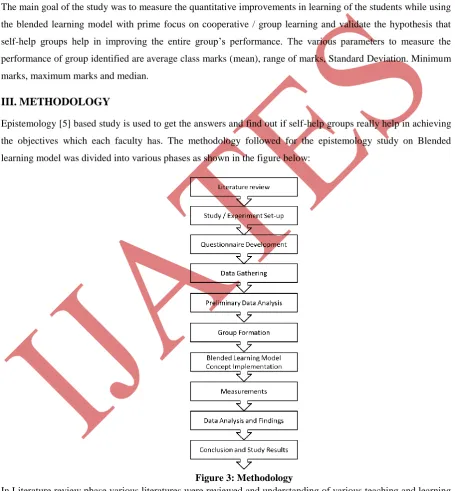
Epistemology [5] based study is used to get the answers and find out if self-help groups really help in achieving
the objectives which each faculty has. The methodology followed for the epistemology study on Blended
learning model was divided into various phases as shown in the figure below:
Figure 3: Methodology
In Literature review phase various literatures were reviewed and understanding of various teaching and learning
styles was acquired. Insight was gained into the various learning models employed in the field of engineering
education. Based upon the literature review it was understood that the most common method used in field of
education is blended learning model[6] which encompasses characteristics Learner centric[6], Knowledge
385 | P a g e
into it. Some engineering institutes have started to incorporate some aspects of the community centric learning.The clear understanding was developed on engineering epistemology and how it can be used in the current
study. Based upon the understanding the scope of study was decided keeping the following objectives:
To find out if group based assignments and learning (community based learning [8]) is incorporated in
traditional blended learning model is better or not than the traditional blended learning model.
To quantify how much improvement is achieved if group based assignments and learning (community
based learning) is incorporated in traditional blended learning model in comparison to the traditional
blended learning model.
The three groups were formed. One group consisted of students who followed the traditional learning approach
while the other two groups were was put through blended model of learning incorporating self-help [9] group
aspect of community based learning. The marks data from Sessional-I, Sessional-II and Sessional – III (Pre
University Test) was collected and analyzed.
The various assumptions take during the study are:
The Assessment tests conducted are always of the same nature, characteristics and difficulty level such that
their results can be cross compared.
The results of Assessments tests conducted in regular course work reflects the actual learning of the
students
The students having similar academic profiles will behave in same fashion The students with similar academic backgrounds will behave in same fashion
Marks obtained by individuals is the right measure to measure their learning and compare across groups
The data was gathered in the form of questionnaires which focused on three aspects, academic background,
demographic profile and current measurements as per the study requirement. The data was collated and
analyzed.
IV. ANALYSIS
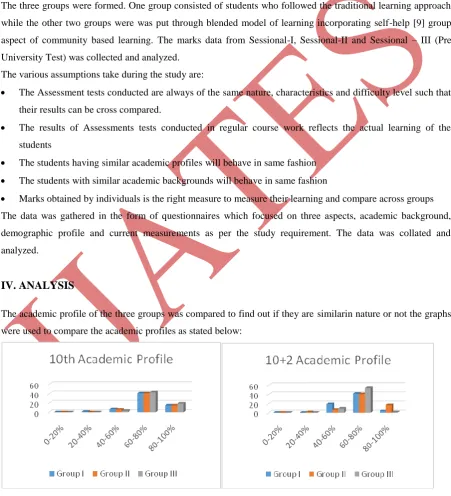
The academic profile of the three groups was compared to find out if they are similarin nature or not the graphs
were used to compare the academic profiles as stated below:
386 | P a g e
Table 1: 10
thAcademic Profile Table 2: Academic Profile 10+2
Based upon the data the groups I, II, IIIare almost similar with only exception of Group III being little better
academically.It implies thatthese three groups are comparable and the performance of these three groups in three
test on the seven parameters which are being used to measure the performance of the group can be compared.
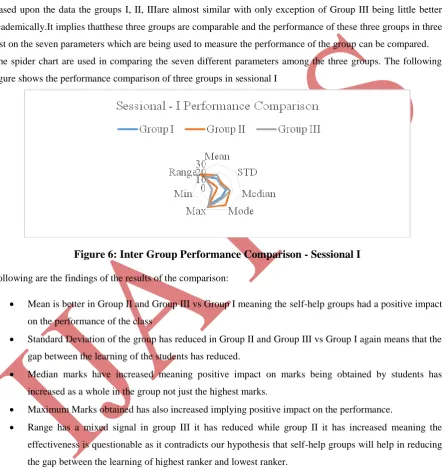
The spider chart are used in comparing the seven different parameters among the three groups. The following
figure shows the performance comparison of three groups in sessional I
Figure 6: Inter Group Performance Comparison - Sessional I
Following are the findings of the results of the comparison:
Mean is better in Group II and Group III vs Group I meaning the self-help groups had a positive impact
on the performance of the class
Standard Deviation of the group has reduced in Group II and Group III vs Group I again means that the
gap between the learning of the students has reduced.
Median marks have increased meaning positive impact on marks being obtained by students has
increased as a whole in the group not just the highest marks.
Maximum Marks obtained has also increased implying positive impact on the performance.
Range has a mixed signal in group III it has reduced while group II it has increased meaning the
effectiveness is questionable as it contradicts our hypothesis that self-help groups will help in reducing
387 | P a g e
Figure7: Inter Group Performance Comparison - Sessional II
Mean is better in Group II and Group III vs Group I meaning the self-help groups had a positive impact
on the performance of the class in the subject
Standard Deviation of the group has reduced in Group II and Group III vs Group I again means that the
gap between the learning of the students has reduced.
Median marks have increased meaning positive impact on marks being obtained by students has
increased as a whole in the group not just the highest marks.
Maximum Marks obtained has also increased implying positive impact on the performance.
Range has reduced in both Group II and Group III which means self-Help Groups have positive impact
and they help in reducing the gap of learning between the students. In other words self-help groups are
effective and they in reducing the gap between the learning of highest ranker and lowest ranker.
Figure 8: Inter Group Performance Comparison - Sessional III (PUT)
Mean is better in Group II and Group III vs Group I meaning the self-help groups had a positive impact
on the performance of the class in the subject
Standard Deviation of the group has reduced in Group II and Group III vs Group I again means that the
gap between the learning of the students has reduced.
Median marks have increased meaning positive impact on marks being obtained by students has
increased as a whole in the group not just the highest marks.
388 | P a g e
Weaker students have also benefitted from it as minimum marks have also improved in the group Range has reduced in both Group II and Group III which means self-Help Groups have positive impact
and they help in reducing the gap of learning between the students.
V. CONCLUSION
Based upon the current study and data of three groups it is concluded that use of self – help groups in the
teaching style helps in improving the performance of the entire class individually as well as whole class. The
various parameters mean score, standard deviation, range, median, maximum and minimum scores etc. used for
measuring the improvement clearly indicated and supported the hypothesis. Further a detailed and elaborate
study can be conducted over a period of time to further strengthen the claims of the hypothesis that Self-help
groups help in improving the performance of the entire group of students.
REFERRENCES
1) W.J. McKeachie, Teaching Tips: Strategies, Research, and Theory for College and University
Teachers, 10th edn., Houghton Mifflin, Boston, 1999
2) Accreditation Board for Engineering and Technology. (2007). Criteria for accrediting engineering
programs. Retrieved from
http://www.abet.org/linked%20DocumentsUPDATE/Criteria%20and%20PP/E001%2008-09%20EAC%20Criteria%2011-30-07.pdf
3) Schommer, M. (1993). Comparisons of beliefs about the nature of knowledge and learning among
postsecondary students. Research in Higher Education, 34, 355-370. doi: 10.1007/BF00991849
4) Jehng, J. J., Johnson, S. D., & Anderson, R. C. (1993). Schooling and students’ epistemological beliefs
about learning. Contemporary Educational Psychology, 18, 23-35.
5) Muis, K. R. (2004). Personal epistemology and mathematics: A critical review and synthesis of
research. Review of Educational Research, 74, 317-377. doi: 10.3102/00346543074003317
6) Marra, R. M., Palmer, B., &Litzinger, T. A. (2000). The effects of a first-year engineering design
course on student intellectual development as measured by the Perry scheme. Journal of Engineering
Education, 89, 39-46
7) Fedler, R. M., & Brent, R. (2004). The intellectual development of science and engineering
students.Part 1: Models and challenges. Journal of Engineering Education, 93, 269
8) A. Rugarcia, R.M. Felder, J.E. Stice, and D.R. Woods, “The Future of Engineering Education: I. A
Vision for a New Century.” Chem. Engr. Education, in press 2010
9) Fitch, P., & Culver, R. S. (1984). Educational activities to stimulate intellectual development in Perry’s
![Figure 1: Peoples Learning Styles [3]](https://thumb-us.123doks.com/thumbv2/123dok_us/9165753.1455281/2.595.110.513.127.400/figure-peoples-learning-styles.webp)