R E S E A R C H
Open Access
Nerve conduction in relation to vibration
exposure - a non-positive cohort study
Helena Sandén
1*, Andreas Jonsson
1, B Gunnar Wallin
2, Lage Burström
3, Ronnie Lundström
3, Tohr Nilsson
3,4,
Mats Hagberg
1Abstract
Background:Peripheral neuropathy is one of the principal clinical disorders in workers with hand-arm vibration syndrome. Electrophysiological studies aimed at defining the nature of the injury have provided conflicting results. One reason for this lack of consistency might be the sparsity of published longitudinal etiological studies with both good assessment of exposure and a well-defined measure of disease. Against this background we measured conduction velocities in the hand after having assessed vibration exposure over 21 years in a cohort of manual workers.
Methods:The study group consisted of 155 male office and manual workers at an engineering plant that manufactured pulp and paper machinery. The study has a longitudinal design regarding exposure assessment and a cross-sectional design regarding the outcome of nerve conduction. Hand-arm vibration dose was calculated as the product of self-reported occupational exposure, collected by questionnaire and interviews, and the measured or estimated hand-arm vibration exposure in 1987, 1992, 1997, 2002, and 2008. Distal motor latencies in median and ulnar nerves and sensory nerve conduction over the carpal tunnel and the finger-palm segments in the median nerve were measured in 2008. Before the nerve conduction measurement, the subjects were systemically warmed by a bicycle ergometer test.
Results:There were no differences in distal latencies between subjects exposed to hand-arm vibration and unexposed subjects, neither in the sensory conduction latencies of the median nerve, nor in the motor conduction latencies of the median and ulnar nerves. Seven subjects (9%) in the exposed group and three subjects (12%) in the unexposed group had both pathological sensory nerve conduction at the wrist and symptoms suggestive of carpal tunnel syndrome.
Conclusion:Nerve conduction measurements of peripheral hand nerves revealed no exposure-response
association between hand-arm vibration exposure and distal neuropathy of the large myelinated fibers in a cohort of male office and manual workers.
Background
Peripheral neuropathy is one of the principal clinical disorders in workers with hand-arm vibration syndrome (HAVS). In vibration-associated neuropathy, conceivable target structures could be peripheral sensory receptors, large or thin myelinated nerve fibers, and the small-cali-ber, non-myelinated C fibers. Electrophysiological stu-dies aimed at defining the nature of the vibration injury have provided conflicting results [1]. Fractionated nerve
conduction velocity of the median nerve across the car-pal tunnel on vibration-exposed subjects with hand symptoms has revealed a bimodal velocity distribution, suggesting effect both at the carpal tunnel and at a more distal level, such as palm or finger [2]. Abnormal-ities that appear to be independent of clinical entrap-ment neuropathy have been recognized, and a distal pattern of delayed sensory nerve conduction localized at the digits has been described [3,4]. Pathological studies by cutaneous biopsy have demonstrated demyelinating neuropathy in the digital nerves of individuals with HAVS [5]. On the other hand, Lander et al. found that median and ulnar neuropathies proximal to the hand * Correspondence: [email protected]
1Occupational and Environmental Medicine, Sahlgrenska School of Public
Health and Community Medicine, University of Gothenburg, Sweden
are more common than digital neuropathies in hand-arm vibration exposed workers with neurological symp-toms [6]. However, in a 17-year prospective study of industrial workers, Nathan et al.[7] reported that work-place factors, including managing vibratory tools, appeared to bear an uncertain relationship to carpal tunnel syndrome and Cherniack et al. [8] reported that the significant differences in digital sensory conduction velocities between vibration-exposed and non-exposed workers were eliminated after systemic warming.
One reason for this lack of consistency might be the sparsity of published longitudinal etiological studies which include both a good assessment of exposure and a well-defined measure of disease. In occupational stu-dies that require specification of previous exposure there is always a risk of recall bias. To get a better understanding of exposure-response relationships, it would be desirable to have a longitudinal study design to obtain a more accurate exposure assessment.
The aim of the present study was to assess the possi-ble reductions in median and ulnar nerve conduction velocities in hand-arm vibration exposed workers com-pared to unexposed workers. To this end, we measured the motor and sensory conduction velocities after having assessed vibration exposure over 21 years in a cohort of manual workers.
Materials and methods
The study design was cross-sectional regarding the out-come of nerve conduction but longitudinal regarding exposure assessment. The cohort studied was recruited in 1987 and 1992 and has since been followed and assessed for vibration exposure. Ethical approval was obtained by the Regional Ethics Committee in Umeå (Dnr 07-161M).
Subjects
The cohort consisted of male office workers and male manual workers, all full-time employees at an engineer-ing plant that manufactured pulp and paper machinery. The subjects were recruited from the plant’s payroll ros-ters in two stages: 151 subjects from the roster of Janu-ary 1, 1987 and 90 subjects from that of JanuJanu-ary 31, 1992. An upper age limit of 55 years was set for inclu-sion. From the 1987 roster, 61 of 500 male office work-ers, including salesmen, managwork-ers, enginework-ers, secretaries, and economic clerks, were randomly invited into the study. At the baseline examination in February 1987, 93 of 112 manual workers, including welders, grinders, turners, and steel platers, were available for invitation. Three manual workers declined to enter the study. A total of 151 subjects, 61 office workers and 90 manual workers, were examined and entered the cohort in 1987. In 1992, an additional 33 randomly invited office
workers and 57 more manual workers who had been hired after 1987 were examined and added to the cohort (none of the invited subjects declined). Thus, in 1992 the cohort (baseline) consisted of 241 subjects.
Follow-ups were conducted in 1997, 2002, and 2008, i.e. 10, 15, and 21 years after recruitment of the original cohort. At the 10-year follow-up the study group con-sisted of 220 subjects (9% loss from baseline); at 15 years there were 195 subjects (19% loss from baseline), and at the 21-year follow-up 197 subjects (18% loss from base-line) remained in the cohort (Table 1). The subjects that were lost to follow-up and the returners have been ana-lyzed for age and exposure. They did not differ from those not lost to follow-up. The exposure assessment at baseline revealed that some of the office workers had for-merly been exposed to hand-arm exposure and some manual workers were not currently exposed to hand-arm vibration. To simplify, we used the terms exposed, cur-rently exposed and unexposed subjects in the presenta-tion of the study populapresenta-tion (Table 1).
In 2008, all 197 subjects were invited to participate in nerve conduction measurements and 163 subjects were finally examined (83%). The most common reasons for not attending the nerve conduction measurements were that the subjects had retired or moved away from the area. Six subjects were excluded due to diabetes and two subjects due to polyneuropathy. Thus, the nerve conduction study group consisted of 155 subjects.
Five subjects reported a history of carpal tunnel release in the right hand and one subject in the left hand. These hands were also excluded. In some subjects reliable measurements were not obtained due to electro-magnetic interference, and some measurements were discontinued because of discomfort. Therefore, the final material of motor conduction measurements consisted of 150 right hands and 148 left hands for the median nerve and 152 right hands and 148 left hands for the ulnar nerve. Median sensory conduction measurements were made in 105 right and 99 left hands.
Medical examination and questionnaire
Each subject was interviewed regarding symptoms and examined by a physician (T.N). A standard procedure was followed for physical examination of the neuromuscular and skeletal systems of the upper extremities in order to check for and identify other diseases, primarily polyneuro-pathy. The subjects provided supplementary basic data through a questionnaire. The questions covered age, work and years at work, exposure, chronic disease, symptoms, and use of nicotine and/or alcohol (Table 2).
Exposure assessment
as collected by questionnaire and interviews, and the measured or estimated hand-arm vibration exposure in 1987, 1992, 1997, 2002, and 2008. In the calculations, the exposure during the periods between the investiga-tions has been estimated based on values from the latest study. The assessment of vibration exposure was made under normal working conditions with standardized equipment and methods [9] by measuring the intensity of vibration on a random selection of the tools used by the manual workers in accordance with international standards [10,11]. The total number of tools included in the study was 306 and during each investigation period the number of tools that measurement were conducted on varied between 45 and 128, corresponding to between 50% and 90% of the total number of tools used at the workshop. For hand-held tools with two handles,
measurements were made on both handles and the highest measured vibration intensity was used in the analysis. The most commonly used tools were grinders and hammers and their mean frequency-weighted accel-eration values have decreased over the investigation period from 5.8 to 4.5 m/s2 and 11.0 to 7.6 m/s2, respectively [12].
The subjective assessments of daily exposure time were collected by questionnaire and interview. In the questionnaire, the workers were asked to estimate the amount of time (minutes per day) they were exposed to vibration while using the different types of hand-held vibrating tools during their last working day. In the interview workers who had been exposed before 1987 or ended exposure before 1987 were questioned about their use of hand-held vibrating tools (type, exposure Table 1 Study population at baseline and follow ups, 1987-2008
1987 1987-1992a 1997 2002 2008
Total 151 241 220 195 197
Exposedd 112(83) 181(108) 165(90) 141(57) 146(52)
Unexposed 39 60 55 54 51
Returners from baseline (1987-1992)c Exposedd 8(1) 26(13)
Unexposed 3 2
Lost to Follow up Exposede 9b(7) 16(12) 32(22) 21(4)
Unexposed 3b 5 4 5
a
Baseline 1987-1992. Baseline consists of subjects entering the study in 1987 and 1992.
b
Lost to follow up between 1987 and 1992. The subjects are included in baseline (n = 241).
c
Subjects who were included at baseline, lost to follow up, but returned later to the study group in 2002 and/or 2008.
d
Subjects that currently are or previously have been exposed, the currently exposed in brackets.
e
Subjects that currently are or previously have been exposed, the currently exposed (based on the latest study) in brackets.
Table 2 Study population characteristics, n = 155
Variable Median, (range) or number
Exposed Unexposed
All (n = 116)
Formerly (n = 70)
Currently (n = 46)
(n = 39)
Age (years) 55 (37-75) 58 (37-75) 46 (38-64) 60 (41-74)
Height (cm) 179 (166-193) 180 (167-193) 178 (166-190) 178 (170-192)
Weight (kg) 86 (62-161) 86 (64-116) 86 (62-161) 80 (63-135)
Cigarettes smoker 24 14 10 3
Alcohol≥14 units/week 8 4 4 2
Rheumatic disease 0 0 0 1
Thyroid disease 3 2 1 1
Nocturnal symptoms (numbness/tingling)
Right hand 28 17 11 6
Left hand 29 19 10 7
Pain (wrist)
Right hand 27 18 9 2
Left hand 20 14 6 4
Clumsiness (difficulties in button clothing)
Right hand 29 20 9 4
time). The total daily exposure time for vibrating tools has decreased from 108 min in 1987 to 52 min per day in 2008 [12]. Leisure-time exposure (hobbies, snowmo-biling, motorcycling, etc.) was not included in this measure.
In the part of Sweden where the plant is located job change is infrequent. When students finish vocational school at approximately 18 years old they often find well-paying employment as manual workers and usually stay in the job as long as possible. Our interviews revealed that occupational exposure to hand-arm vibra-tion usually started at age 16 when most workers were in vocational school. Thus, we used the age 16 as onset of exposure time. In vocational school, the two last years consist mainly of work as a trainee. No worker who had any extended time away from hand-arm vibra-tion exposure returned to exposure again. However, some workers left exposed jobs and some of them did so due to vibration-induced vascular symptoms (“ vibra-tion white finger”).
The cumulative lifetime hand-arm vibration dose was calculated as the product of self-reported occupational exposure in hours and the squared acceleration of the measured or estimated hand-arm vibration exposure (i.e. dose = a2·t; unit m2s-4h). As an example, a worker using a grinder 3 hours per day and a hammer 30 minutes per day for 7 years at exposure values of 5 m/s2and 10 m/s2 respectively would have had a dose of 7 years × 220 days/ year × 3 hours/day × 52(m/s2)2+ 7 years × 220 days/year × 0.5 hours/day × 102(m/s2)2 = 192 500 m2s-4h. Those exposed were grouped into exposure quartiles with divi-sions at Q1 (25th centile), Q2 (median), and Q3 (75th centile). Class 1 includes subjects with hand-arm vibra-tion exposure values from 0 to≤Q1; class 2 includes subjects with values > Q1 to≤Q2; class 3 includes > Q2 to≤Q3, and class 4 includes the subjects with the high-est exposure values of > Q3. Class 0 contains unexposed subjects (hand-arm vibration exposure equal to zero) and is set as the reference category. Thus 5 classes of cumula-tive lifetime hand-arm vibration dose were obtained (Table 3).
Moreover, at the time for nerve conduction measure-ments, we calculated the current daily energy-equivalent
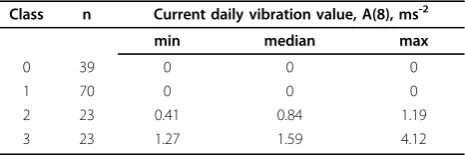
exposure value normalized to an eight-hour reference period (i.e. A(8); unit ms-2), in accordance with the Eur-opean directive for vibration [13]. The subjects were grouped into 4 classes regarding current daily exposure. Class 0 contains not ever exposed subjects and class 1 contains subjects with cumulative vibration hand-arm exposure but no current vibration exposure. Among those with current vibration exposure a division into 2 classes were done. Class 2 includes subjects with hand-arm exposure values from 0 to ≤ Q2 and class 3 includes subjects with values > Q2 (Table 4).
Unless otherwise indicated, when we refer in the text and tables to“exposed subjects”, we mean those subjects who currently are or earlier were exposed to hand-arm vibration and consequently the“unexposed subjects”are those who have never been exposed to hand-arm vibration.
Nerve conduction test
The nerve conduction measurement was performed in March 2008, during wintertime in Sundsvall, with snow and outdoor temperatures usually below 0°C. The aver-age outdoor temperature in March 2008 was -0.4°C.
To ensure an adequate hand temperature and mini-mize temperature as a source of error [14,15], the deter-mination of conduction velocity was preceded by a bicycle ergometer test, which has been shown to stabi-lize fingertip skin temperature at around 34°C [16]. Two consecutive runs of 6 min each were conducted on an electrically braked bicycle ergometer (Siemens-Elema). Men under 45 years of age began at load of 100 W, and after 6 min this was increased to 150 W. The equivalent loads for men over 45 were 50 and 100 W, respectively. Skin temperature was measured using a thermistor (Testo® 926, Germany) taped to the tip of digit IV. Dur-ing the nerve conduction test, the subjects were covered with warm blankets. Some participants could not per-form the bicycle ergometer test due to cardiovascular diseases or musculoskeletal problems. Seven subjects, therefore, were only covered with warm blankets and eight subjects did perform the bicycling, but only at a low load. There are mathematical formulas for tempera-ture corrections at low temperatempera-tures, but those are based on skin temperature at the wrist and are probably not reliable for skin temperature at the fingertip. Table 3 Cumulative lifetime hand-arm vibration exposure
dose
Class n Cumulative vibration dose (m2s-4h)
Min Median Max
0 39 0 0 0
1 29 2475 56 320 84 865
2 29 85800 128700 192500
3 29 197120 252648 359680
4 29 365420 566764 857813
Table 4 Current daily vibration exposure value
Class n Current daily vibration value, A(8), ms-2
min median max
0 39 0 0 0
1 70 0 0 0
2 23 0.41 0.84 1.19
Nerve conduction measurements were made in both arms and hands using a routine electromyography (EMG) apparatus (Keypoint® Portable, Keypoint Software Version 3.0, Medtronic NeuroMuscular, Denmark). The test was performed by an experienced EMG technician, who was blinded to the results of all other tests. The measurements were made on the second floor in the factory and we experienced some technical problems with electromagnetic interference.
The median nerve motor conduction velocity was determined using surface electrodes for stimulation at the elbow and proximal to the wrist and for recording over the abductor pollicis brevis muscle. The ulnar nerve motor conduction velocity was determined using surface electrodes for stimulation 2 cm proximal to the elbow and proximal to the wrist and for recording over the abductor digiti minimi muscle. The distance between the recording and stimulation electrodes at the wrist was 7 cm. The F-wave latency was measured as the shortest latency obtained with 20 stimuli at the wrist. Sensory conduction velocity (SCV) of the median nerve was determined orthodromically from the third finger to the palm and the wrist, respectively, using sur-face electrodes mounted at fixed sites in a plastic splint held against the skin over the nerve. The distance between recording and stimulation electrodes at the wrist (palm-wrist) was 60 mm and the corresponding distance at the finger and palm (digit III-palm) was 63 mm. Sural nerve SCV was also measured, in order to control for non-symptomatic polyneuropathy, but due to electromagnetic interference these measurements were unreliable and not analyzed in this study.
Statistics
All descriptive statistics for the study population and nerve conduction outcome are given as medians and ranges or means and standard deviations or as numbers and percentages. Classification of unexposed and hand-arm vibration-exposed individuals were made according to quartiles. Hand-arm vibration exposure is described according to class as minimum, median, and maximum. To compare nerve conduction, temperature, and age between groups, Student’s two sample t-test for inde-pendent groups was used. Paired t-test was used to compare an individual’s nerve conduction velocities between the right and left hands. A multivariate linear regression model was used to assess the association between nerve conduction outcome and exposure vari-ables. Backward elimination and forward selection pro-cedures were used to verify the multivariate linear regression model. The predictor variables in the model were considered to be of biological importance (age, height, weight, skin temperature, alcohol consumption, smoking, classes of vibration exposure, years since last
vibration exposure to date of test). Since cumulative vibration exposure and current vibration exposure partly include the same information, two separate models were considered, one for each vibration exposure. For com-paring prevalence of median nerve neuropathy, chi-square test and a variant of Fisher’s exact test [17] were used.
P-values < 0.05 was considered to be statistically sig-nificant. JMP® 7 and SAS 9.2 were used to perform the analyses.
Results
Descriptive characteristics of the study sample are pre-sented in Table 2. Subjects in the unexposed group and formerly exposed group were older than those in the currently exposed group. The groups did not differ regarding height, weight, or skin temperature during measurements.
The subjects who did not attend the nerve conduction measurements were analyzed for age and life-time cumulative hand-arm exposure and did not differ from the studied subjects.
Nerve conduction
Motor conduction velocity
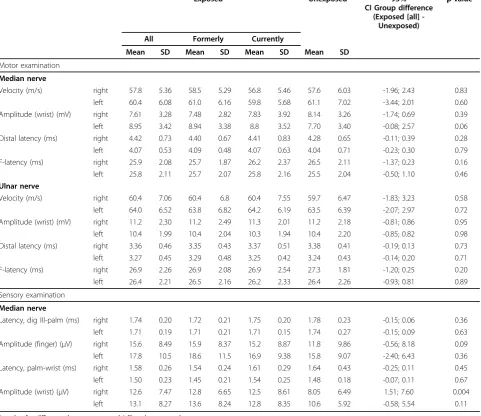
Median and ulnar nerves, distal latency There were
no significant differences in median or ulnar nerve distal latencies in either arm between exposed and unexposed subjects (Table 5), nor between classes with cumulative life-time exposure or current daily exposure (data not shown).
In the multivariate regression analysis, distal motor latency of the median nerve was associated with skin temperature (right/left hand) and age (left hand). Distal motor latency of the ulnar nerve was associated with skin temperature (right/left hand), and height (right/left hand). Neither the cumulative lifetime exposure nor the current daily exposure contributed to explaining the dis-tal latencies in the multiple linear regression models.
Paired t-test for individual measurements between right and left hands in median nerve gave a mean differ-ence of 0.32 ms (SE 0.04, p < 0.001) and the corre-sponding figure for the ulnar nerve was 0.09 ms (SE 0.03, p = 0.003). Approximately the same figures apply when analyzing data from exposed and unexposed sepa-rately. The right hands had the longer distal latency.
There were no significant differences in skin tempera-ture between classes of cumulative lifetime exposure or current daily exposure.
Sensory conduction examination
Median nerve, sensory latency, digit III-palmThere
were no significant differences in sensory latencies in either arm between exposed and unexposed subjects (Table 5), nor between classes with cumulative lifetime exposure (Figure 1a) or current daily exposure (Figure 1c).
In the multivariate regression analysis, the sensory latency of the median nerve (digit III-palm) was asso-ciated with skin temperature (right/left hand) and age (right/left hand). Neither cumulative lifetime exposure
nor current daily exposure contributed to explaining the sensory latency in the multiple linear regression models.
Paired t-test for individual measurements between right and left hands gave a mean difference of 0.03 ms (SE 0.01, p = 0.09). The differential between right and left hands was approximately the same when analyzing data from exposed and unexposed separately, although the p-values were higher (exposed; mean difference 0.02 ms [SE 0.02 p = 0.18] and unexposed; mean difference 0.03 [SE 0.03, p = 0.31]). The right hands had the longer latency.
Median nerve, sensory latency, palm-wristThere were no significant differences in sensory latencies in either arm between exposed and unexposed subjects (Table 5), Table 5 Nerve conduction measurements
Exposed Unexposed 95%
CI Group difference (Exposed [all]
-Unexposed)
p-value*
All Formerly Currently
Mean SD Mean SD Mean SD Mean SD
Motor examination
Median nerve
Velocity (m/s) right 57.8 5.36 58.5 5.29 56.8 5.46 57.6 6.03 -1.96; 2.43 0.83
left 60.4 6.08 61.0 6.16 59.8 5.68 61.1 7.02 -3.44; 2.01 0.60
Amplitude (wrist) (mV) right 7.61 3.28 7.48 2.82 7.83 3.92 8.14 3.26 -1.74; 0.69 0.39
left 8.95 3.42 8.94 3.38 8.8 3.52 7.70 3.40 -0.08; 2.57 0.06
Distal latency (ms) right 4.42 0.73 4.40 0.67 4.41 0.83 4.28 0.65 -0.11; 0.39 0.28
left 4.07 0.53 4.09 0.48 4.07 0.63 4.04 0.71 -0.23; 0.30 0.79
F-latency (ms) right 25.9 2.08 25.7 1.87 26.2 2.37 26.5 2.11 -1.37; 0.23 0.16
left 25.8 2.11 25.7 2.07 25.8 2.16 25.5 2.04 -0.50; 1.10 0.46
Ulnar nerve
Velocity (m/s) right 60.4 7.06 60.4 6.8 60.4 7.55 59.7 6.47 -1.83; 3.23 0.58
left 64.0 6.52 63.8 6.82 64.2 6.19 63.5 6.39 -2.07; 2.97 0.72
Amplitude (wrist) (mV) right 11.2 2.30 11.2 2.49 11.3 2.01 11.2 2.18 -0.81; 0.86 0.95
left 10.4 1.99 10.4 2.04 10.3 1.94 10.4 2.20 -0.85; 0.82 0.98
Distal latency (ms) right 3.36 0.46 3.35 0.43 3.37 0.51 3.38 0.41 -0.19; 0.13 0.73
left 3.27 0.45 3.29 0.48 3.25 0.42 3.24 0.43 -0.14; 0.20 0.71
F-latency (ms) right 26.9 2.26 26.9 2.08 26.9 2.54 27.3 1.81 -1.20; 0.25 0.20
left 26.4 2.21 26.5 2.16 26.2 2.33 26.4 2.26 -0.93; 0.81 0.89
Sensory examination
Median nerve
Latency, dig III-palm (ms) right 1.74 0.20 1.72 0.21 1.75 0.20 1.78 0.23 -0.15; 0.06 0.36
left 1.71 0.19 1.71 0.21 1.71 0.15 1.74 0.27 -0.15; 0.09 0.63
Amplitude (finger) (μV) right 15.6 8.49 15.9 8.37 15.2 8.87 11.8 9.86 -0.56; 8.18 0.09
left 17.8 10.5 18.6 11.5 16.9 9.38 15.8 9.07 -2.40; 6.43 0.36
Latency, palm-wrist (ms) right 1.58 0.26 1.54 0.24 1.61 0.29 1.64 0.43 -0.25; 0.11 0.45
left 1.50 0.23 1.45 0.21 1.54 0.25 1.48 0.18 -0.07; 0.11 0.67
Amplitude (wrist) (μV) right 12.6 7.47 12.8 6.65 12.5 8.61 8.05 6.49 1.51; 7.60 0.004
left 13.1 8.27 13.6 8.24 12.8 8.35 10.6 5.92 -0.58; 5.54 0.11
nor between classes with cumulative lifetime exposure (Figure 1b) or current daily exposure (Figure 1d).
In the multivariate regression analysis, the sensory latency of the median nerve (palm-wrist) was associated with skin temperature (right/left hand). Neither cumula-tive lifetime exposure nor current daily exposure
contributed to explaining the sensory latency in the multiple linear regression models.
Paired t-test for individual measurements between right and left hands gave a mean difference of 0.08 ms (SE 0.03, p = 0.004). When analyzing data from exposed and unexposed separately the paired t-test between right
and left hands of the exposed subjects gave a mean dif-ference of 0.06 (SE 0.02, p = 0.006) and the correspond-ing figure for the unexposed subjects was 0.12 (SE 0.08, p = 0.14). The right hands had the longer distal latency.
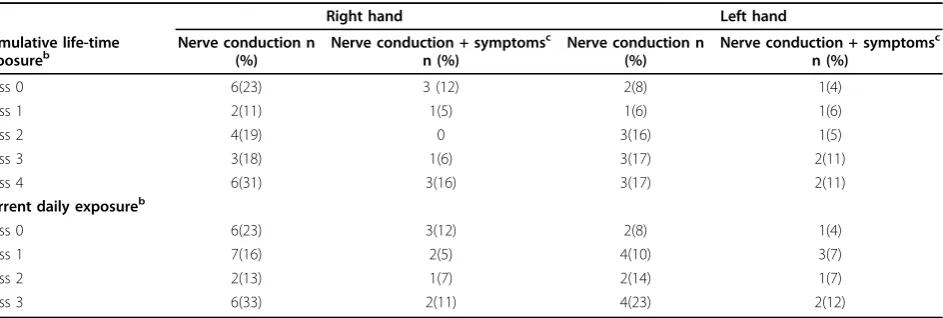
Neuropathy of the median nerve at the carpal tunnel segment was considered to be present when the sensory latency from palm to wrist was greater than 1.73 ms at a distance of 60 mm (the cut-off point represents 3SD of the mean value of a normal material collected with similar plastic splint equipment in our laboratory). With this cut-off point there were 15 right hands and 10 left hands with median nerve neuropathy in the exposed group. Corresponding numbers in the unexposed group were 6 and 2. There were 9 subjects with bilateral ian nerve neuropathy. Among these 33 hands with med-ian nerve neuropathy, there were 15 hands with one or several of the following symptoms: nocturnal numbness, pain in wrist or fingers, and difficulty in buttoning clothing, reported either in the questionnaire or during medical examination. There were 4 subjects with bilat-eral symptoms and bilatbilat-eral median nerve pathology. Presence of median nerve neuropathy with or without symptoms was independent of exposure class (Table 6).
The skin temperature during sensory conduction mea-surements was similar between unexposed (right hand 31.6 ± 4.3°C, left hand 31.5 ± 4.4°C) and exposed (right hand 31.6 ± 3.7°C, left hand 31.8 ± 3.6°C) subjects. There were no significant differences in skin tempera-ture between classes of cumulative life-time exposure (Figure 1e) or current daily exposure.
In all the above mentioned nerve conduction measure-ments we have also separately analyzed those subjects with current daily exposure (n = 46) and those with for-mer exposure without current exposure (n = 70) in lin-ear regression models. As the number of the subjects in each group was small, we used fewer predictive variables
in the models (age, skin temperature, classes of exposure and “years since last vibration exposure to date of test”). Neither the cumulative exposure nor the current daily exposure or “years since last vibration exposure to date of test” contributed to explaining the nerve conduction measurements.
Other nerve conduction measurements
There were no differences in any other measured nerve conduction parameter (conduction velocities, ampli-tudes, and f-latencies) between unexposed and exposed groups, except for median nerve sensory amplitude at the wrist in the right hand (Table 5). The exposed group had higher amplitude than the unexposed group (12.6 [SD7.5] μV versus 8.1 [SD 6.5] μV), but in the multivariate analysis only age was associated with the amplitude. Neither cumulative lifetime exposure nor current daily exposure contributed to explaining the amplitude in the multiple linear regression models.
Power statistics
With 80% power we would have been able to detect a difference of 0.38 ms in median nerve distal motor latency in the right hand between unexposed and exposed subjects (Figure 2). Corresponding figures for sensory latency digit III to palm were 0.13 ms and palm to wrist were 0.26 ms (Figure 3). The figures were simi-lar for the left hand, except for the palm to wrist seg-ment where the detectable difference was 0.14 ms.
Discussion
The strength of this study lies in our careful assessment of subjects’exposure and the consequent reduction of recall bias. In order to minimize the sources of error hand-arm vibration dose was calculated as the product of self-reported occupational exposure, collected by questionnaire and interviews, and the measured or
Table 6 Neuropathy of the median nerve at the carpal tunnel segmenta
Right hand Left hand
Cumulative life-time
exposureb Nerve conduction n(%) Nerve conduction + symptoms c
n (%)
Nerve conduction n (%)
Nerve conduction + symptomsc n (%)
Class 0 6(23) 3 (12) 2(8) 1(4)
Class 1 2(11) 1(5) 1(6) 1(6)
Class 2 4(19) 0 3(16) 1(5)
Class 3 3(18) 1(6) 3(17) 2(11)
Class 4 6(31) 3(16) 3(17) 2(11)
Current daily exposureb
Class 0 6(23) 3(12) 2(8) 1(4)
Class 1 7(16) 2(5) 4(10) 3(7)
Class 2 2(13) 1(7) 2(14) 1(7)
Class 3 6(33) 2(11) 4(23) 2(12)
a
Sensory latency from palm to wrist greater than 1.73 ms at a distance of 60 mm
b
Results are given as numbers and percentage of measured hands in parentheses.
c
estimated hand-arm vibration exposure in 1987, 1992, 1997, 2002, and 2008. To our knowledge there has been no other study with similar exposure assessment over a period of 21 years. In a recent report, Burström et al concluded that regular surveillance of the exposure and health have significantly reduced the exposure to vibra-tion in this study populavibra-tion [12].
In our electrophysiological study of hand-arm vibra-tion exposed and unexposed subjects, there were no dif-ferences between the groups in either the sensory conduction latencies of the median nerve nor in the motor conduction latencies of the median and ulnar nerves. Specifically, exposure to hand-arm vibration was not associated with a decrease of peripheral nerve con-duction and we saw no signs of increased slowing in large myelinated fibers. However, one must bear in mind that only the fastest of the large myelinated fibers, and thus a limited portion of the whole nerve fiber population, are examined in nerve conduction studies. Another possibility for the non-positive result in the
present study could be that the exposed population is mixed with currently and formerly exposed manual workers and if there exists a recovery factor the mixed population would contribute to diluting the difference between the exposed and the unexposed groups. How-ever, there was no difference in nerve conduction between currently exposed and formerly exposed sub-jects and the attempt to adjust for a recovery time factor in the regression model by using “years since last vibra-tion exposure to date of test”as a predictor did not con-tribute to explaining the results of the nerve conduction measurements. Subjects in the unexposed group and formerly exposed group were older than those in the currently exposed group. There was no one older than 64 years in the currently exposed group and 13 (33%) older than 64 years in the unexposed group. We con-trolled for age in the multiple linear regression models, and it did not alter the fact that vibration exposure was not a predictor of nerve conduction variables in the equation. We also conducted a regression analysis after excluding all subjects with age over 64 years and still the exposure variables did not contribute to explaining the nerve conduction measurements.
The exposed group had higher amplitude than the unexposed in the sensory conduction measurements at the wrist, but in the linear regression model the vibra-tion exposure did not contribute to the model and the difference is probably due to other factors.
When comparing each individual’s right and left hand; the right hand had longer distal latency in the motor conduction of the median and ulnar nerves and also slightly longer latency in the sensory conduction of the median nerve over the carpal segment. However, although not significant, the latency difference over the carpal segment was larger in the unexposed subjects. The right hand is generally more exposed to hand-arm vibration in this cohort [18]. The majority is right-handed and the ergonomic load in the workplace and at home is probably higher on this side [19]. Nathan et al. [20] reported slowing in the dominant hand in a pro-spective study of median nerve sensory conduction in industrial workers, but could not reveal any correlation with occupational hand use.
Seven subjects (9%) and 11 (7%) hands of those who underwent sensory nerve conduction measurements in the exposed group had both pathological sensory nerve conduction at the wrist and symptoms suggestive of car-pal tunnel syndrome (CTS); the corresponding numbers in the unexposed group were 3 (12%) and 4 (8%). There was no significant difference between groups. We excluded subjects who had had surgery for carpal tunnel syndrome. If those subjects were included in the calcula-tion, there would still be no difference between exposed and unexposed subjects. The overall prevalence of CTS
Figure 2Power curve, median nerve, distal motor latency, right hand.
in the present study is higher than that reported among men in an epidemiological study of the general popula-tion in Sweden (2.1%) [21]. A review of occupapopula-tional populations showed a wide range in the prevalence of CTS (0.6%-61%) [22]. In the present study there was also a high proportion of pathological nerve conduction velocities in the palm-wrist segment in subjects without symptoms. Among those subjects, there were still no differences between exposed and unexposed. This has also been reported in other studies [21,23,24]. Atroshi et al. [21] found abnormal nerve conduction without symptoms to be more common among older subjects. The mean age of the subjects with abnormal nerve con-duction in the present cohort was 56 years (range 39-71) and the mean age of the study group was 55 (37-75) years.
Temperature is an important source of error in nerve conduction studies. This was obvious in the study of Cherniack et al.[8], who reported that the significant dif-ferences in digital sensory conduction velocities between vibration-exposed and non-exposed workers, which had been observed after segmental cutaneous warming, were eliminated after systemic warming with a bicycle erg-ometer test. Moreover, the strong association between increased skin temperature and faster sensory conduc-tion velocities, which had been observed after segmental cutaneous warming, was largely eliminated for both digi-tal and palmar anatomic segments after systemic warm-ing. We had hoped to increase the temperature before the nerve conduction measurements by using the bicycle ergometer test, which had previously proved to be an effective method to increase the skin temperature of the fingers [16], but our effort to raise the skin temperature in fingertips failed in some cases. However, the skin temperature was only measured at the fingertip of digit IV and it is possible that the skin temperature was higher at the wrist. Hence, we had a number of subjects with skin temperatures at the fingertip below 32°C. On the other hand, there were no differences in mean skin temperature between the exposed and unexposed or between classes with cumulative life-time exposure or current daily exposure. We chose to control for tem-perature in the multiple linear regression model, and it did not alter the fact that vibration exposure was not a predictor of nerve conduction variables in the equation. We also conducted an analysis after excluding all sub-jects with finger temperature under 32°C and there were still no differences in skin temperature or nerve conduc-tion between classes of vibraconduc-tion exposure.
At baseline in 1987 the present cohort was investi-gated with nerve conduction measurements in a cross-sectional study; Nilsson et al.[25] reported impaired nerve conduction in the exposed group. The risk was not proportional to the vibration exposure. They
concluded that the contributions from vibration and ergonomic factors to the impaired nerve conduction were inseparable. We do not know why the difference between unexposed and exposed is not detectable 21 years later. Possible reasons could be recovery due to retirement, job transfer, or due to fewer or less vibrating tools and/or decreased daily exposure time; another rea-son, that different methods were used in the two studies for measuring nerve conduction velocity e.g. in the pre-sent study we used a systemic warming method to elim-inate the temperature as a source of error. A third, possibility is that those who had impaired nerve conduc-tion in 1987 are among those we have not been able to follow-up, and finally, a fourth reason could be lack of power to detect a small difference in nerve conduction.
Our results, with no differences in nerve conduction velocity between hand-arm vibration exposed and unex-posed subjects differ from the results of several other epidemiological studies. Most of the studies that demon-strate an association between vibration exposure and nerve conduction impairment come from case-control studies where the vibration-exposed workers have been selected either from a population of patients, subjects with suspected hand-arm vibration syndrome disorders [2,4,26], or from job categories entailing a well-recog-nized exposure to vibration [27-29].
In our present study, the majority of the sample does not have severe neurological symptoms and most sub-jects have not been referred to a clinic. Based on the present results we propose that nerve conduction velo-city may not be a sufficiently sensitive method for detecting small hand-arm vibration-related pathological changes in peripheral nerves.
Limitations of the study
Although there appears to be little difference between the 197 invited subjects and the final study group, the reduction in our sample size weakens the statistical power of our analyses, i.e. the ability to reject the null hypothesis of no differences. Thus we would caution that a relationship between hand-arm vibration exposure and peripheral neuropathy may exist but has not been detected in this study.
Epidemiological studies have indicated an association of carpal tunnel syndrome and ergonomic factors such as high requirements for hand force, prolonged work with extended wrist, high repetitiveness, and their com-bination. In this study we did not control for these factors.
Conclusions
Nerve conduction measurements of peripheral hand nerves revealed no exposure-response association between hand-arm vibration exposure and distal neuro-pathy of the large myelinated fibers in a cohort of male office and manual workers.
Abbreviations
HAVS: Hand-arm vibration syndrome; T.N: Tohr Nilsson; EMG: electromyography; SCV: sensory conduction velocity; CTS: carpal tunnel syndrome.
Acknowledgements
This research was supported by Swedish Council for Working Life and Social Research and The Göteborg Medical Society.
Author details 1
Occupational and Environmental Medicine, Sahlgrenska School of Public Health and Community Medicine, University of Gothenburg, Sweden.
2
Institute of Neuroscience and Physiology, Sahlgrenska Academy, University of Gothenburg, Sweden.3Occupational and Environmental Medicine,
Department of Public Health & Clinical Medicine, Umeå University, Sweden.
4Sundsvall Hospital, Department of Occupational and Environmental
Medicine, Sundsvall Hospital, Sweden.
Authors’contributions
HS wrote the manuscript, contributed to the design of outcome measurements, performed the statistical analysis and the interpretation of data. AJ discussed and contributed to the manuscript, participated and contributed substantially to the analysis and interpretation of data. BGW discussed and contributed to the manuscript, contributed to the design of outcome measurements and participated and contributed substantially to the interpretation of data. LB discussed and contributed to the manuscript, designed the study, was principal investigator and data collector of the exposure measurements, participated and contributed substantially to the analysis and interpretation of data. RL discussed and contributed to the manuscript, designed the study, participated and contributed substantially to the analysis and interpretation of data. TN discussed and contributed to the manuscript, designed the study, was the examining physician at the baseline and the follow ups, participated and contributed substantially to the analysis and interpretation of data. MH initiated and designed the study, discussed and contributed to the manuscript. All authors have read and approved the final manuscript.
Competing interests
The authors declare that they have no competing interests.
Received: 13 April 2010 Accepted: 19 July 2010 Published: 19 July 2010
References
1. Brammer AJ, Pyykkö I:Vibration-induced neuropathy. Detection by nerve conduction measurements.Scand J Work Environ Health1987,
13(4):317-322.
2. Rosén I, Strömberg T, Lundborg G:Neurophysiological investigation of hands damaged by vibration: comparison with idiopathic carpal tunnel syndrome.Scand J Plast Reconstr Surg Hand Surg1993,27(3):209-216. 3. Hirata M, Sakakibara H:Sensory nerve conduction velocities of median,
ulnar and radial nerves in patients with vibration syndrome.Int Arch Occup Environ Health2007,80(4):273-280.
4. Sakakibara H, Hirata M, Hashiguchi T, Toibana N, Koshiyama H, Zhu SK, Kondo T, Miyao M, Yamada S:Digital sensory nerve conduction velocity and vibration perception threshold in peripheral neurological test for hand-arm vibration syndrome.Am J Ind Med1996,30(2):219-224. 5. Takeuchi T, Futatsuka M, Imanishi H, Yamada S:Pathological changes
observed in the finger biopsy of patients with vibration-induced white finger.Scand J Work Environ Health1986,12(4 Spec No):280-283. 6. Lander L, Lou W, House R:Nerve conduction studies and current
perception thresholds in workers assessed for hand-arm vibration syndrome.Occup Med (Lond)2007,57(4):284-289.
7. Nathan PA, Istvan JA, Meadows KD:A longitudinal study of predictors of research-defined carpal tunnel syndrome in industrial workers: findings at 17 years.J Hand Surg Br2005,30(6):593-598.
8. Cherniack M, Brammer AJ, Lundström R, Morse TF, Neely G, Nilsson T, Peterson D, Toppila E, Warren N, Diva U,et al:The effect of different warming methods on sensory nerve conduction velocity in shipyard workers occupationally exposed to hand-arm vibration.Int Arch Occup Environ Health2008,81(8):1045-1058.
9. Burström L, Pettersson H, Nilsson T, Wahlström J, Liljelind I, Lundström R, Hagberg M:A 21-year follow-up of the vibration load among workers in a heavy engineering production workshop.Proceeding of the 2nd International Conference on Human Vibration Exposure, measurements and tests, Centek, LuleåDalheim S 2009, 115-118.
10. ISO:5349-1. Mechanical vibration - Measurement and evaluation of human exposure to hand-transmitted vibration - Part 1: General guidelines.International Organization for Standardization. Geneva 2001. 11. ISO:5349-2. Mechanical vibration - Measurement and evaluation of
human exposure to hand-transmitted vibration - part 2: Practical guidance for measurement at the workplace.International Organization for Standardization. Geneva 2001.
12. Burström L, Pettersson H, Nilsson T, Wahlström J, liljelind I, lundström R, Hagberg M:A follow-up study of welders’exposure to vibration in a heavy engineering production workshop.Journal of Low Frequency Noise, Vibration and Active Control2010.
13. Council E:Directive 2002/44/EC of the European parliament and of the Council of 25 June 2002 on the minimum health and safety
requirements regarding the exposure of workers to the risks rising from physical agents (vibration) (sixteenth individual Directive within the meaning of Article 16(1) of Directive 89/391/EEC).Off J Europe Communities; L1772002, 13-19.
14. Ashworth NL, Marshall SC, Satkunam LE:The effect of temperature on nerve conduction parameters in carpal tunnel syndrome.Muscle Nerve
1998,21(8):1089-1091.
15. Halar EM, DeLisa JA, Soine TL:Nerve conduction studies in upper extremities: skin temperature corrections.Arch Phys Med Rehabil1983, 64(9):412-416.
16. Sanden H, Edblom M, Hagberg M, Wallin BG:Bicycle ergometer test to obtain adequate skin temperature when measuring nerve conduction velocity.Clin Neurophysiol2005,116(1):25-27.
17. Stokes ME, Davis SCharles, Koch GGary:Categorical Data Analysis Using the SAS® System.Cary, NC: SAS Institute Inc, second 2000.
18. Nilsson T, Burström L, Hagberg M:Risk assessment of vibration exposure and white fingers among platers.Int Arch Occup Environ Health1989, 61(7):473-481.
19. Hansson G-Å, Balogh I, Ohlsson K, Granqvist L, Nordander C, Arvidsson I, Åkesson I, Unge J, Rittner R, Strömberg U,et al:Physical workload in various types of work: Part I. Wrist and forearm.International Journal of Industrial Ergonomics2009,39(1):221-233.
20. Nathan PA, Keniston RC, Myers LD, Meadows KD:Longitudinal study of median nerve sensory conduction in industry: relationship to age, gender, hand dominance, occupational hand use, and clinical diagnosis.
J Hand Surg Am1992,17(5):850-857.
21. Atroshi I, Gummesson C, Johnsson R, Ornstein E, Ranstam J, Rosén I: Prevalence of carpal tunnel syndrome in a general population.JAMA
1999,282(2):153-158.
22. Hagberg M, Morgenstern H, Kelsh M:Impact of occupations and job tasks on the prevalence of carpal tunnel syndrome.Scand J Work Environ Health1992,18(6):337-345.
24. Werner RA, Franzblau A, Albers JW, Armstrong TJ:Median
mononeuropathy among active workers: are there differences between symptomatic and asymptomatic workers?Am J Ind Med1998, 33(4):374-378.
25. Nilsson T, Hagberg M, Burström L, Kihlberg S:Impaired nerve conduction in the carpal tunnel of platers and truck assemblers exposed to hand-arm vibration.Scand J Work Environ Health1994,20(3):189-199. 26. Alaranta H, Seppalainen AM:Neuropathy and the automatic analysis of
electromyographic signals from vibration exposed workers.Scand J Work Environ Health1977,3(3):128-134.
27. Araki S, Yokoyama K, Murata K:Assessment of the effects of occupational and environmental factors on all faster and slower large myelinated nerve fibers: a study of the distribution of nerve conduction velocities.
Environ Res1993,62(2):325-332.
28. Chatterjee DS, Barwick DD, Petrie A:Exploratory electromyography in the study of vibration-induced white finger in rock drillers.Br J Ind Med1982, 39(1):89-97.
29. Ho ST, Yu HS:A study of neurophysiological measurements and various function tests on workers occupationally exposed to vibration.Int Arch Occup Environ Health1986,58(4):259-268.
doi:10.1186/1745-6673-5-21
Cite this article as:Sandénet al.:Nerve conduction in relation to vibration exposure - a non-positive cohort study.Journal of Occupational Medicine and Toxicology20105:21.
Submit your next manuscript to BioMed Central and take full advantage of:
• Convenient online submission
• Thorough peer review
• No space constraints or color figure charges
• Immediate publication on acceptance
• Inclusion in PubMed, CAS, Scopus and Google Scholar
• Research which is freely available for redistribution