Site-Specific Nutrient Management for Lowland Rice
in the Northern Savannah Zones of Ghana
W. DOGBE
1, J. M. SOGBEDJI
2* and S. S. J. BUAH
11CSIR- Savannah Agricultural Research Institute (CSIR-SARI), P. O. Box 52, Tamale, Ghana.
2Université de Lomé, Ecole Supérieure d’Agronomie. 01 BP 1515, Lomé, Togo.
http://dx.doi.org/10.12944/CARJ.3.2.04
(Received: November 21, 2014; Accepted: December 04, 2015)
ABSTRACT
A multi-location study was conducted to assess the nitrogen (N), phosphorous (P) and potassium (K) requirements of lowland rice (Oryza sativa L.) for a local variety Digang cultivated in the northern Savannahs of Ghana and offer site specific nutrient recommendations. Ten on-farm nutrient omission trials involving five rates of N, P and K combinations were conducted during 2010 cropping season in Sudan and Guinea Savannah agro-ecological zones. The treatments (kg/ha as N, P2O5 and K2O) comprised 0-0-0 (control), 0-90-90 (zero N), 90-0-90 (zero P), 90-90-0 (zero K),
90-90-90 (NPK). Grain yields were increased by applying fertilizer N, P and K in sufficient amounts (90 N, 90 P2O5 and 90 K2O kg/ha) to overcome deficiencies and maintain soil fertility. Nitrogen was a
major limiting nutrient in the irrigated and rain fed lowlands in the northern Savannahs of Ghana. The N-limited yields varied between 832 and 1875 kg/ha, suggesting variability of N supplying capacity of the experimental plots. The impact of omitting N was different among the locations with the irrigated lowlands ecosystems in the Sudan Savannah that recorded the highest yield loss due to N omission and Guinea Savannah the least. Higher level of fertilizer N (118 kg/ha) was required in the irrigated lowland in the Sudan Savannah to achieve maximum yield compared with 52 to 79 kg N/ha in the rain fed lowlands of Guinea Savannah. Potash fertilizers have little effect on yield, especially in irrigated lowlands in the Sudan Savannah. Grain yield reductions due to nutrient deficiencies were more severe in the Upper West region than in Upper East region and Northern region. Higher levels of N in irrigated lowland ecosystems in the Sudan Savannah and higher P and K may be required in Upper West region in the Guinea Savannah than recommended for achieving higher yields on a sustainable basis.
Key words: Rice, Guinea Savannah, Nutrient omission trials, Site specific fertilization, Yield gap.
INTRODUCTION
Rice is both an important cash and food security crop in sub-Saharan Africa (SSA). In Ghana, Sudan and Guinea Savannahs account for about 60% of the national rice production. However, average grain yield of rice on farmers’ fields is low (2.5 t/ha) compared with the achievable yield of 5-6 t/ha, due to low soil fertility, and sub-optimal application of fertilizers (Rhodes, 1995; MoFA, 2010). Increasing pressure on land due to increasing population and competing uses of land have shortened fallow periods leading to continuous cropping and consequently undesirable effects on soil structure and mineral status (Oikeh et al.,
2009; Nziguheba et al., 2009). Due to continuous cropping and low plant-available soil nitrogen (N) and phosphorus (P), external nutrient additions in the form of fertilizers have become inevitable to achieve higher yields.
crop variety, climate, crop and soil management. The rice cultivators presume that the nutrient needs of the crop are constant for years and over large areas, and fixed rates and timings of N, P, and K are thus recommended for vast areas of production. Additionally, fertilizer recommendations in West Africa are mostly based on a limited number of trials and sites at research stations (IFDC, 2013). Hence, the rice quality depends on the recommendations and management practices advised by the representativeness of these sites. However, cropping histories at research stations are often very different from farmers’ fields. Currently, the blanket fertilizer recommendation of 60-60-30 kg/ha as N, P2O5 and K2O for lowland rice in Ghana is more than two decades old and this has probably become inadequate, considering the level of decline in soil fertility within the region.
Generally, the cultivation of lowland rice under rain fed conditions in the Savannahs of West Africa is expanding as a result of the introduction of improved and locally adapted lowland rice varieties by the National Agricultural Research Systems (Dogbe et al., 2012). Given the importance of fertilizers for rice production, there is a need to determine the appropriate fertilizer requirements for lowland rice in the Sudan and Guinea Savannah agro-ecological systems of Ghana. Several studies have shown that application of fertilizer, especially N to rice increased tiller number, plant height, panicle number, leaf size, spikelet number, and grain yield (Gravois and Helms, 1992; Oikeh et al., 2009). However, there is little or no information on the fertilizer N, P and K requirements of lowland rice varieties in the Northern Savannahs of Ghana.
Thus the objectives of this study were (i) to identify which nutrient causes yield reduction of a
popular lowland rice variety, Digang and (ii) to assess spatial variation in indigenous N, P, and K supply and fertilizer response using the nutrient-omission plot technique in on-farm trials. The aim was to develop reliable updated nutrient management options for rice in the Sudan and Guinea Savannah agro-ecological systems of Ghana.
MATERIELS AND METHODS Study Area
Field studies were conducted during 2010 in the northern Savannah agro-ecological system of Ghana, comprising Northern Region (NR), Upper East Region (UER) and Upper West Region (UWR). The UWR and NR are both located in the northern Guinea Savannah zone but with different soil conditions, while UER is located in the Sudan Savannah zone. The Guinea and Sudan Savannahs often experience hot, distinct dry and wet conditions.
Soils in the northern Savannah zone are highly weathered and moderately to strongly acidic in the surface soil. Organic matter content is as low as <15 g kg-1 superscript soil.. The dominant soil
type in the northern Savannah zone is Savannah Ochrosol with underground laterite (poorly drained soils) (FAO 1998). NR and UER have a contrasting geology.UER is underlained by granites interspersed with some pyroclastic rock while NR is essentially Voltaian sandstones, giving easily worked light soils but prone to concretions and hardpan. The soil in NR was Plinthic Luvisols according to FAO (1998), while soil in UER are Plinthic Lixisol and developed from granite and are less prone to erosion than the sandy soils of NR and UWR. The granites have both a greater concentration of nutrients and better retention of precipitation. Valley bottoms concentrate
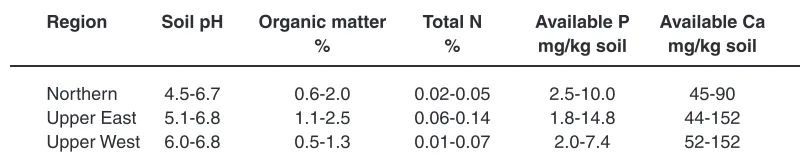
Table 1: Average soil fertility status of northern region (NR), upper west region (UWR), and upper east region (UER), Ghana
Region Soil pH Organic matter Total N Available P Available Ca
% % mg/kg soil mg/kg soil
Northern 4.5-6.7 0.6-2.0 0.02-0.05 2.5-10.0 45-90
Upper East 5.1-6.8 1.1-2.5 0.06-0.14 1.8-14.8 44-152
Upper West 6.0-6.8 0.5-1.3 0.01-0.07 2.0-7.4 52-152
hydromorphic soils and cultivation of both rice and horticultural crops is possible. The soil types that dominate in UWR are Ferric Lixisols. They are generally poor in organic matter and nutrients as a result of the absence of high vegetative cover, due to bush burning, overgrazing, over-cultivation and protracted erosion, and are heavily leached. The average fertility status of representative soils of the different regions is presented in Table 1. Available phosphorus (P) was determined by the method of Bray and Kurz, 1945. The levels of organic carbon, total nitrogen and available phosphorus are generally very low. They soils generally have low organic carbon and total N contents because of low biomass production and a high rate of decomposition.
Field Trials
Farmers who participated in the on-farm trials were selected in agreement with community members. Selection criteria included access to land, willingness to use a portion of the farm for pure stand rice production, location of farm and willingness to share experience with other farmers. Irrigated rice production is relatively more common in UER than in NR and UWR.
During2010 cropping season (June-October), ten nutrient-omission trials were conducted in each of the three regions (NR, UWR and UER) within the northern Savannahs of Ghana. Nutrient omission trials, often described as ‘questioning’ the soil in the participatory diagnosis of soil fertility, have become an important approach to analysing soil fertility in developing countries, partly because
of the simplicity of its application (Nziguheba et al., 2009; Ezui et al., 2010). The nutrient omission plot technique is a tool for determining crop requirements for fertilizers. In this study, a farmer at each location represented a replicate leading to a total number of thirty replications (ten farmers in each of the three regions involved) for the study. The experiments were planted in irrigated lowlands in UER (Sudan Savannah zone) and rain fed lowlands in NR and UWR (Guinea Savannah zone). The farms were located at Gbulung and Tamale in NR, Kaleo, Nadowli, Kahaa and Sekpere in UWR, as well as Bongo, Bulsa and Garu in UER but managed by researchers. Land was ploughed and harrowed before direct seeding. Digang, with a growth period of 110-115 days, was used. The name in the local Dagbanli language indicates that it is adapted to several ecologies - upland, hydromorphic lowland (midland) ecology and drought-prone lowlands. The rice was planted between 30th June and 15th July
2010, with four seeds per hill at a spacing of 20 cm by 20 cm and thinned manually at 15 days after planting (DAP) to two per stand to obtain a target plant population of 500,000 plants/ha.
In each farm, five parallel plots of 10 m x 10 m were marked out and the following treatments were randomly allocated to them:
1. Full complement of NPK 90-90-90 kg/ha as N, P2O5 and K2O, respectively;
2. Zero N (0-90-90 kg/ha as N, P2O5 and K2O, respectively;
3. Zero P (90-0-90 kg/ha as N, P2O5 and K2O; 4. Zero K(90-90-0 kg/ha as N, P2O5 and K2O,
respectively); and
5. Control (No fertilizer application, representing the farmer’s normal practice).
Nitrogen was applied as urea (46% N) in two equal splits– basal application at 14 days after planting (DAP) and side dressing at about panicle initiation (45-50 DAP). P was applied as triple superphosphate (46% P2O5) and K as muriate of potash (60% K2O) at 14 DAP. All the P and K and the first split of N were dibbled at approximately 10 cm from the plants at a depth of about 5 cm. A hill of dibbled fertilizer served 4 hills of rice i.e. an area of 0.16 m2. With advice by the extension agents,
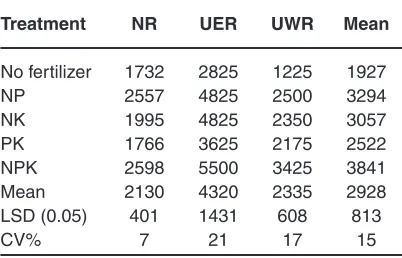
farmers carried out all field operations, including Table 2: Mean paddy yield (kg/ha) in on-farm
trials at northern region (NR), upper west region (UWR), and upper east region (UER),
Ghana 2010
Treatment NR UER UWR Mean
No fertilizer 1732 2825 1225 1927
NP 2557 4825 2500 3294
NK 1995 4825 2350 3057
PK 1766 3625 2175 2522
NPK 2598 5500 3425 3841
Mean 2130 4320 2335 2928
LSD (0.05) 401 1431 608 813
two hoe weedings at 3 and 6 Weeks after planting. A 1m2 quadrat was placed on each plot (leaving out
the border rows and border plants). At physiological maturity, plants in the quadrats were harvested to determine grain yield. Grain yields were adjusted to 140 g/ka (14%) moisture content.
Site-specific Fertilizer Calculations
The requirements of N, P and K fertilizers were approximated based on the yield gap, the internal efficiency (IE) of nutrients and the recovery fraction of N, P and K. The yield gap was calculated as the difference of the target yield (NPK treatment) and the yield of the omission plot (zero N, zero P or zero K plot). The internal efficiency of nutrient (IE), which is defined as the yield to total uptake ratio (Janssen et al., 1990) approximates the quantity of grain produced by the crop per unit (kg) of nutrient taken up. In this paper, we adopted IE of 53 kg grain produced for any kg of N taken up (IEN), 34.8 kg grain produced/ kg K taken up (IEK) and 294 kg grain produced/kg P taken up (IEP),). These IE values were derived from Sahrawat (2000). Fertilizer recovery fraction (RF) is the proportion of the applied fertilizer nutrient that is taken up by the crop (Vlek and Byrnes, 1986). We adopted the average recovery fraction of N (RFN) of 30% for this paper. The recovery fractions of P (RFP: 15%) and K (RFK: 30%) were derived from RFN using NPK recovery fraction ratio of 2:1:2 (Dobermann and Fairhust, 2000, Haefele et al., 2003). In calculating the site-specific nutrient recommendation at each site, grain yield in the plot with full N, P and K fertilization was used as the yield target that is realistically attainable by farmers at each location. Nutrient-limited yields were determined from plots in which the nutrient of interest is not added. For example, the N-limited yield is determined in an N omission plot receiving no N fertilizer but sufficient P and K to ensure that they do not limit yield. The difference in grain yields between a fully fertilized plot and an N omission plot illustrates the deficit between the crop demand for N and indigenous supply of N, which must be met by fertilizers. The nutrient uptake requirement (amount of nutrient uptake required to close the yield gap) was given by the yield gap to internal efficiency ratio. Site-specific fertilizer recommendation was obtained by dividing the nutrient uptake requirement by the fertilizer recovery fraction. Thus:
• The uptake requirement for nutrient X (kg/ha) = Yield gap (kg/ha) accounted for by nutrient X/Internal efficiency (IE) for nutrient X; • The recommendation for nutrient X (kg/ha) =
uptake requirements for nutrient X/Recovery faction for nutrient X.
Data collected were subjected to an analysis of variance (ANOVA) to establish treatment effects on yield. Statistical analyses were performed with SAS for Windows 9.1 (SAS Institute Inc., Cary, NC). Fixed effect was fertilizer treatment, while location and replications were treated as random effects. ANOVA showed significant differences of variables between treatments, means were separated using the Least Significant Difference (LSD) procedure at 5% level of probability.
RESULTS Rice Paddy Yield
Yield gaps between the control and full complement of N, P and K were 866, 2200 and 2675 kg/ha, respectively in NR, UWR and UER (Table 2), representing yield reductions of 33, 64 and 49%, respectively. In all locations, the N-limited treatment reduced grain yields the most. In NR, limiting K, P and N, respectively reduced yields by 41 kg/ha (2%), 603 kg/ha (23%) and 832 kg/ha (32%) compared with the treatment with fertilizer N, P and K (2598 kg/ha). The yield gap when K or P was omitted was 12% or 675 kg/ha in UER. This was lower than the yield reduction of 1875 kg/ha or 34% with N-limited treatment. In UWR, limiting K, P or N, respectively resulted in yield reductions of 925 kg/ha (27%), 1075 kg/ha (31%) and 1250 kg/ha (37%) compared with the treatment with N, P and K (3425 kg/ha).
Nutrient Uptake and Fertilizer Requirements Phosphorus and K uptakes were highest in
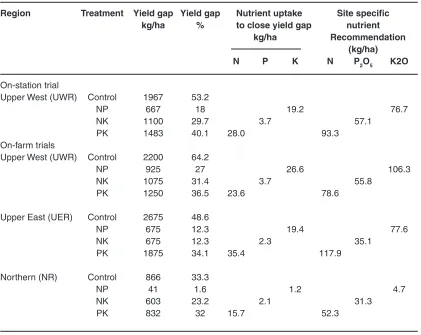
UWR and lowest in NR (Table 3). However, N uptake was highest in UER followed by UWR and NR in that order. The yield of N0treatment (PK treatment) was 2175 kg/ha in UWR. To obtain the target yield of 3425 in UWR, a farmer will have to apply about 79 kg N/ha (Table 3). For a yield target of 2598 kg/ ha in NR and 5500 kg/ha in UER, the farmer has to apply 52 and 118 kg N/ha, respectively. The yield in P0 treatment (only N and K) was 1995 kg/ha in NR and 4825 kg/ha in UER. This means that the farmer will have to apply 31 and 35 kg P2O5/ha in order to obtain the maximum yield targets of 2598 and 5500 kg/ha in the respective regions (Table 3). In UWR, the farmer will need to apply about 57 kg P2O5/ha to achieve the yield obtained with the application of the full N, P and K fertilizer treatment. In addition, a farmer must apply 77-106 kg K2O/ha in UWR, 78 kg K2O/ha in UER and as little as 5 kg K2O/ha in NR to obtain yields comparable with the full N, P and K fertilizer treatment.
Table 3: Average yield gap, nutrient uptake requirements and recommendations for lowland rice in NR, UWR and UER, 2010
Region Treatment Yield gap Yield gap Nutrient uptake Site specific kg/ha % to close yield gap nutrient
kg/ha Recommendation
(kg/ha)
N P K N P2O5 K2O
On-station trial
Upper West (UWR) Control 1967 53.2
NP 667 18 19.2 76.7
NK 1100 29.7 3.7 57.1
PK 1483 40.1 28.0 93.3
On-farm trials
Upper West (UWR) Control 2200 64.2
NP 925 27 26.6 106.3
NK 1075 31.4 3.7 55.8
PK 1250 36.5 23.6 78.6
Upper East (UER) Control 2675 48.6
NP 675 12.3 19.4 77.6
NK 675 12.3 2.3 35.1
PK 1875 34.1 35.4 117.9
Northern (NR) Control 866 33.3
NP 41 1.6 1.2 4.7
NK 603 23.2 2.1 31.3
DISCUSSION
In this study, the test of the main effect of locations as well as the fertilizer treatment by region interactions was significant (P<0.05) for grain yield indicating that the magnitude of yield responses were different among the three regions. A single recommendation may not be appropriate for all regions and field-specific recommendation is therefore needed. The results suggest that the highest yields were obtained in the irrigated lowlands of UER, Good crop management and assured availability of irrigation water probably helped to achieve larger number of grains per panicle and subsequently higher grain yields in UER compared to NR and UWR. Farmers in UER generally use water management practices such as bunding and this could have increased soil water availability, N use efficiency and ultimate grain yield.
At all locations, the highest yields were obtained where fertilizer N, P and K were applied in sufficient amounts to overcome deficiencies and maintain soil fertility. In UER, the yield value for NP and NK treatments (4825 kg/ha for both treatments) was comparable to yields obtained from full dose of N, P and K treatment (5500 kg/ ha). However, omitting both P and K had little effect on rice yield in this region and the yield of the PK treatment (3625 kg/ha) was comparable to that of no fertilizer treatment (2825 kg/ha), reflecting the overall importance of N for the growth of rice in irrigated lowlands in the UER. Additionally, the lack of significant yield difference between the no fertilizer treatment and the PK treatment indicated that without sufficient N application, P and K rarely limit yield of rice in the irrigated lowlands in the UER. The soils in the irrigated lowlands in UER may have good capacity to supply sufficient K. Moreover, it has been reported that soils in the northern Savannah of Ghana generally have lower organic matter and available P, although they are higher in exchangeable K (Rhodes, 1995). According to Yawson et al. (2011) Northern Savannah soils generally have a higher capacity to maintain or supply K for a longer period of time from the exchangeable pool. Moreover the dust brought in by the Harmattan winds, occurring annually in West Africa, may play a significant role in replenishing K (Tiessen et al., 1991; Mikkelsen and Langohr, 1998). Studies have shown that such
deposition supplies about 18.7 kg K/ha annually (Harris 1998).
trials at UWR showed very high variance reflected in the higher coefficient of variations (CV) when compared to the on-station trial.
In this study, rice responded to P at all locations, provided N was applied in sufficient quantities. Under intensive rice cropping systems, the demand for P and K increases over time. Moreover, without P and K application, N efficiency is reduced, whereas when all nutrients are applied together, P and K efficiency increases steadily, indicating interactions among these nutrients (De Datta, 1994). The positive N and P interactions were reflected in the increased yields in this study. In order to improve fertilizer use efficiency in both irrigated and rainfed lowlands, a balanced fertilization is necessary. Moreover, the effective management of N requires sufficient application of P and K and micronutrients to overcome limitations by other nutrients.
No research has been conducted on site specific nutrient requirements for lowland rice in the northern Savannahs of Ghana. As such, the blanket fertilizer recommendation of 60:60:30 kg/ha as N, P2O5 and K2O was being advocated by extension workers to all rice farmers. This recommendation was more than two decades old and not specific to any agro-ecology. Obviously, the fertilizer requirements are quite variable and at each location, the requirements are different from the recommended rate, currently advocated by extension staff for the production of rice in the zone. High cost of fertilizers is a major financial constraint for the farmers that opt not to use the needed fertilizers for rice production. Thus, the farmer’s practice of continuous cropping of rice without soil amendment could deplete soil organic matter as well as exchangeable K in the soil, Rice straw in this environment may be used for other domestic purposes. The area where crop residues are not used, farmers permit free grazing of the straw after harvest and then burn the residue before preparing land for cultivation. Removing all rice straw
could significantly reduce cropland productivity and degrade the soil environment. Also if the straw is not returned to the field, important quantities of K are lost to the system as rice straw is rich in K.
The decision on the appropriate fertilizer, especially N rates, should be based on economic considerations given the high cost of fertilizers in Ghana. In general, financial resources of farmers as well as credit facilities in the northern Savannah of Ghana are limited. Additionally, because urea, for example, is offered on the market at a comparatively attractive price per unit of N, the farmer may be tempted to supply his rice crop exclusively with N, which is the most growth limiting nutrient in the Savannah soils. Such a preference may be justified on soils rich in plant-available P and K and all other necessary plant nutrients but not on these Savannah soils which are inherently low in organic matter and plant-available nutrients. Nonetheless, higher grain yields through the application of N alone will also take up greater amounts of P and K from the soil.
CONCLUSION
Results of this study showed that N and P application significantly increased grain yield of rice. At all locations, the highest yields were obtained when balanced N, P and K fertilization was used to overcome deficiencies and maintain soil fertility. Nitrogen and to a lesser extent P is a major limiting nutrient in the irrigated and rainfed lowlands in the Sudan and Guinea Savannahs of Ghana. For high rice yield levels, it is necessary to adjust fertilizer rates on a more site-specific basis. Higher levels of N in the irrigated lowland in UER and higher P and K may be required in UWR than recommended. Potash fertilizers have little effect especially in the irrigated lowlands in UER. Further research with varying application rates of fertilizer N, P and K and other micronutrients will be necessary over a number of years to determine the most economic site-specific nutrient management options.
REFERENCES 1. Rhodes E. R., Nutrient depletion by food
crops in Ghana and soil organic nitrogen management. Agric. Syst. 48:101–118 (1995).
2. MoFA (Ministry of Food and Agriculture),
Agriculture in Ghana. Facts and figures (2009). The Statistics Research and Information Directorate (SRID) (2010).
of upland NERICA® rice cultivars to nitrogen and plant density. Arch. Agron. Soil Sci. 55:301–314 (2009).
4. Nziguheba G., Tossah B. K., Diels J., Franke A. C., Aihou K., Iwufor E. N. O., Nwoke C.and Merckx R., Assessment of nutrient deficiencies in maize in nutrient omission trials and long-term field experiments in the West African Savannah. Plant and Soil. 314:143-157 (2009).
5. IFDC (International Fertilizer Development Center), Mainstreaming pro-poor fertilizer access and innovative practices in West Africa. IFAD Technical Assistance Grant No. 1174 report. Muscle Shoals, Alabama, U.S.A (2013).
6. Dogbe W., Sogbedji J. M., Mando M., Buah S. S. J., Nutsugah S. K., Kanton R. A. L., Atokple I. D. K., Amankwah A., Wiredu A. N., Karikari,A. S., Djamon K., Osei C., Ajayi O. and Ndiaye K., Partnership for improved access to agro-inputs and technology: Some experiences from the emergency rice initiative project in Ghana. African Journal of Agricultural Research. 7(34):4790-4802 (2012).
7. Gravois K. A., Healms R. S., Path analysis of rice yield and yield components as affected by seeding rate. Agron J. 88:1-4 (1992). 8. FAO, World reference base for soil resources.
World Soil Resources Report 84. Food and Agriculture Organization of the United Nations, Rome, Rome, Italy. 88 pp. ISSN0532-0488 (1998).
9. Bray R. H. and Kurtz L. T., Determination of total and available phosphorus in soils. Soil Sci. 59:39-45 (1945).
10. Ezui K. S., Daudu C. K., Mando A., Kudi M. T., Odunze A. C., Adeosun J. O., Amapu I. Y., Trafa B., Sambo I., Bello I. and Dangbegnon C., (2010). Informed site-specific fertilizer recommendation for upland rice production in northern Guinea Savannahh of Nigeria. In: Innovation and Partnerships to Realize Africa’s Rice Potential. Proceedings of second Africa Rice Congress, Bamako, Mali. 22-26 march (2010).
11. Janssen B. H., Guiking F. C. T., van der Eijk D., Smaling E. M. A., Wolf J., van Reuler H., A system for quantitative evaluation of the
fertility of tropical soils (QUEFTS). Geoderma 46, 299–318 (1990).
12. Sahrawat K. L., Macro- and micronutrients removed by upland and lowland rice cultivars in West Africa, Commun, Soil Sci. Plant Anal. 31:717-723 (2000).
13. Vlek P. L.G., and Bymes B. H., The efficacy and loss of fertilizer N in lowland rice. Martinus Nijhoff / Dr W. Junk Publishers, Dordrecht, The Netherlands, Fert. Res, 9:131-47 (1984).
14. Dobermann A. and Fairhurst T., Rice: Nutrient disorders and nutrient management. Singapore: Potash and Phosphate Institute (PPI) and Potash and Phosphate Institute of Canada (PPIC) and Makati City (Philippines): International Rice Research Institute. 191 p (2000).
15. Haefele S. M., Wopereis M. C. S., Ndiaye M. K., Barro S. E., Ould Isselmou M., Internal nutrient efficiencies, fertilizer recovery rates and indigenous nutrient supply of irrigated lowland rice in Sahelian West Africa. Field Crops Res. 80:19-32 (2003).
16. Yawson D. O., Kwakye P. K., Armahand F. A. and Frimpong K. A., The dynamics of potassium (K) in representative soil series of Ghana. J, of Agric, Biol. Sci. 6:48-55 (2011). 17. Tiessen H., Hauffe H. K., Mermut A. R.,
Deposition of Harmattan dust and its influence on base saturation of soils in northern Ghana. Geoderma, 49: 285-299 (1991).
18. Mikkelsen J. H. and Langohr R., Impact of dust on soil evolution and fertility, case studies from Northern Ghana and the Altai Mountains, SW Siberia. Pp. 223-226 In: Busacca, A. J. (Ed.): Dust Aerosols, Loess Soils and Global Change. Pullman, Washington State University College of Agriculture and Home Economics (1998).
19. Harris F. M. A., Farm-level assessment of nutrient balance in north Nigeria, Agric. Ecosyst. Env. 71:201–214 (1998).
20. Duan Y. H., Zhang Y. L., Ye L. T., Fan X. R., Xu G. H., Shen Q. R., Responses of rice cultivars with different nitrogen use efficiency to partial nitrate nutrition. Annals of Bot. 99: 1153–1160 (2007).