The Effect of Variable Resistance Training on Lower Limb
Strength and Power Development: A Training Study
By
Caleb W. Dobbs
–
PGDipSpExSc, BSpExSc
Supervisors: Dr Carmel Nottle and Mr Daniel Smart
Thesis submitted in partial fulfilment of the requirements of the degree Master of Sports and Exercise Science
School of Sports and Exercise Science Waikato Institute of Technology
TABLE OF CONTENTS
Page Number
Use of thesis ... iii
Note to reader ... iii
Abstract ... iv
Declaration ... vi
Acknowledgements ... vii
List of figures ... ix
List of tables ...x
Operational definitions... xi
Chapter One: Introduction 1.0 Background ...1
1.1 Rationale for investigation ...3
1.2 Aim of research ...4
1.3 Hypotheses ...5
Chapter Two: Literature Review 2.0 Introduction ...6
2.1 Physiology of the working muscle ...8
2.2 Factors affecting the development of muscular power. 2.2.0 Strength ...11
2.2.1 Training Load...12
2.2.2 Training velocity ...17
2.2.3 Rate of force development ...20
2.2.4 Age ...21
2.3 An overview of variable resistance training ...22
2.4Conclusion ...28
Chapter Three: Methodology 3.0Experimental design...29
3.1 Subjects ...30
3.2 Training protocol ...31
3.3 Training loads ...33
ii 3.5 Testing.
3.5.0 Back squat 1RM protocol ...36
3.5.1 Vertical jump protocol ...37
3.5.2 30m sprint speed protocol ...38
3.6 Statistical analysis ...39
3.7 Treatment of Subject Groups ...40
3.7 Regression in loads afforded by variable resistance bands ...41
3.8 Limitations ...42
Chapter Four: Experimental Investigation 4.0 Abstract ...44
4.1 Introduction ...44
4.2 Methods 4.2.0 Experimental design...47
4.2.1 Subjects ...47
4.2.2 Protocol ...48
4.2.3 Statistical analysis ...50
4.3 Results ...50
4.4 Discussion ...53
4.5 Practical application ...58
Chapter Five: Case Study 5.0 Subjects ...59
5.1 Results ...60
5.2 Discussion ...61
5.3 Practical application ...63
Chapter Six: Conclusion 5.4 Restatement of aims and hypotheses ...64
5.4 Summary of results and conclusion ...64
5.4 Future direction within research ...65
References ...67
iii
Use of Thesis
This copy is the property of the Waikato Institute of Technology. However the literary rights of the author must also be respected. If any passage from this thesis is quoted or closely paraphrased in a paper or written work prepared by the user, the source of the passage must be acknowledged in the work. If the user desires to publish a paper or written work containing passages copied or closely paraphrased from this thesis, where passages would in total constitute an infringing copy for the purpose of the Copyright Act, he or she must first obtain written permission of the author to do so.
Note to Reader
iv
Abstract
The ability to develop high levels of muscular strength and power is considered to be a critical component in many, if not most, sports. Because of this, new training methods are constantly being sought in an attempt to improve strength and power development. One such method is variable resistance training (VRT). This research aims to determine the effect of VRT on back squat one repetition (1RM) strength, vertical jump height and 30m sprint time.
Twenty male high school athletes (mean age 17.5 ± 0.7 years) were pair matched based on 1RM scores (predicted from 4RM). Subjects completed a five-week within-group standardised training programme, with the control within-group completing fixed load back squats and the experimental group completing variable resistance back squats (with the use of elastic bands). Pre- and post-training vertical jump height, predicted 1RM squat strength and 10m, 20m and 30m sprint speeds were measured.
The VRT group had greater increases in strength and vertical jump than the fixed load training group, with a moderate difference in pre- to post-training predicted 1RM (mean; ± 90% confidence limit; 7.0; ±6.1%) and a small difference in the within-group changes in vertical jump height (4.6; ± 5.4%) from pre- to post-training. VRT also produced a small difference (4.8; ±5.3%) in pre- to mid-training 1RM changes. All other changes were trivial or unclear.
v not vertical jump height or 30m sprint time. However, no findings in the semi-elite case study were statistically clear due to a lack of statistical power. Further research is required into the effects of this training technique on mature athletes.
This study also aimed to determine the level of regression that occurs in resistance afforded by elastic resistance bands as a result of repeated use. In order to ascertain the reliability of training loads used throughout the study, the resistance of each band was also measured at the mid-point and completion of the training study. This determined the rate of degradation that occurred to variable resistance elastic bands with use. Due to minor changes in the amount of variable resistance afforded by the bands after use, loading protocols were modified at the midpoint of training to reflect these changes.
vi
Declaration
I hereby declare that the information presented in this thesis is the work of the author except where acknowledged in the text. This work has not been submitted either in whole or in part for credit toward any other degree at this or any other institute.
vii
Acknowledgments
I would like to acknowledge the assistance of Daniel Smart and Dr Carmel Nottle in advising me in all aspects of my thesis. To Carmel, thank you for all your hard work in the early part of the year and for continuing to take an interest in my research even after moving back to Australia. To Dan, thank you for so competently moving in to direct and advise me. Thank you for taking the time to get up to speed with my work at such a late stage in the research process. Without the knowledge and willingness of both of you to give of your time and expertise, this research would not have eventuated. I am extremely gratefully to you both.
Thanks to Toddy for allowing me access to his Waikato Academy and High Performance boys and opening the door for me into the WRU. Thanks to Andrew Douglass and Andrew Gibbs for allowing me to incorporate my research into my work with the St Peters and St Pauls boys. Huge thanks is due to all of the boys who took part in the research. Congratulations, boys, for your success in reaching (St Pauls) and winning (St Peters) the finals.
viii Special thanks to Paul and Tim for your willingness to help out, often at short notice. Thanks, Paul, for saving me several times when equipment, or my use of equipment, was faulty.
I would like to express my love and appreciation to Nanna who has devotedly proof-read every word included in this thesis and most of my work over the last four years with very little reward. I appreciate this immensely.
To my darling Anna, thank you for continuing to believe in me and encourage me even when I have been at my lowest. I love you more than I can express in words.
ix
List of Figures
Page Number Figure 1: A Comparison of Pre-Training Back Squat 1RM Strength and Percent Improvement in Pre-to Post-Training Squat Strength Between the Fixed Load Training Group (n=10) and the Variable Resistance Training Group (n=10) ... 52
x
List of Tables
Page Number Table 1: Subject Information Including (Mean ±SD) Age, Height (of Barbell on Shoulder), Pre-Intervention Mass and Back Squat 1RM ... 31
Table 2: Training Protocol, Weeks 1-5. ... 32
Table 3: Mean ± SD Pre-, Mid- and Post-Training Load Afforded by Variable Resistance Short and Tall Subject ... 41
Table 4: Physical Characteristics of High School (Subjects Mean ± SD) ... 47
Table 5: High School Subjects’ Pre-Training Performance Measures (Mean ± SD) of Variable Resistance Training (n=10) and Fixed Load Training (n=10) Groups. ... 51
Table 6: A Comparison of High School Subjects’ Variable Resistance Training (n=10) and Fixed Load Training (n=10) Groups Performance Measures. Including Percent Change in Back Transformed Mean ± SD and Difference in Mean Change; ± 90% Confidence Limit ... 51
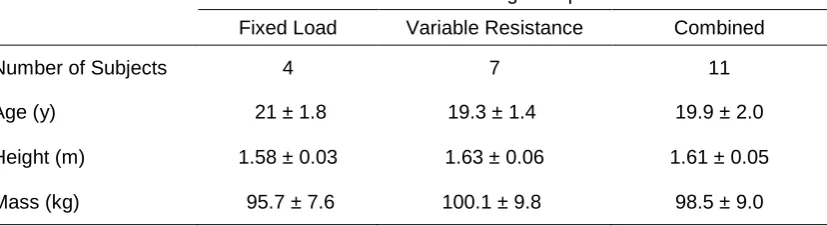
Table 7: Physical Characteristics of Semi-Elite Subjects (Mean ± SD) ... 59
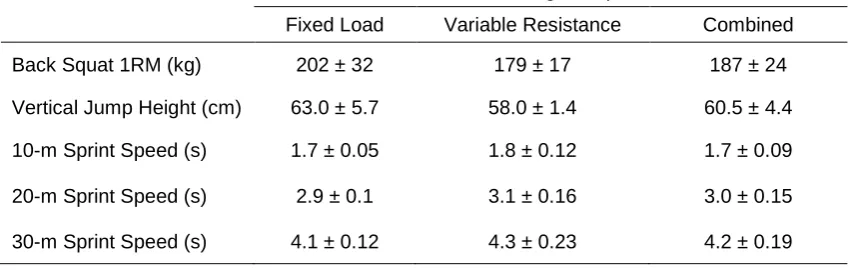
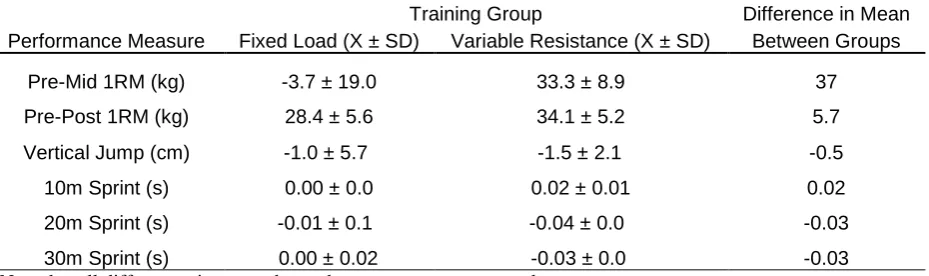
Table 8: Semi-Elite Subjects’ Pre-Training Performance Measures (Mean ± SD) of Variable Resistance Training (n=7) and Fixed Load Training (n=4) Groups ... 60
xi
Operational Definitions
Load: The weight or force used to oppose a training movement, made up of fixed and/or variable resistance.
Variable Resistance: A load that changes throughout a range of motion. This is commonly achieved with the application of elastic bands to a barbell causing increased elastic tension through the concentric phase of a movement. Additionally variable resistance may be achieved with the application of chains to a barbell.
Repetition Maximum: The maximum load that a subject is able to lift over a set number of repetitions.
Fixed Load Training: Traditional weight training utilising loads that do not change throughout a range of motion.
Variable Resistance Training (VRT):
xii Mechanical Advantage: The accumulation of muscular force throughout a
CHAPTER ONE: INTRODUCTION
Background
There is a strong relation between strength, power and dynamic athletic performance (Baker & Nance, 1999; Kawamori & Haff, 2004; Tan, 1999). Therefore, the ability to develop high levels of muscular strength and power are critical components in many sporting activities (Kilduff et al., 2007). As a result of this, new training techniques are continually being developed in an attempt to improve strength and power adaptations in vivo. Research into the effects of new training techniques is valuable in determining the effectiveness and value of these techniques. One such method that has recently become popular is VRT (Ghigiarelli et al., 2009; McCurdy, Langford, Jenkerson & Doscher., 2008).
Variable resistance is a broad term used to describe loading techniques that provide changing loads throughout a movement and traditionally involves an increasing load during the concentric phase and decreasing load during the eccentric phase. The concept of variable resistant training is not new. As early as the 1940’s experimentation with counter balances and pulley systems was being used to produce progressive resistance exercise. In the 1980’s, pulley machines with changing radii were utilised as a type of variable resistance training (Keohane, 1986). Variations on machine-based variable resistance, such as the BowFlex® exercise machine, have also been developed.
2 increase range of motion after trauma (Patterson, Stegink, Hogan & Nassif, 2001; Wallace, Winchester & McGuigan, 2006). The addition of chains to fixed load has also been utilised as a mechanism for producing variable resistance and has received some attention in previous literature (Ghigiarelli et al., 2009; McCurdy, Langford, Ernest, Jenkersin & Doscher, 2009). Recently, variable resistance has been applied to strength and power training in an attempt to obtain improved training adaptations (Wallace et al., 2006).
3 adaptations (Ebben & Jensen 2002; Faron, 1985; Ghigiarelli et al., 2009; Wallace et al., 2006).
It has been purported that training eccentrically at loads which exceed normal training thresholds allows for greater muscular adaptation to be developed (Higbie, Cureton, Warren & Prior, 1996). It has also been suggested that VRT may cause greater eccentric loading to occur by increasing the eccentric velocity and therefore the force needed to decelerate the load during this phase (Conlin, 2002; Cronin, McNair, & Marshall., 2003). Theoretically, there may be an additional advantage in using elastic tension which may not be relevant to the use of chains as a mechanism to provide variable resistance (Conlin, 2002; Cronin et al, 2003). However, in contrast to the purported benefits of VRT, it has also been suggested that variable resistance may be ineffective in producing strength adaptations, as reduced load at the end of an eccentric movement may not be an adequate stimulus to cause improvements in this range of movement (McCurdy et al., 2009).
Rationale for Investigation
4 Ghigiarelli et al., 2009; McCurdy et al., 2009), much of this research is statistically inconclusive and more research is required in this field.
There are a number of theoretical advantages of variable resistance training as a tool for power development, including increasing load through the concentric phase of a movement and more closely reflecting muscular force production through a range of motion. However limited research in this field of study and the longitudinal research that exists, to date, has focussed on upper body movements (Ghigiarelli et al., 2009; McCurdy et al., 2009). In light of this, there is a need for further longitudinal research into the effect of variable resistance training in lower limb strength and power development.
Aim of Research
5
Hypotheses
Based on previous work in the area it was hypothesised that:
1. Variable resistance back squat training will produce greater strength gains in comparison to fixed load back squat training.
6
CHAPTER TWO: LITERATURE REVIEW
Introduction
Muscular strength is a foundational prerequisite of muscular power (Tan, 1999). Furthermore, the relationship between power and dynamic athletic performance has been well established in prior research (Baker & Nance, 1999; Kawamori & Haff, 2004). As such, the ability to develop high levels of muscular strength and power are considered to be a critical component in many sporting activities (Kilduff et al., 2007). This is considered to be important regardless of the sport or predominant energy system, as critical sporting movements are often executed forcefully and quickly (Cormie, Mccaulley, Triplett & Mcbridge, 2006; Elliot, Wagner, & Chiu, 2007; Kraemer & Newton, 2000).
7 of the importance of strength and power to a wide range of sports, new methods for improving strength and power are continually being sought (Wallace et al., 2006). One such method that has been recently developed is VRT (Wallace et al., 2006).
Traditionally during weight training, load is afforded by fixed loads that remain constant throughout a range of motion. However, VRT is designed to vary the load throughout a movement as the force required to move a load increases during the concentric phase (Ebben & Jensen, 2002; Wallace et al, 2006). The most common method of achieving this is by utilising variable resistance elastic bands or chains which increase the load through the concentric movement by increased stretch or increasing the number of links lifted off the ground respectively. It has been suggested that this allows an optimal load to be maintained consistently throughout the range of motion by increasing the load as mechanical advantage increases (Ebben & Jensen, 2002; Faron, 1985; Ghigiarelli et al, 2009; Wallace et al, 2006).
8 This review aims to outline the physiological basis of muscular movement in vivo and to explore the areas of power development which may be relevant to the purported effects of variable resistance training. As such, this review will outline factors affecting strength and power development in vivo and critically discuss the effect that variable resistance training may have in these processes. From this, a review of the theoretical differences in training stimulus that VRT produces in comparison to traditional fixed load training, and the effects that these differences may have on strength and power development, will be undertaken to help to draw conclusions on the effectiveness of VRT as a training technique.
Physiology of the Working Muscle
9 that underpin this theory. Furthermore, the primary concepts of this theory have remained unchanged since its inception (Kraemer & Spiering, 2006).
According to the cross bridge theory, muscular force is produced by myofilament proteins, predominantly actin and myosin cross bridges. Actin and myosin proteins are located throughout muscle fibre and are arranged into individual contractile units of overlapping actin and myosin fibres known as sacromeres (Huxley & Hanson, 1954). Muscular force is produced as actin and myosin cross bridging causes myosin to slide over actin causing the sacromere to reduce in size. This is known as the sliding filament theory (Kraemer & Spiering, 2006; Rassier, MacIntosh & Herzog, 1999).
Actin and myosin cross bridging occurs as a result of a biological cascade triggered by a neurological stimulus originating in the motor cortex. When this stimulus reaches the neuromuscular junction, the motor neuron releases acetylcholine which binds to receptors on the muscle causing the depolarisation of muscle cells. Depolarisation then travels down transverse tubules within the muscle, stimulating the sarcoplasmic reticulum to release stored Ca²+. The Ca²+ released from the sarcoplasmic reticulum then binds to, and changes the shape of, trypomyosin. This exposes actin active sites which myosin heads are able to bind to. They then pull the actin toward the centre of the sacromere, causing the sacromere to shorten in size and causing muscular contraction (Kraemer & Spiering, 2006; Wilmore & Costill, 2004).
10 the sacromere (Matsubara & Yagi 1987; Rassier et al., 1999). During muscular contractions, joint angles that allow for greater actin and myosin cross sectional area will produce the greatest muscular force (Huxley, 2000; Rassier et al., 1999). As such, the magnitude of muscular force production is affected by muscular length (Brughelli & Cronin, 2007; Herrel, Meyers, Timmermans & Nishikawa, 2002). This is known as the length-tension relationship (Brughelli & Cronin, 2007), the force-length relationship (Rassier et al., 1999) or, less commonly, the human strength curve (Kulig Andrews & Hay, 1984).
11
Factors Affecting the Development of Muscular Power
Strength
Strength can be defined as the ability of a muscle to exert force (Wilmore & Costill, 2004; Kulig et al., 1984). It is an essential component of power. Power can be defined as muscular force multiplied by velocity (Cronin & Sleivert, 2005). It is clear that maximal strength is a prerequisite to the development of power (Tan, 1999). As such, a strong relationship exists between maximal strength and power (Baker, 2001a; Baker & Nance, 1999). We can observe this relationship in numerous studies comparing strength status and power production (Baker, 2001a; Baker, 2002; Baker & Nance; Tan, 1999).
12 Although strength is a prerequisite to the development of power, athletes who are exposed to specific power training can become more powerful than non-power trained athletes of equal strength (Baker, 2001a). It has been hypothesised that the relationship between strength and power diminishes as the athlete gains strength closer to their genetic maximum (Kraemer & Newton, 2000). In light of this, it seems important that athletes train not only to gain strength but also to train specifically to improve power. This seems to be particularly important for highly trained athletes who are approaching their genetic ceiling in strength.
An interesting component of muscular strength is the concept of a ‘biological sticking point’, or the weakest point in a muscle’s range of motion, and relates closely to the length-tension relationship. The biological sticking point has been shown to be at or near the beginning of the concentric phase of a movement in a number of training movements, including the back squat (Drinkwater, Galna, McKenna, Hunt & Pyne, 2007; Escamilla, Fleisig, Lowry, Barrentine & Andrews, 2001). This occurs due to a regression in actin myosin overlap during the eccentric phase of a movement, which normally results in a regression in muscular force development at the beginning of the concentric phase (Rassier et al., 1999). The biological sticking point as a component of muscular strength training is disadvantageous as it results in an optimal training load occurring only at this, the weakest point of a movement (Keohane, 1986).
Training Load
13 causes maximal power production (P-max) optimizes improvements in muscular power (Kawamori, Fuchimoto, Toji & Suei; cited in Cormie et al., 2006). In light of this, it seems important to determine, and train at, the load at which P-max is obtained.
14 One of the primary disadvantages of traditional fixed load training is that a muscular movement is limited by the maximum load tolerable at the weakest point of a muscular movement (Faron, 1985; Keohane, 1986). As a result, optimal training load will only be achieved over a small range of motion (Keohane, 1986). A unique characteristic of variable resistance training is that load changes throughout a range of motion. With the addition of chains or bands to a barbell while performing traditional lifts, the load can be increased progressively throughout the concentric phase of motion (Ebben & Jensen, 2002; Wallace et al., 2006). This is thought to allow an optimal load to be achieved consistently throughout the range of motion by producing increasing load as mechanical advantage increases (Ebben & Jensen, 2002; Faron, 1985; Ghigiarelli et al., 2009; Wallace et al, 2006).
15 argues that the linear increase in variable resistance tension during the eccentric phase of a movement works in contrast to the muscular length-tension relationship, which, in single joint movements, produces force most effectively at a mid range of movement (Mcmasters ert al, 2009). Similarly, some variable resistance machines have been designed to produce peak load at the mid range of a movement with reducing loads at the beginning and final phase of movements (Kauhanen et al., 1989). As such, variable resistance provided by bands or chains is thought to provide a low intensity over the muscle’s optimal contractile range in order to accommodate the greater load and reduced ability to produce muscular force at the upper extremities of the movement (Findley, 2004). However, this does not take into account the accumulation of force throughout a muscular contraction.
16 It has also been suggested that training eccentrically at loads which exceed normal training thresholds allows for greater strength adaptation to be developed (Higbie et al., 1996). Traditionally this has been achieved by loading the eccentric phase at a load greater than an athlete’s 1RM, and completing the eccentric phase only (Cronin et al., 2003). A similar training stimulus may be obtained through increasing the velocity of the eccentric phase and therefore the force needed to decelerate the load during the eccentric phase during variable resistance training (Conlin, 2002; Cronin et al., 2003). As such this may cause greater strength adaptation and be an additional advantage of the use of elastic tension to provide variable resistance (Conlin, 2002; Cronin et al., 2003). However, this concept is still theoretical with limited evidence to support the idea that the use of elastic tension results in greater eccentric loading.
17 fixed load training, rather than being unchanged at this point and increasing throughout the concentric phase.
An additional disadvantage of variable resistance is that the force required to stretch the elastic bands used during variable resistance training has not been quantified. This makes determining the load afforded by variable resistance bands difficult (Paterson et al, 2001). This problem is compounded by variations in limb length causing differences in the stretch of variable resistance bands and therefore variations in the force afforded by elastic bands even if the property of a band is unchanged.
Training Velocity
Power is the product of both force and velocity. Furthermore, an important factor in the process of power development is the kinetics and kinematics associated with the load used to provide resistance. Specifically, variations in the force, contractile duration, power and work done in a training movement are dependent on the training load (Crewther et al., 2005). It is not just the load that affects training adaptation, but also the ability of the load to be moved at velocities specific to the desired sporting movement (Cronin et al., 2003; Kawanori & Haff, 2004; Kraemer & Newton, 2000). Because of this, greater performance gains will be achieved at or near the training velocity (Behm & Sale, 1993b). Therefore, when developing strength and power, it is recommended that athletes should perform resistance training that simulates the contraction characteristics of their specific sporting event (Cronin et al., 2003).
18 the speed of muscular contraction is inversely proportionate to the load (Peterson, Alvar & Rhea, 2006). Therefore, as load increases, the velocity at which it can be moved decreases (Newton & Kraemer, 1994). As many sporting disciplines require explosive movements under low loads, it may be speculated that training with light loads would provide superior stimulus for the development of muscular power (Baker et al., 2001a). This is in contrast to traditional strength training which relies on high load with a prolonged period of contraction, producing greater total work output, resulting in greater muscular strength adaptation (Crewther et al., 2005; Tan, 1999). However, as increases in power are specific to the training velocity, variation in training load and subsequently training velocity affect the training adaptation (Newton & Kraemer, 1994). In light of this, it seems that the ability of the load to be moved at velocities and load similar to sports specific movements is indeed a significant factor in training (Cronin et al., 2003; Kawanori & Haff, 2004; Kraemer et al., 2000).
19 potential benefit of variable resistance training is that it combines the benefits achieved from the increased range of acceleration afforded by ballistic training, while at the same time including the higher loads normally afforded from traditional resistance training (Wallace et al., 2006). This theory is supported by research that found both peak power and peak force to increase under certain loads when utilising variable resistance (Wallace et al., 2006). As power is a combination of force and velocity, and peak power occurs towards the end of a concentric phase in dynamic squat movements (Rahmani et al., 2000), this suggests that variable resistance loads allow either greater load to be lifted at similar velocities or similar loads to be lifted at greater velocities as compared to fixed load movements due to a greater range of acceleration. However, no specific research exists supporting the physiological cause of increased peak power due to variable resistance training.
20
Rate of Force Development
The ability of the muscle to produce a high force over a short period is another factor which affects the development of muscular power (Kraemer & Newton, 2000; Newton & Kraemer, 1994). Although training for maximal strength has been shown to improve power (Baker, 2001a; Tan, 1999), it may in fact reduce the rate of force development at sports specific loads (Newton & Kaemer, 1994). As such, it seems that training at sports specific velocities and loads that allow sports specific velocity to be achieved is required to effectively develop the rate of force development (Newton & Kaemer, 1994).
However, training with heavy loads has also been suggested to improve the rate of force development as it requires the activation of fast twitch fibres, increased muscle size and increased concentration of contractile enzymes. In theory this may increase the ability to produce force at an increased rate (Kraemer & Newton, 2000). In contrast to this, as improvements in strength have been shown to be specific to training velocity, and training velocity reduces as load increases, this theory does not seem logical (Newton & Kraemer, 1994).
21 beneficial in increasing the rate of force development at high speeds. However, no research has been found exploring the effect of VRT on this area of force development.
It has also been postulated that the intent of movement may be an important factor in determining training effect (Behm & Sale, 1993a). Young and Bilby (1993) demonstrated that training the back squat under heavy loads with explosive intent over a seven week period resulted in a significantly greater improvement in power measures when compared to movements without explosive intent. As such it may not be necessary to perform an actual high velocity movement to obtain the explosive training adaptation typically associated with velocity specific training (Behm & Sale, 1993a).
Age
Another factor affecting the development of strength, and consequently power, is the age of athletes. Due to the progression of growth during adolescence, strength will increase naturally during this period. However gains in strength and power achieved through resistance training of sufficient intensity, volume and duration are significantly greater than those produced through natural adolescent development (Faigenbaum et al, 2010).
22 testosterone and GH (Crewther, Keogh, Cronin, & Cook, 2006). It is common for strength gains of approximately 30% to be obtained in adolescents over short, 8-20 week, training periods (Faigenbaum et al, 2009) with the greatest rate of improvement occurring early in training periods (Falk & Tenenbaum, 1996). This accelerated rate of improvement has been shown to slow by the age of 16-17, particularly in population groups that have trained throughout their early pubescent years (Jagiello et al., 2004). However, the relationship between physical maturity and VRT has not been addressed in prior research.
An Overview of Variable Resistance Training
Variable resistance training is not a new concept. As early as 1948 counter balances and pulley systems were being experimented with to produce “progressive resistance exercise” (Keohane, 1986). In the 1980s, pulley machines with changing radii were utilised as a type of variable resistance training (Keohane, 1986). This was designed to reflect the length-tension relationship during a movement (Kauhanses et al., 1989). There are also modern examples of machine-based variable resistance products such as the BowFlex® exercise machine.
23 Variable resistance can also be afforded through the addition of elastic bands. Variable resistance training of this nature has been used in rehabilitation to provide controlled stretch and strengthening and to increase range of motion after muscular trauma (Patterson et al., 2001; Wallace et al., 2006). Recently, variable resistance has also been applied to strength and power training in an attempt to obtain improved training adaptations (Wallace et al., 2006).Despite the theoretical benefits of variable resistance training, very little scientific research exists in this field. Furthermore, the research that does exist has been acute in duration (Ghigiarelli et al., 2009) and does not uniformly support the effectiveness of VRT. Ebben and Jensen (2002) found no significant difference in peak or mean ground reaction force between variable resistance squats while using chains or elastic bands as compared to traditional fixed load squat. However, the loading procedure for variable resistance in this test was calculated with the total resistance of the chain or bands (the full weight of the chain or the peak tension of the band) being subtracted from the fixed load (Ebben & Jensen, 2002). This gave a lower load when using bands or chains, as the total load was only equal to that of the free weight at full extension when the full force of the band or chain was active.
24 of one repetition maximum. This procedure, however, has not been tested with the use of chains as a means of producing variable resistance and more research into the kinetic effects VRT has been recommended (Wallace et al, 2006). Further research into the kinetic effect of variable resistance may also help in understanding the training effect of variable resistance loads more accurately.
Cronin et al (2003) also investigated the effect of ten weeks of VRT on a ballistic supine squat machine on muscular development. This research found that ballistic fixed load training and ballistic variable resistance training caused significantly greater changes in strength and power measures than non-ballistic fixed load training. However, no significant difference was found between the ballistic fixed load training and the ballistic variable resistance training groups. This research also found similar electromyographic results in fixed load and variable resistance training groups. However, the use of a supine squat machine in this research reduces the validity of these findings when compared to functional movements which are generally performed while standing. Furthermore, the utilisation of variable resistance training in ballistic movements is not compatible with the suggestion that VRT may combine the benefits afforded from the increased range of acceleration associated with ballistic training while utilising heavy loads normally utilised in traditional resistance training (Wallace et al., 2006).
25 development when training on the bench press over a seven-week period. However, both training with elastic bands and the addition of chains to fixed loads did increase strength and some power measures to a greater extent than fixed load training. Although this suggests that VRT provides greater strength and power adaptations, this research was inconclusive due to a lack of statistical power. A limitation to this research is that the experimental loading procedure was used only once a week, with all subjects also participating in fixed load bench press training. This may have reduced the magnitude of difference between these training procedures compared to a training intervention with a more regular and exclusive use of VRT. Furthermore, it was not stated if an attempt to standardise loads across training groups was undertaken in this research (Ghigarelli et al., 2009).
26 research has shown mean force and power values can be greater with mixed variable resistance and fixed load as compared to fixed load training (Wallace et al, 2006).
Conlin (2002) claims that the use of bands in conjunction with force training improves maximal strength, starting strength, speed strength and acceleration needed for power events. However, there seems to be limited specific scientific evidence to reinforce these claims (Ghigiarelli, et al., 2009; Wallace et al., 2006). Without supporting scientific research, these are subjective views and a greater body of evidence is required to prove such claims. Furthermore, variations in methodological procedures and conflicting results within the existing research have complicated understanding in this field. This does not necessarily discount the effectiveness of variable resistance training in developing power, but highlights the need for a greater body of scientific research into the effect of this training technique.
27 As previously stated, there are some difficulties in utilising variable resistance as a training tool and as a focus of research. These problems stem from difficulties in standardising training loads from 1RM (Newsman, Leese & Fernandez-Silva, 2005). Exercise intensity has traditionally been based on training recommendations calculated from a percentage of 1RM lifts (Newsman et al., 2005). This is demonstrated by the extensive debate concerning ideal loading for power development in terms of the most appropriate percentage of 1RM to lift (see Training Load above). Determining loads based on percentages of 1RM is relatively simple when dealing with traditional fixed loads. However, because of the nature of variable resistance training, accurately determining load is much more complex and poses serious complications in measuring and recommending variable resistance loads. Although some evidence exists that variable resistance training load can be effectively managed based on rate of perceived exertion (Colado & Tripplet, 2008), this can be particularly problematic when precise measurements are required during scientific testing and may be a contributing factor to the lack of research in this field.
28
Conclusion
Although VRT has been utilised since the 1940’s, VRT has only recently been applied to free weight training in an attempt to obtain muscular strength and power adaptations by varying the load throughout a training movement as tension increases during the concentric phase. This can be achieved with the addition of bands and/or chains to a fixed load.
29
CHAPTER THREE: METHODS
Experimental Design
This study was primarily designed to test the effect of variable resistance training on strength and power development compared to the strength and power gains achieved through fixed load resistance training. A pair matched training study was implemented over five weeks to compare the mean changes in strength and power measures between a variable resistance training group and a fixed load training group.
All subjects who participated in this research were involved in pre-existing training environments. Training practices between these groups was not standardised. However training within the pre-existing environments was standardised. Because of this, a within-group pair match system was used to match subjects from within the same training environments. The variable resistance and fixed load training groups were pair matched based on the pre intervention predicted 1RM.
Strength and power tests consisted of a back squat 1RM, predicted from a four repetition maximum lift (4RM), vertical jump height and 30m sprint speed. Vertical jump height and 30m sprint speed were tested both at the beginning and the end of the training period, while the 4RM test was implemented at the beginning, mid-point and end of the five-week training period.
30 help to insure the reliability of this research by provided a more precise understanding of the load that variable resistance afforded subjects throughout the training study.
Subjects
A group of male rugby players (n = 31) participated in this study (see Table 1). Subjects were involved in pre-existing training environments, with training levels ranging from semi-professional and elite age group academy players (n = 11) to high level high school players (n = 20). However statistical analysis by skill level was not performed due to the low numbers in each group. More detailed subject information is included in chapters four and five for the high school and semi-elite players respectively.
Subjects were provided with a participant information sheet outlining their rights and expectations during the training study (Appendix A) and were required to sign a participant consent form (Appendix B). Subjects were also required to complete a questionnaire outlining their physical preparedness for participation in the training study (Appendix C). Because all subjects were involved in high intensity weight training, the pre-exercise screening questionnaire focused on each subject’s ability to complete the specific training and testing requirements of the study.
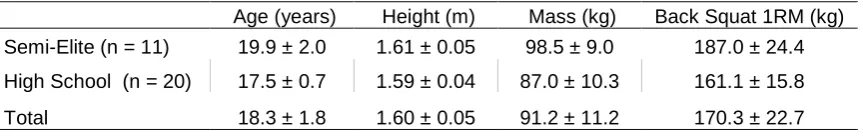
31 Table 1: Subject Information Including (Mean ±SD) Age, Height (of Barbell on Shoulder), Pre-Intervention Mass and Back Squat 1RM.
Age (years) Height (m) Mass (kg) Back Squat 1RM (kg) Semi-Elite (n = 11) 19.9 ± 2.0 1.61 ± 0.05 98.5 ± 9.0 187.0 ± 24.4
High School (n = 20) 17.5 ± 0.7 1.59 ± 0.04 87.0 ± 10.3 161.1 ± 15.8
Total 18.3 ± 1.8 1.60 ± 0.05 91.2 ± 11.2 170.3 ± 22.7
Heights was measured from subjects’ shoulders i.e. height of the barbell.
insure the study due to potential rugby related injury. As such, not all subjects completed the entire training study. Information has been included for all subjects who contributed useful data, e.g. pre- and mid-point strength tests, regardless of whether they completed the entire study or not.
Training Protocol
32 All squat training took place in training cages, under the supervision of a trained fitness professional and with the assistance of a spotter if required. Throughout testing and training, squat depth was required to reach 90 degrees at the knee. This was visually measured for each subject and a band placed across the cage at gluteal height. Depth was standardised by requiring subjects to touch the band with their glutei at the bottom of their eccentric phase. Variable resistance was obtained through the use of elastic bands (Get Strength, Auckland, New Zealand). When utilising variable resistance, the bands were anchored to the base of the cage and attached to either end of the barbell. This provided increasing tension as the band was stretched through the concentric phase of the squat.
In order to encourage a more specific stimulus toward power adaptations, every second training session was performed with powerful intent under reduced load. During power focused sessions, subjects were instructed to control the eccentric phase
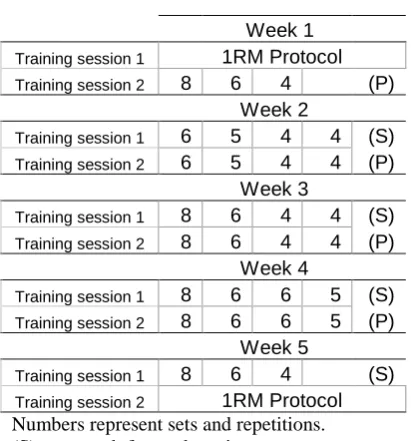
Table 2: Training Protocol, Weeks 1-5. Week 1 Training session 1 1RM Protocol Training session 2 8 6 4 (P)
Week 2
Training session 1 6 5 4 4 (S) Training session 2 6 5 4 4 (P)
Week 3
Training session 1 8 6 4 4 (S) Training session 2 8 6 4 4 (P)
Week 4
Training session 1 8 6 6 5 (S) Training session 2 8 6 6 5 (P)
Week 5
Training session 1 8 6 4 (S) Training session 2 1RM Protocol Numbers represent sets and repetitions. (S) = strength focused session
33 of the squat but to move through the concentric phase as quickly and powerfully as possible as it has been suggested that intent to move a load at speed results in power adaptation (Behm & Sale, 1993a; Young & Bilby, 1993). Due to the explosive nature of this movement, this often resulted in subjects moving up onto their toes or having their feet leave the floor completely. During strength focused training sessions, subjects were advised to work through the entire training movement in a controlled manner with no specific instructions concerning the tempo of the movement.
Training Loads
Suggested training loads were prescribed for all subjects, and their repetitions, sets and suggested loads were outlined at the beginning of each session. Subjects were strongly encouraged to lift the suggested training loads, but lenience was allowed for subjects to marginally amend the actual load lifted. Actual load lifted and repetitions were recorded in every training session.
Training loads were initially prescribed based on predicted 1RM using the Brzycki formula (1RM = load/(1.0278-0.0278*reps)) on the subject’s pre-training 4RM (LeSuer et al., 1997). The Brzycki formula was then reversed to indicate the maximum load a subject could lift for the desired number of repetitions (rep max =
1RM*(1.0278-(0.0278*desired reps))). This value was rounded to the nearest 5 kg. The Brzycki
formula was chosen primarily because of its close statistical relationship between predicted and 1RM back squat scores and its ease of mathematical reversal.
34 required and to continue the last set until fatigue either caused deterioration in form or prevented the load from being lifted. This was done to allow subjects to choose to lift a greater load as a result of training adaptations, unrestricted by a suggested load. The value of the last set of each strength training session was used to re-predict the subject’s 1RM and to determine the training loads for the following training session. The repetition maximum was reduced by 20% when prescribing for power focused trainings sessions, to allow for a more explosive movement to occur.
Prescribing loads based on a percentage of the subjects’ 1RM ensured that training loads in both the variable resistance training group and fixed load training group were
standardised comparable to those of equal strength. Furthermore, leaving a self-selected training load at the end of a strength training session allowed for adaptation to be expressed through increased training loads outside of the constraints of a predicted load and ensured overload was obtained during each training session.
.
35
Standardising Training Load
In order to account for the differences in the load afforded by variable resistance depending on subjects’ height, subjects were categorised into groups based on their height. The height of every subject was measured from bar height at the top of a natural squat movement. Subjects ranged in height from 1.55m to 1.70m and were divided into two height categories: 1.55m-1.625m and 1.625m-1.70m. As it was not logistically possible to measure the resistance afforded by variable resistance bands on each subject, two subjects who closely reflected the median point of each height group (subjects 1.57m and 1.67m in height respectively) were used to determine an average load achieved by the respective height groups
Variable resistance loads were measured using a Kistler 9281B multi-component force measuring plate (Kistler Instruments, Hampshire, UK), measuring at a rate of 500hz. With bands anchored to the bottom of a training cage and attached to each end of an Olympic bar, the mean load afforded by each set of variable resistance band was determined by calculating the average force at the top of the concentric phase and at the bottom of the eccentric phase of a 90 degree squat. Subjects were required to hold the variable resistance load at the top of the concentric phase and the bottom of an eccentric phase as steadily as possible for five seconds. This was repeated with all 6 sets of bands for both subjects. Bands ranged in width from 0.5 to 1.75 inches.
36 elastic tension. From this, an average of the isolated load at peak tension and at the lowest tension was calculated. This value represented the average load produced through variable resistance and is comparable in terms of work done to an equal fixed load. With this information, variable resistance loads could be prescribed with an equal mean weight as fixed loads. This was important in helping to insure the reliability of this research.
Furthermore, in order to insure the reliability of training loads used throughout the study, each set of bands was also measured at the mid-point and completion of the training study. This determined the rate of stretch and relaxation that occurred to variable resistance elastic bands with use. Due to minor changes in the amount of variable resistance afforded by the bands after use, loading protocols were changed slightly at the midpoint of training to ensure that loads prescribed reflected the actual load lifted.
Testing
The physiological tested used in this study consisted of a 4RM back squat from which a predicted back squat 1RM was calculated, vertical jump height and 30m sprint speed. All tests were completed pre- and post-training, while 1RM was also obtained from training values in the third week of training.
Back Squat 1RM Protocol
37 subject’s toes to mark the foot position at which the subject achieved their required depth. Depth was standardised by requiring subjects to start each squat with their feet at the same position during each set and by requiring subjects to touch the band with their glutei at the bottom of the eccentric phase.
Subjects were required to complete a warm up set of eight repetitions at a self-selected load. This was followed by a set of six repetitions at approximately 7RM
load. Subjects’ first 4RM lift was performed at a load recommended by a trainer in consultation with the subject. If this load was achieved, subjects were then allowed to attempt a heavier load, as agreed upon by the subject and trainer, after 3 - 5 minutes’ rest. If this greater load was not lifted successfully, the previous successful load was recorded. If a subject was not able to achieve the required depth, or required the assistance of a spotter, the repetition was not counted. If a subject failed to lift the load or suffered lack of form, he was not allowed to continue the set. Once a 4RM had been achieved, a 1RM was calculated using the Brzycki formula (LeSuer et al., 1997).
Vertical Jump Protocol
Vertical jump height was measured with the assistance of a Swift Yardstick (Swift Performance Equipment, NSW, Australia). Subjects were required to complete three maximal effort vertical jumps. The best result of the three efforts was recorded. Vertical jump testing was completed prior to back squat testing.
38 naturally with maximal force. Natural arm swing and counter movement depth was allowed. This was repeated three times with self-selected rest intervals between attempts. Many subjects were already familiar with this testing protocol due to prior, non- related, testing.
30m Sprint Speed Protocol
Subjects were required to warm up as a team before beginning speed testing. Warm up protocols were standardised pre- and post-test within groups, but varied between the high school and semi elite training groups. Warms ups generally consisted of light aerobic activity and dynamic stretches. Subjects were then allowed up to two practise sprints through speed lights before completing their recorded maximal effort sprints. Two maximal 30m sprint efforts were recorded. A rest period of three minutes was required between sprint efforts. Sprint speeds were measured at 10m, 20m and 30m using speed lights (Swift Performance Equipment, NSW, Australia). Times from both sprint efforts were recorded and the average calculated for both 10m, 20m and 30m sprint speed. This was done in order to minimise subject error due to potentially uncharacteristic fast or slow test speeds in any one given sprint performance.
39
Statistical Analysis
Changes in the pre-, post- and mid-point data (where relevant), for back squat 1RM, vertical jump and sprint speed were analysed using a pre-post controlled trial spreadsheet (Hopkins, 2006b). Changes in elastic band tension were analysed using a post- only crossover trials spreadsheet (Hopkins, 2006a). All data were log-transformed and adjusted to the mean of pre-test values before analysis as a covariate. All statistical analyses were determined to a 90% confidence interval (CI). Data were back transformed for use in analysis and is presented as the percentage difference in change ±confidence limit unless otherwise stated. Magnitudes in the differences between within-group changes were based on recommendations outlined by Hopkins et al, utilising a modified Cohen scale, with <0.2 representing a trivial difference, 0.2 - 0.6 representing a small difference, and 0.6 - 1.2 representing a moderate difference (Hopkins, Marshall, Batterham & Hanin, 2009). Data that crossed the threshold for a small positive and small negative difference (-0.2 – 0.2) was determined as unclear. This threshold approach to statistical analysis was chosen above the traditional approach utilising p values because of its ability to clearly state the magnitude and importance of findings. Further the traditional p value approach was forfeited due to it’s fails to deal adequately with the real-world importance of an effect as outlined by Hopkins et al (2009).
40 more in-depth statistical analysis of the semi-elite case study group was not completed due to a lack of statistical power.
Treatment of Subject Groups
The methodological procedures outlined above were implemented identically for both the high school athletes and the semi-elite athletes. Results obtained from the high school athletes experimental investigation has been presented as a research paper appropriate for submission to a peer review journal (Chapter 4). The methods outlined above are repeated in an abbreviated form in the experimental investigation to satisfy the submission requirements of a peer review article.
41 this comparison, inferences were made regarding the effect of VRT in semi-elite athletes, although the findings in this population group were not clear due to a large amount of drop out as a result of sport related injury.
Regression in Loads Afforded by Variable Resistance Bands
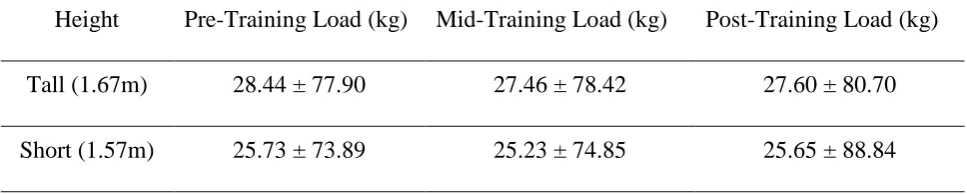
Each resistance band was utilised in an average of 235 lifts by the mid-point of the study and an average of 557 times by the end of the study. There were minimal changes in the mean loads afforded by variable resistance bands both between pre- and mid-study values and mid- to post-study values (see table 3 below). Changes in load afforded by variable resistance bands were statistically unclear.
The maximum number of lifts for a set of variable resistance bands was 838. This set saw a pre- to post-training regression in force of 2.48kg when lifted to a height of 1.67m and 2.03kg when lifted to a height of 1.57m. This is greater than the average regression of 0.84kg and 0.08kg respectively. This suggests regression in force afforded by variable resistance bands will continue to occur as use increases.
Table 3: Mean ± SD Pre-, Mid- and Post-Training Load Afforded by Variable Resistance Short and Tall Subject.
42 It should be noted that mean regression in tension was minimal, although the average resting length of variable resistance bands increased by 19.4mm over the duration of the training period. This suggests that changes in elasticity may not be uniform throughout the range of a variable resistance band’s stretch. It was also observed that regression in variable resistance bands tended to be greater in the heavier (wider) bands, i.e. the bands that provided greater elastic tension, despite often being lifted fewer times. However, these trends are not conclusive and require further research.
Monitoring the regression in variable resistance bands and adjusting loading protocols as appropriate insured that VRT loads could accurately be prescribed throughout this study. This helped to ensure that variations in training adaptations between the training groups resulted from a variation in the training technique, rather than from variation in loads lifted between the VRT and fixed load training groups, and adds to the reliability of the study. As well as this, the lack of meaningful regression in the average force provided by variable resistance bands over an average of 557 lifts suggests that they may be used confidently over an extended period. However, further research is required in this area of study to accurately determine the effective life span of variable resistance training bands.
Limitations
43 2. Although subjects were instructed not to participate in trainings outside of the
research gym session and organised team trainings, this was not monitored. Furthermore, factors such as sleep patterns and nutritional habits may have affected subjects’ physiological responses to this research.
3. Ideally additional factors such as nutritional intake, sleep and incidental activity levels should have been standardised. However, this was outside the scope of this study.
4. Although efforts were made to standardise sprint testing protocol, as sprint testing occurred in an open environment factors such as wind level and slight variations in surface moisture may have affected results. Speed testing lights were set across wind although changes in wind direction during testing were not accounted for.
44
CHAPTER FOUR:
THE EFFECT OF VARIABLE RESISTANCE TRAINING ON LOWER LIMB
STRENGTH AND POWER DEVELOPMENT: TRAINING STUDY
Abstract
New training methods are constantly being sought in an attempt to improve strength and power development. One such method is variable resistance training (VRT). This research aims to determine the effect of VRT on one repetition max (1RM) back squat strength, vertical jump height and 30m sprint time. Twenty male athletes (mean age 17.5 ± 0.7 years) were pair matched based on 1RM scores. Subjects completed a five-week within-group standardised training programme with the control group completing fixed load back squats and the experimental group completing variable resistance back squats (with the use of elastic bands). Pre- and post-training vertical jump height, predicted 1RM squat strength and 10m, 20m and 30m sprint speeds were measured. The VRT group had a greater increases in strength and vertical jump, with a moderate difference in predicted 1RM (mean; ± 90% confidence limit; 7.0; ±6.1%) and a small difference in the within-group changes in vertical jump height (4.6; ± 5.4%) from pre- to post-training. All other changes were trivial or unclear. These results suggest that VRT is a useful training technique in lower body strength and power development.
Introduction
45 considered to be critical components in many sporting activities (Kilduff et al., 2007). Due to the importance of strength and power to a wide range of sports, new methods for improving strength and power are continually being sought (Wallace et al., 2006). This is exemplified by the development of training techniques such as ballistic weight training (Crewther et al., 2005; Cronin et al., 2003; Kraemer & Newton, 2000), plyometric training (Fatouros et al., 2000; Luebbers et al., 2003), and Olympic style weight training (Garhammer, 1993; Newton & Kraemer, 1994). One such method that has recently become popular is variable resistance training (Wallace et al., 2006).
Variable resistance training (VRT) is designed to vary a training load throughout a movement, as resistance increases during the concentric phase and decreases through the eccentric phase (Ebben & Jensen, 2002; Wallace et al., 2006). Early examples of VRT consisted of counter balances and pulley systems producing “progressive resistance exercise” (Keohane, 1986). In recent years VRT, provided by the use of elastic bands, has been utilised in rehabilitation to provide controlled stretch and strengthening, and to increase range of motion after trauma (Patterson et al., 2001; Wallace et al., 2006). More recently, however, by attaching elastic bands or chains to a fixed load, variable resistance has been applied to strength and power training in an attempt to improve training adaptations (McCurdy et al., 2008; Wallace et al., 2006).
46 Faron, 1985; Ghigiarelli et al., 2009). This is thought to combine the benefits afforded from the range of motion and acceleration of ballistic type training, while at the same time including the higher loads normally utilised in traditional resistance training (Wallace et al., 2006). Furthermore, it has been suggested that the use of elastic tension provides a more rapid descent phase than in fixed load training, causing greater eccentric muscular contraction and improved adaptations (Conlin, 2002).
Despite the theoretical advantages of VRT and the recent popularity of utilising chains and bands in training movements (McCurdy et al., 2008), there is still a lack of research into the effects of variable resistance as a training tool. The majority of research that does exist in this field has been acute in duration and only a small amount of research exists investigating the training effects of variable resistance on upper body power (McCurdy et al., 2009; Ghigiarelli et al., 2009). Some research into the effects of prone machine squat jump VRT has been undertaken, although this has some limitations due to the body position and the specific ballistic type training utilised (Cronin, 2003). Therefore, further research is required investigating the longitudinal effects of VRT, specifically on lower limb strength and power development.
47
Methods
Experimental Design
A pair matched training study was implemented over a five week training period to compare the mean changes in predicted 1RM back squat strength (from a 4RM test), vertical jump height and 30m sprint speed between a VRT group and a fixed load training group. Subjects were pair matched based on pre-training predicted 1RM strength. Vertical jump height and 30m sprint speed were tested both at the beginning and the end of the training period, while the 4RM test was implemented at the beginning, mid-point and end of the five-week training period.
Subjects
Twenty male high school rugby union players participated in the study (Table 4). Subjects were all involved in pre-existing training environments. A small number of subjects within the training group did not complete all testing measures due to sports related injuries. However, subject information was included for all subjects who contributed meaningful data.
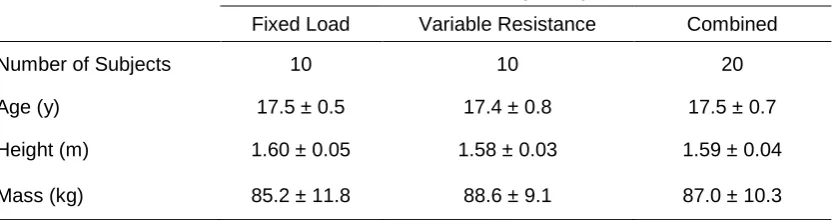
Table 4: Physical Characteristics of High School (Subjects Mean ± SD). Training Group
Fixed Load Variable Resistance Combined
Number of Subjects 10 10 20
Age (y) 17.5 ± 0.5 17.4 ± 0.8 17.5 ± 0.7
Height (m) 1.60 ± 0.05 1.58 ± 0.03 1.59 ± 0.04
Mass (kg) 85.2 ± 11.8 88.6 ± 9.1 87.0 ± 10.3
48
Protocol
All subjects participated in a five-week back squat training intervention. Back squat training sets and repetition were identical between the fixed load and VRT groups. All squat training took place in training cages, under the supervision of a trained fitness professional and with the assistance of a spotter if required. Throughout testing and training, squat depth were standardised to a depth of 90 degrees at the knee. Training repetitions and sets are outlined in the methods section (Table 2).
Suggested repetitions, sets and loads were provided to the subject at the beginning of each session, for both training groups. Training loads were prescribed based on a reverse Brzycki formula from the subjects’ predicted 1RM and rounded to the nearest 5kg. One repetition max strength scores were predicted using the Brzycki formula on subjects’ pre-training 4RM scores (LeSuer et al, 1997). The Brzycki formula was chosen primarily because of its close statistical relationship between predicted and actual 1RM back squat scores and its ease of mathematical reversal.
49 Variable resistance training loads were standardised to fixed loads in order to ensure that differences in training adaptations were due to variations in the training stimulus rather than variations in training loads. This was achieved by measuring the load afforded by variable resistance bands on a force measuring plate (Kistler 9281B, Kistler Instruments, Hampshire, UK) and subtracting half of the load afforded by variable resistance bands from the fixed load, insuring that the mean load lifted in the VRT group was equivalent to those in the fixed load training group.
In order to account for the differences in the load afforded by variable resistance depending on subjects’ height, VRT subjects were categorised into groups based on their height. The height of every subject was measured from bar height at the top of a natural squat movement with subjects subsequently divided into two height categories. As it was not logistically possible to measure the resistance afforded by variable resistance bands on each subject, two subjects who closely reflected the median point of each height group were used to determine an average load achieved by the respective height groups. The heights of these subjects were 1.67m and 1.57m when measuring the height of a barbell on the shoulders at the top of a natural squat movement.
50 loading protocols were adjusted accordingly at the mid-point of training to ensure that loads prescribed reflected the actual load lifted.
Statistical Analysis
Changes in the pre-, post- and mid-data (where relevant), for back squat 1RM, vertical jump and sprint speed were analysed using a pre-post controlled trial spreadsheet (Hopkins, 2006b). All data were log-transformed and adjusted to the mean of pre-test values before analysis as a covariate. All statistical analyses were determined to a 90% confidence interval (CI). Data were back transformed for use in analysis and is presented as percentage difference in change; ±confidence limit unless otherwise stated. A modified Cohen scale was used to determine the magnitude of the differences between the within-group changes, with <0.2 representing a trivial difference, 0.2 - 0.6 representing a small difference, and 0.6 - 1.2 representing a moderate difference (Hopkins et al, 2009). Data that crossed the threshold for a small positive and small negative difference (-0.2 – 0.2) was determined as unclear.
.
Results
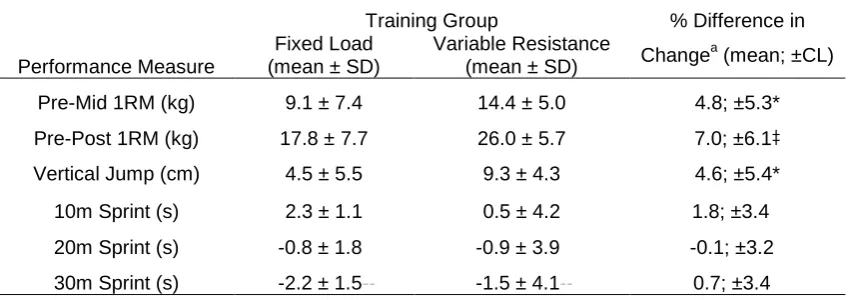
51 Table 6: A Comparison of High School Subjects’ Variable Resistance Training (n=10) and Fixed Load Training (n=10) Groups Performance Measures. Including Percent Change in Back Transformed Mean ± SD and Difference in Mean Change; ± 90% Confidence Limit.
Training Group % Difference in
Performance Measure
Fixed Load (mean ± SD)
Variable Resistance
(mean ± SD) Change
a
(mean; ±CL)
Pre-Mid 1RM (kg) 9.1 ± 7.4 14.4 ± 5.0 4.8; ±5.3*
Pre-Post 1RM (kg) 17.8 ± 7.7 26.0 ± 5.7 7.0; ±6.1‡
Vertical Jump (cm) 4.5 ± 5.5 9.3 ± 4.3 4.6; ±5.4*
10m Sprint (s) 2.3 ± 1.1 0.5 ± 4.2 1.8; ±3.4
--20m Sprint (s) -0.8 ± 1.8-- -0.9 ± 3.9-- -0.1; ±3.2_
30m Sprint (s) -2.2 ± 1.5-- -1.5 ± 4.1-- 0.7; ±3.4_
a
Note that the difference in change of mean does not reflect the exact difference in the change between the control and experimental groups due to back transforming the difference in the change and working with factors. * = small difference: ‡ = moderate difference.
Subjects in both the VRT and fixed load training groups with lower pre-testing predicted 1RM scores showed greater strength improvements. However, the improvement in subjects with higher pre-training 1RM scores was lower in the fixed load training group than the VRT training group (see Figure 1).
Table 5: High School Subjects’ Pre-Training Performance Measures (Mean ± SD) of Variable Resistance Training (n=10) and Fixed Load Training (n=10) Groups.
Training Group
Fixed Load Variable Resistance Combined
Back Squat 1RM (kg) 158 ± 16 165 ± 15 161 ± 16
Vertical Jump Height (cm) 58.6 ± 4.1 54.2 ± 7.4 56.13 ± 6.4
10-m Sprint Time (s) 1.8 ± 0.08 1.8 ± 0.08 1.8 ± 0.08
20-m Sprint Time (s) 3.2 ± 0.16 3.2 ± 0.09 3.2 ± 0.11
52 The VRT group also showed a greater improvement than the fixed load training group
in pre- to post- study vertical jump height (Table 6). A small difference in pre-training vertical jump height was observed between the training groups (4.35cm
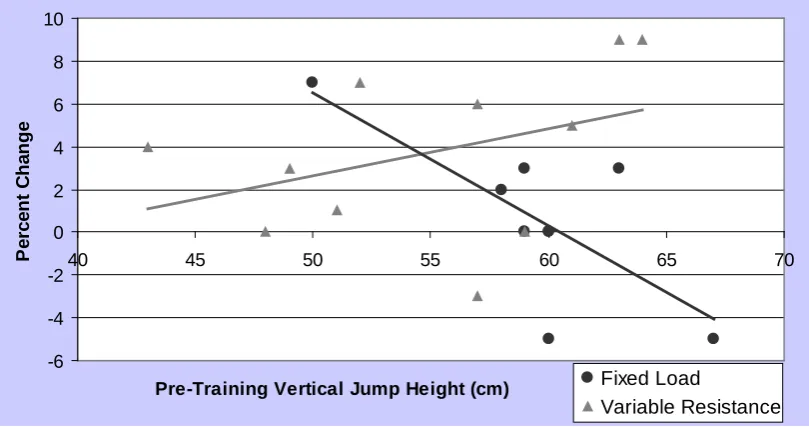
greater vertical jump height in fixed load group). Furthermore, for the VRT group, improvements in vertical jump height were greater in subjects with better pre-test vertical heights (Figure 2). This trend was not reflected in the fixed load training group.
0 5 10 15 20 25 30 35
140 150 160 170 180 190 200
Pre-Training 1RM (Kg)
P
er
cen
t C
h
an
g
e
Fixed load
Variable Resistance
53 Changes in sprint times over all distances were unclear. A decrease in performance was measured over 10m meters in pre-post study sprint speeds in both the variable resistance and fixed load training group. However, both groups showed improvements over 20m and 30m (see Table 6). Greater improvements in sprint times were only seen in the VRT group as compared to the fixed load training group over 20 m.
Discussion
The primary aim of this research was to determine the effect of VRT using band tension on strength and power measures of predicted 1RM, vertical jump and sprint speed. This study has found a small difference in mean change in pre-mid training predicted 1RM of 4.8; ±5.3% and a moderate difference in mean change in pre-post-training predicted 1RM of 7.0; ±6.1% in high school athletes. It is clear, based on these findings, that variable resistance produces a greater improvement in back squat strength than traditional fixed load training in this population group.
Figure 2: A Comparison of Pre-Training Vertical Jump Height and Percent Improvement in Pre- to Post-Training Vertical Jump Height Between the Fixed Load Training Group (n=10) and the Variable Resistance Training Group (n=10).
-6 -4 -2 0 2 4 6 8 10
40 45 50 55 60 65 70
Pre-Training Vertical Jump Height (cm)