Genes and Pathways Induced in Early Response to
Defoliation in Rice Seedlings
Shuangyan Chen1, Xiu-Qing Li2, Aiguo Zhao1,4,
Lijuan Wang1,4, Xiaofeng Li1,4, Qingyun Shi3,
Ming Chen3, Juan Guo1,4, Jichong Zhang1,4,,
Dongmei Qi1, and Gongshe Liu1*
1Institute of Botany, Chinese Academy of Sciences, 100093 Beijing, P. R. China
2Molecular Genetics Laboratory, Potato Research Centre, Agriculture and Agri-Food Canada, 850 Lincoln Road, P.O. Box 20280, Fredericton, NB, E3B 4Z7, Canada
3The National Key Laboratory of Plant Physiology and Biochemistry, College of Life Sciences, Zhejiang University, Hangzhou 310058, China
4Graduate School of the Chinese Academy of Sciences, 100093 Beijing, P. R. China
Abstract
How plant gene expression respond to grazing defoliation is critical for plant re-growth, survival, and composition in the natural and dairy farming grassland environments. Rice, with genome sequence available, was used as a model plant to study grazing-induced pathway selections. When seedlings were 18 cm in height, the top 12 cm was removed by simulated grazing. The gene expression activities within 2 to 24 hours in the remaining aboveground tissues were
profiled using the Affymetrix Rice GeneChips and
RT-qPCR. The seedlings responded to grazing by immediately adjusting their global gene expression, e.g. enhancing anaerobic respiration, starch-to-sugar conversion, sucrose synthesis, and sugar transport. The results suggest that 1) remaining aboveground tissues used anaerobic respiration as an emergency measure for energy/substrates supply; 2) Sink tissues reduced its demand after 2 h; 3) Sucrose synthesis enhancement around the 24th hour is likely driven by shoot re-growth. In total, the expression activity of 466 genes, involved in signal transduction, miRNA regulation,
cell wall modification, metabolism, hormone synthesis, and molecule transporters, had been significantly changed at
least twofold. These genes and their biochemical pathways
identified provide insights into how plants respond to grazing
at the molecular physiology level. Introduction
Grassland grass defoliation can be caused mainly by grazing, although by icy-storms and insects at certain degrees. Considerable variation in plant composition and sustainability of natural or dairy-farming grasslands can be due to grazing defoliation by wild or dairy animals such as cows (Brueland et al., 2003), sheep (Jauregui et al., 2007), deer (Vourch' et al., 2002), rabbits (Crawley, 1990), and kangaroos (Meers and Adams, 2003). Without grazing, grasslands would not be
the same as we see now. Grazing influences the abundance,
distribution, and persistence of plant species in environment with recurrent grazing defoliation (Donaghy and Fulkerson, 2002; Pecetti and Piano, 2002; Del-Val and Crawley, 2005). For example, rabbit grazing increased the abundance of Anthoxanthum odoratum and the Rumex acetosella
grasses and decreased the abundance of Festuca rubra
and Agrostis capillaris grasses (Crawley, 1990). Grazing is a multiple-component process that includes wounding, saliva depositing, and defoliation, etc. The sustainability of various plant species to grazing has likely resulted from the adaptation in various physiological and stress-response pathways. Although grass photosynthesis, secondary metabolism, carbohydrates relocation, and re-growth after grazing have been documented (Detling et al., 1979; Nowak and Caldwell, 1984; Gold and Caldwell, 1990; Orodho and Trlica, 1990; Belesky and Hill, 1997; McPherson and Williams, 1998), it is unclear how rapidly and through which biochemical pathways the seedlings achieve the observed growth-level response.
Among the biochemical pathways usually involved in the response to stresses in plants, anaerobic respiration under anoxia is known to play an important role in the generation of both cellular energy and biosynthesis-required substrates (Givan, 1999). Flooding and gas limitation are among the most known anoxic stresses (Kato-Noguchi et al., 2003; Agarwal and Grover, 2006). Anaerobic respiration is required during anoxia but not yet found for other environmental stresses, although anaerobic respiration is suspected to play an important role in non-anoxic tissues (Kursteiner et al., 2003). In the present study, we hypothesized that anaerobic respirations may be activated as an emergency-rescue approach even in leaf tissues in the air when grasses are grazed.
Recent breakthroughs in molecular biology have provided scientists with exciting new tools to pursue eco-genomics research. Microarray technique has been successfully applied to ecology studies (Gibson, 2002) and
has identified genes that may be involved in plant–insect
interactions (Reymond et al., 2000; Moran et al., 2002; Reymond et al., 2004; Voelckel et al., 2004). After Arabidopsis plants were infested with two types of caterpillars (Pieris rapae and P. brassicae), the plants showed highly similar
gene expression profiles (Reymond et al., 2000; Reymond et al., 2004). In Arabidopsis plants, gene expression profile
changes induced by caterpillar and thrips showed highest degrees of overlap, followed by thrips and aphid induced changes. However, caterpillar and aphid induced changes hardly overlapped at all (De Vos et al., 2005). Although
gene expression profiling has proved to be very informative
in studying Arabidopsis-herbivore interaction, to the best of our knowledge, there is no report that evaluates the
gene expression profile of the early response in grasses to
grazing. Because of the critical importance of gene activities for grass re-growth and survival after grazing, this study aimed to identify the candidate genes and their biochemical *Corresponding author: Email: liugs@ibcas.ac.cn
82 Chen et al.
pathways using rice, the model monocot plant, mainly because its whole genome has been sequenced (Goff et al., 2002).
Materials and methods
Plant materials
Rice (Oryza sativa sp. japonica) cultivar Zhonghua No. 10 was grown in a greenhouse with a 12h light cycle, at 29ºC during the day and 21ºC during the night. The relative humidity was approximately from 50% to 70%. Germinated rice seeds were grown in a plastic container (LxWxH:
9×9×10 cm) filled with rice nursery culture soil (containing
0.15 g each of nitrogen, phosphate, and potassium). Twelve rice seedlings were planted in each plastic container. When the seedlings were at approximately 18 cm in height (about 3-4 leaves per seedling), the top 12 cm part including all the full-size leaf blades was removed by simulated grazing with cow saliva daubing using cotton stick at cut surface immediately after clipping. The shoot meristem was not damaged. The inside main meristem remained unhurt. The remaining aboveground parts (nearly no leaf blades) were collected 2, 6, and 24 h after grazing (Figure 1). For the control seedlings (unclipped), the corresponding parts in ungrazed seedlings were collected. Microarray (2 h) hybridizations and/or RT-qPCR (2, 6 and 24 h) experiments were separately for each of the three independent biological replicates. Each sample was created from pooling at least 20 rice seedlings from two plastic containers. The samples were immediately frozen in liquid nitrogen and stored at -80° for RNA analysis.
RNA isolation, cRNA synthesis, and hybridization to Affymetrix Rice GeneChips
Total RNA was extracted with Trizol reagent (Invitrogen, Carlsbad, CA, USA) and NucleoSpin® RNA Clean-up (CapitalBio company, China). RNA quality was assessed by agarose gel electrophoresis and spectrophotometry. RNA
was processed for use on the 51,279-gene Affymetrix Rice Genome GeneChip arrays (Affymetrix, Inc, Santa Clara, CA, USA), according to the manufacturer’s protocol. In brief, 10 mg of total RNA was used in the reverse transcription
reaction (Ambion MessageAmp kit) to generate the
first-strand cDNA. After the second-first-strand synthesis, the double-strand cDNA was transcribed in vitro to generate biotinylated
cRNA. After purification and fragmentation, the biotinylated
cRNA was used for hybridization. The hybridization, washing, staining, and scanning procedures were performed by CapitalBio company (Beijing, China), as described in the Affymetrix technical manual. The biotin-labelled targets were hybridized to the GeneChip Rice Genome Array for 16 h at 45°C with rotation at 60 r.p.m. in an Affymetrix GeneChip Hybridization Oven 640. Washing and staining were carried out in an Affymetrix Fluidics Station 450, following the
protocol for the standard format of antibody amplification for
eukaryotic targets (EuKGEWS2v4). The processed arrays were scanned with an Agilent GeneArray Scanner (Agilent, Palo Alto, CA, USA).
Data analysis
The hybridization data were analyzed using GeneChip Operating Software (GCOS 1.4) and dChip software (Li and Wong, 2001, 2001) (http://www.dchip.org). The scanned images were examined for any visible defects. Satisfactory images were analyzed to generate raw data saved as CEL
files using the default settings of GCOS 1.4 from Affymetrix.
A global scaling factor of 500, a normalization value of 1, and default parameter settings for the rice genome array were used. The detection calls (present, absent, or marginal) for the probe sets were made by GCOS. Further analysis was done using dChip. The normalization of all arrays was performed using an invariant set approach. For calculating the expression index of probe sets, we used the perfect match/mismatch model and setup “absent” by truncating the low-expression values to the tenth percentile of the probe set signals. The expression values were log2 transformed
after calculating the expression index. The signal log ratio is the change in the expression level of a transcript between the control and experimental samples, and log2 (ratio) ≥1 (2-fold change) or log2 (ratio) ≤-1 (0.5-fold change) was used as cutoff. The Significance Analysis of Microarrays software
package (Tusher et al., 2001) was utilized to analyze the three repeated samples between grazing and control using
q value ≤ 0.05 and fold-change ≥2 as cutoff.
We used GeneBins to define a generic hierarchical classification. GeneBins can be used to identify the
functional categories associated with a set of sequences
(e.g. differentially expressed) and thus find the metabolic
pathways or other cellular functions up- or down-regulated in microarray experiments (Goffard and Weiller, 2007). The sum of the percentages can be more than 100% as a gene can be assigned to several BINs.
RT-qPCR
The total RNA was treated with DNase I to avoid DNA contamination. One microgram of RNA was reverse transcribed using the Superscript II reverse transcriptase (Invitrogen) with an oligo d(T18) primer according to manufacturer’s instructions. PCR experiments were conducted using RealMasterMix (SYBR Green) (Tiangen Biotech, Beijing, China). Reactions were carried out on a Rotor-Gene 3000 multicolor real-time detection system.
The following standard thermal profile was used for all
PCR experiments: 95 °C for 10 min; 45 cycles of 95 °C for 15 s, 55 °C for 20 s and 68 °C for 20 s; then 72 °C for 10 min. Fluorescence signals were captured at the end of each cycle, and the melting curve analysis was performed
from 72 °C to 95 °C. Gene-specific primers were designed
using the Primer3 software (Table S1). Data analysis was performed with the Rotor-Gene 6 software. The relative
quantification method was used to evaluate quantitative variation between replicates examined. The amplification
of actin gene sequence (Os03g0718100) was used as the internal control to normalize all the data.
Results
Gene expression profile in grazing-treated rice
seedlings
Within 24 hours after clipping/grazing, the young leaves at the centre of the seedling shoot re-grew to approximately 3 cm longer (Figure 1). When RNA from the aboveground parts harvested 2 h after clipping was used in hybridization analysis against the 51,279 genes on the GeneChip arrays, the expression activity of 466 probe sets changed at least
2 fold (q≤ 0.05) in the grazed seedlings, compared to the
corresponding ungrazed seedlings (Table S2).
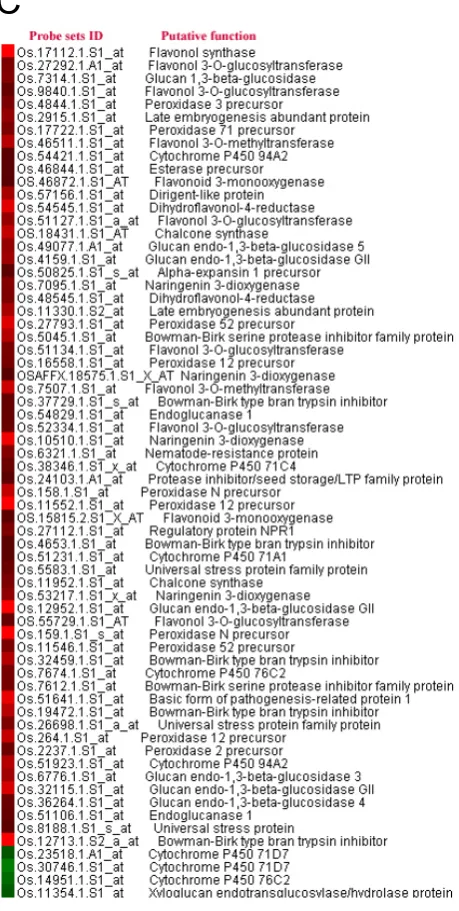
In the generic hierarchical classification of the 466 genes
84 Chen et al.
A
B
C
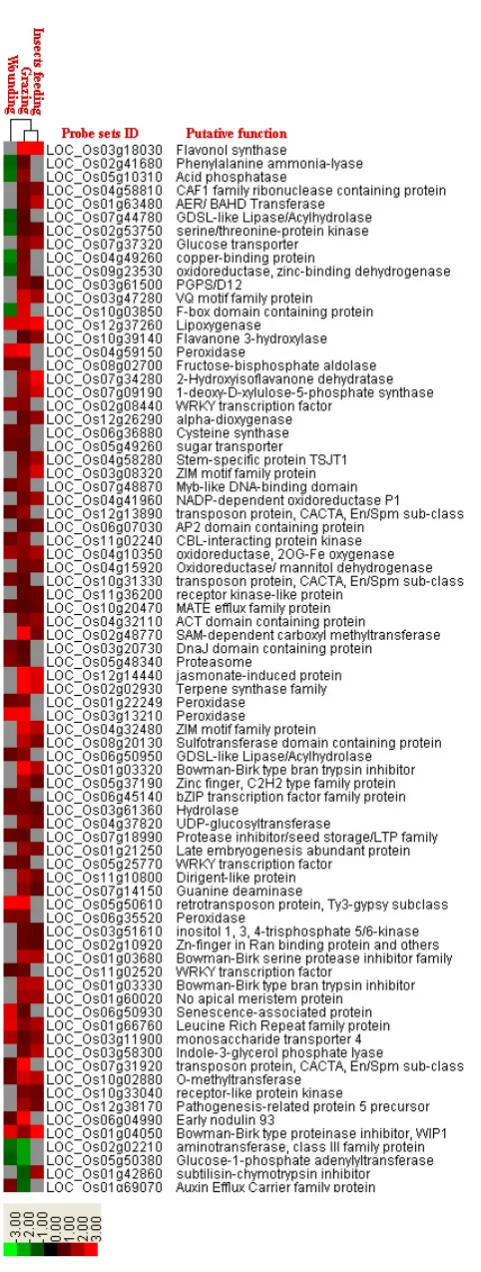
Figure 3. Four major functional groups of genes with at least twofold activity changes at 2h according to the microarray analysis. A (Group I): Genes involved in signal transduction and transcription factors; B (Group II): Hormonal signaling pathways genes; C (Group III): Secondary metabolism and defense-related genes; and D (Group IV): Carbohydrate metabolism genes. Green to bright red: down regulation to up-regulation.
amino acid metabolism (9.5%), and lipid metabolism
(8.2%). Genes classified to membrane transport, signal
transduction, and ligand-receptor interaction were 4.2%, 5.7% and 3.8%, respectively. Genes involved in cell growth and death was 4.4%.
The activity changes for four functional gene groups including signal transduction and transcription factors, hormonal signaling pathways, secondary metabolism and defense, and carbohydrate metabolism genes are demonstrated in Figure 3.
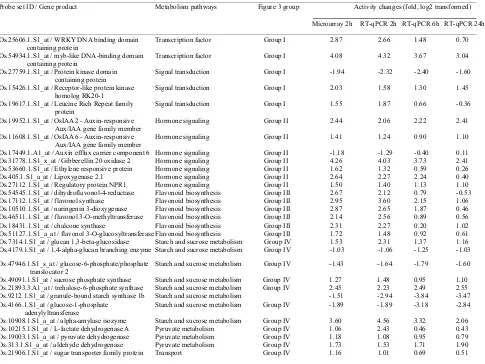
The validation of microarray results was conducted using RT-qPCR analysis of 30 differentially expressed genes covering all the four functional groups and both up-regulated and down-up-regulated genes (Table 1). These genes were chosen, based on biochemistry knowledge, from those
involved in flavonoid biosynthetic pathways, carbohydrate
metabolism, hormone signaling, signal transduction and transcription factors. The expression activities determined by RT-qPCR data correlate strongly with the changes
identified by the microarray experiments (R2 = 0.93, Figure S1).
Signal transduction and transcription factors
Several receptor-like kinase genes in the signal transduction
pathways were activated (Figure 3A), including genes encoding receptor-like serine-threonine protein kinase, and receptor-like protein kinase homolog RK20-1. A number of non-receptor protein kinase genes were also induced, including serine/threonine-protein kinases, GHMP kinases putative ATP-binding protein, calmodulin-binding protein, leucine rich repeat family protein, and cyclin delta-2. Expression changes were also observed in several transcription factors such as AP2, WRKY, MYB, Helix-loop-helix, NAC, EF hand, F-box motif, bHLH, and bZIP families.
Hormonal signaling pathways
A cytochrome P450 74A1 gene, a lipoxygenase 2.1 gene, a 12-oxophytodienoate reductase gene, and two SAM dependent carboxyl methyltransferase family protein genes were up-regulated by grazing (Figure 3B). Each of these genes are involved in jasmonic acid (JA) synthesis. The genes up-regulated by grazing include also an ethylene synthesis gene encoding 1-aminocyclopropane-1-carboxylate oxidase 1 (ACO 1), two ethylene-responsive protein genes, two AUX/IAA family protein genes, and a gibberellin-20 oxidase-2 gene (Figure 3B).
22
Table 1. Description of 30 grazing responsive genes used in RT-qPCR analysis.
2
3
Probe set ID / Gene product Metabolism pathways Figure 3 group Activity changes (fold, log2 transformed) 4
5
Microarray 2h RT-qPCR 2h RT-qPCR 6h RT-qPCR 24h 6
7
Os.25606.1.S1_at / WRKY DNA binding domain Transcription factor Group I 2.87 2.66 1.48 0.70 8
containing protein 9
Os.54934.1.S1_at / myb-like DNA-binding domain Transcription factor Group I 4.08 4.32 3.67 3.04 10
containing protein 11
Os.27759.1.S1_at / Protein kinase domain Signal transduction Group I -1.94 -2.32 -2.40 -1.60 12
containing protein 13
Os.15426.1.S1_at / Receptor-like protein kinase Signal transduction Group I 2.03 1.58 1.30 1.45 14
homolog RK20-1 15
Os.19617.1.S1_at / Leucine Rich Repeat family Signal transduction Group I 1.55 1.87 0.66 -0.36 16
protein 17
Os.19952.1.S1_at / OsIAA2 - Auxin-responsive Hormone signaling Group II 2.44 2.06 2.22 2.41 18
Aux/IAA gene family member 19
Os.11608.1.S1_at / OsIAA6 - Auxin-responsive Hormone signaling Group II 1.41 1.24 0.90 1.10 20
Aux/IAA gene family member 21
Os.17449.1.A1_at / Auxin efflux carrier component 6 Hormone signaling Group II -1.18 -1.29 -0.40 0.11 22
Os.31778.1.S1_x_at / Gibberellin 20 oxidase 2 Hormone signaling Group II 4.26 4.03 3.73 2.41 23
Os.53660.1.S1_at / Ethylene responsive protein Hormone signaling Group II 1.62 1.32 0.59 0.26 24
Os.405.1.S1_a_at / Lipoxygenase 2.1 Hormone signaling Group II 2.64 2.27 2.24 0.40 25
Os.27112.1.S1_at / Regulatory protein NPR1 Hormone signaling Group II 1.50 1.40 1.13 1.10 26
Os.54545.1.S1_at / dihydroflavonol-4-reductase Flavonoid biosynthesis Group III 2.67 2.12 0.79 -0.53 27
Os.17112.1.S1_at / flavonol synthase Flavonoid biosynthesis Group III 2.95 3.60 2.15 1.06 28
Os.10510.1.S1_at / naringenin 3-dioxygenase Flavonoid biosynthesis Group III 2.87 2.65 1.87 0.46 29
Os.46511.1.S1_at / flavonol 3-O-methyltransferase Flavonoid biosynthesis Group III 2.14 2.56 0.89 0.56 30
Os.18431.1.S1_at / chalcone synthase Flavonoid biosynthesis Group III 2.31 2.27 0.20 1.02 31
Os.51127.1.S1_a_at / flavonol 3-O-glucosyltransferase Flavonoid biosynthesis Group III 1.72 1.48 0.92 0.61 32
Os.7314.1.S1_at / glucan 1,3-beta-glucosidase Starch and sucrose metabolism Group IV 1.53 2.31 1.37 1.16 33
Os.4179.1.S1_at / 1,4-alpha-glucan branching enzyme Starch and sucrose metabolism Group IV -1.03 -1.06 -1.25 -1.03 34
23 Os.47946.1.S1_s_at / glucose-6-phosphate/phosphate Starch and sucrose metabolism Group IV -1.43 -1.64 -1.79 -1.60 1
translocator 2 2
Os.49091.1.S1_at / sucrose phosphate synthase Starch and sucrose metabolism Group IV 1.27 1.48 0.95 1.10 3
Os.21893.3.A1_at / trehalose-6-phosphate synthase Starch and sucrose metabolism Group IV 2.45 2.23 2.49 2.55 4
Os.9212.1.S1_at / granule-bound starch synthase 1b Starch and sucrose metabolism -1.51 -2.94 -3.84 -3.47 5
Os.4166.1.S1_at / glucose-1-phosphate Starch and sucrose metabolism Group IV -1.89 -1.89 -3.18 -2.84 6
adenylyltransferase 7
Os.10908.1.S1_a_at / alpha-amylase isozyme Starch and sucrose metabolism Group IV 3.60 4.56 3.32 2.06 8
Os.10215.1.S1_at / L-lactate dehydrogenase A Pyruvate metabolism Group IV 1.06 2.43 0.46 0.43 9
Os.19003.1.S1_a_at / pyruvate dehydrogenase Pyruvate metabolism Group IV 1.18 1.08 0.95 0.79 10
Os.313.1.S1_a_at / aldehyde dehydrogenase Pyruvate metabolism Group IV 1.73 1.53 1.71 1.90 11
Os.21906.1.S1_at / sugar transporter family protein Transport Group IV 1.16 1.01 0.69 0.51 12
13 14
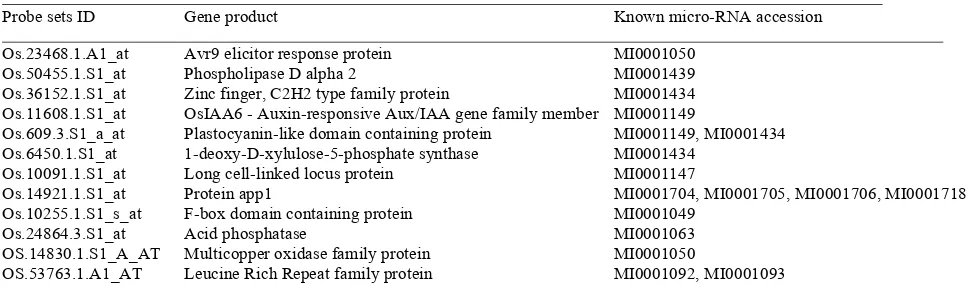
Table 2: Known micro-RNA and its target genes responsive to grazing. 15
16
Probe sets ID Gene product Known micro-RNA accession
17
18
Os.23468.1.A1_at Avr9 elicitor response protein MI0001050 19
Os.50455.1.S1_at Phospholipase D alpha 2 MI0001439
20
Os.36152.1.S1_at Zinc finger, C2H2 type family protein MI0001434 21
Os.11608.1.S1_at OsIAA6 - Auxin-responsive Aux/IAA gene family member MI0001149 22
Os.609.3.S1_a_at Plastocyanin-like domain containing protein MI0001149, MI0001434 23
Os.6450.1.S1_at 1-deoxy-D-xylulose-5-phosphate synthase MI0001434 24
Os.10091.1.S1_at Long cell-linked locus protein MI0001147 25
Os.14921.1.S1_at Protein app1 MI0001704, MI0001705, MI0001706, MI0001718
26
Os.10255.1.S1_s_at F-box domain containing protein MI0001049 27
Os.24864.3.S1_at Acid phosphatase MI0001063
28
OS.14830.1.S1_A_AT Multicopper oxidase family protein MI0001050 29
OS.53763.1.A1_AT Leucine Rich Repeat family protein MI0001092, MI0001093 30
86 Chen et al.
Cell wall synthesis, secondary metabolism, and defense-related genes
Among the genes induced by grazing (Figure 3C), there are
also those involved in cell wall construction, modification,
cell wall expansion, maintenance of cell wall architecture, and cellulose degradation, such as alpha-expansin, endoglucanases, and class III peroxidases. Gene expression of several fungal cell wall polysaccharides degradation enzymes such as glucan endo-1,3-beta-glucosidase genes were considerably induced.
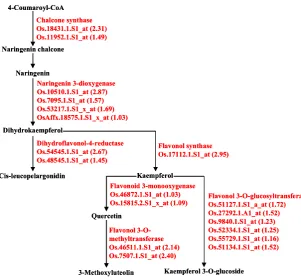
Genes encoding several enzymes involved in
the flavonoid biosynthetic pathways were significantly
induced after grazing (Figure 3C and Figure 5), including
two dihydroflavonol-4-reductase genes, one flavonol
synthase genes, four naringenin 3-dioxygenase
genes, two flavonoid 3-monooxygenase genes, two flavonol 3-O-methyltransferase genes, six flavonol
3-O-glucosyltransferase genes, and two chalcone synthase genes.
An esterase precursor, a protein involved in alkaloid
biosynthesis, was also significantly up-regulated (Figure
3C). Several cytochrome family genes which are involved
in secondary metabolite biosynthesis were also elevated (Figure 3C).
Grazing treatment enhanced the expressions of several protease inhibitor genes including Bowman-Birk type inhibitors (Figure 3C). Two late embryogenesis abundant genes (Figure 3C), also known as dehydrins were also strongly induced by grazing. Several defense -related enzymes, including regulatory protein NPR1, pathogenesis-related protein 1, and nematode-resistance protein were also induced by grazing (Figure 3C).
Carbohydrate metabolism
there were also pyruvate anaerobic metabolism pathway genes (Figure 3D), including those encoding enzymes of pyruvate dehydrogenase, aldehyde dehydrogenase, and L-lactate dehydrogenase. The metabolism pathways of these differential expression genes are shown in Figure 6.
In the RT-qPCR experiments during the 24 hours after grazing (Table 1, Figures 4), the gene expression levels remained up-regulated were the following carbohydrate metabolism enzymes: alpha-amylase (Os.10908.1.S1_a_ at), aldehyde dehydrogenase (Os.313.1.S1_a_at), glucan 1,3-beta-glucosidase (Os.7314.1.S1_at), trehalose-6-phosphate synthase (Os.21893.3.A1_at), pyruvate dehydrogenase (Os.19003.1.S1_a_at), and aldehyde dehydrogenase (Os.313.1.S1_a_at). The down-regulation was found for the genes encoding enzymes of glucose-1-phosphate adenylyltransferase (Os.4166.1.S1_at), granule-bound starch synthase 1b (Os.9212.1.S1_at), glucose-6-phosphate/phosphate translocator 2 (Os.47946.1.S1_s_at), 1,4-alpha-glucan branching enzyme (Os.4179.1.S1_at), lactate dehydrogenase (Os.10215.1.S1_at) and sugar transporter family protein gene (Os.21906.1.S1_at). Interaction between grazing and wounding or insect feeding
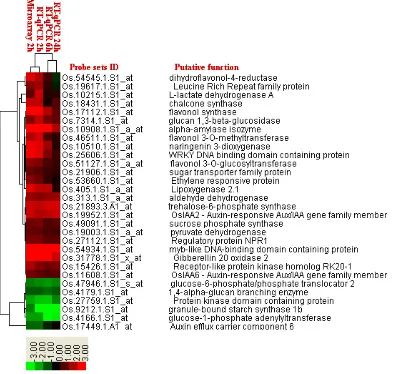
Grazing-induced genes in this study were compared to the genes induced by wounding (Lan et al., 2005) and insect feeding (Yuan et al., 2008) in rice. The genes responsive to grazing, wounding, or insect feeding were clustered and shown in Figure 7. A number of genes for metabolic enzymes, signal transduction and transcription factors, and defense-related genes were also induced by insect feeding. Some genes were induced by wounding but not by insect feeding such as peroxidase genes, cysteine synthase gene, proteasome, bZIP transcription factor, Myb-like DNA-binding
domain, DnaJ domain containing protein, etc. Some genes encoding WRKY transcription factor, Leucine Rich Repeat family protein, transporters, proteinase inhibitor, hydrolase, oxidoreductase, lipoxygenase, etc. were both induced by wounding and insect feeding.
Discussion
In grasslands, since the wounding, saliva depositing, and
defoliation occur during grazing as a joint process, this first
study focused on the integrated effects of the simulated grazing. Effects of each separated factor of the simulated grazing will be studied in the follow-up experiments and will be reported elsewhere.
The strong stimulation of grazing immediately activates genes involved in signal transduction, cell wall metabolism, secondary metabolism, biostress defense and carbohydrate metabolism, either related to the preparation of resistance to wounding and potential pathogen attacks or the seedling
regrowth. Genes responsive to grazing identified from rice
may serve as candidate genes for molecular physiological studies and genetic improvement of other grass species since rice shows great synteny and high sequence similarity with other cereal genomes (Goffet al., 2002).
Hormonal pathways related to regrowth or cellular functions
Two genes encoding AUX/IAA family proteins, OsIAA2 and OsIAA6, were activated by grazing (Figure 3B). It was reported that the expression of Aux/IAA proteins represses the auxin signaling through heterodimerization with auxin response factors (ARFs) (Liscum and Reed, 2002). The binding of these transcription factors to auxin-responsive elements (AuxREs) in promoters of primary auxin-response genes may activate or repress transcription (Hagen and 4-Coumaroyl-CoA
Naringenin chalcone Chalcone synthase Os.18431.1.S1_at (2.31) Os.11952.1.S1_at (1.49)
Naringenin
Naringenin 3-dioxygenase Os.10510.1.S1_at (2.87) Os.7095.1.S1_at (1.57) Os.53217.1.S1_x_at (1.69) OsAffx.18575.1.S1_x_at (1.03) Dihydrokaempferol
Dihydroflavonol-4-reductase Os.54545.1.S1_at (2.67) Os.48545.1.S1_at (1.45)
Cis-leucopelargonidin
Flavonol synthase Os.17112.1.S1_at (2.95)
Kaempferol
Kaempferol 3-O-glucoside
Flavonol 3-O-glucosyltransferase Os.51127.1.S1_a_at (1.72) Os.27292.1.A1_at (1.52) Os.9840.1.S1_at (1.23) Os.52334.1.S1_at (1.25) Os.55729.1.S1_at (1.16) Os.51134.1.S1_at (1.52) Flavonoid 3-monooxygenase
Os.46872.1.S1_at (1.03) Os.15815.2.S1_x_at (1.09) Quercetin
Flavonol 3-O-methyltransferase Os.46511.1.S1_at (2.14) Os.7507.1.S1_at (2.40)
3-Methoxyluteolin 4-Coumaroyl-CoA
Naringenin chalcone Chalcone synthase Os.18431.1.S1_at (2.31) Os.11952.1.S1_at (1.49)
Naringenin
Naringenin 3-dioxygenase Os.10510.1.S1_at (2.87) Os.7095.1.S1_at (1.57) Os.53217.1.S1_x_at (1.69) OsAffx.18575.1.S1_x_at (1.03) Dihydrokaempferol
Dihydroflavonol-4-reductase Os.54545.1.S1_at (2.67) Os.48545.1.S1_at (1.45)
Cis-leucopelargonidin
Flavonol synthase Os.17112.1.S1_at (2.95)
Kaempferol
Kaempferol 3-O-glucoside
Flavonol 3-O-glucosyltransferase Os.51127.1.S1_a_at (1.72) Os.27292.1.A1_at (1.52) Os.9840.1.S1_at (1.23) Os.52334.1.S1_at (1.25) Os.55729.1.S1_at (1.16) Os.51134.1.S1_at (1.52) Flavonoid 3-monooxygenase
Os.46872.1.S1_at (1.03) Os.15815.2.S1_x_at (1.09) Quercetin
Flavonol 3-O-methyltransferase Os.46511.1.S1_at (2.14) Os.7507.1.S1_at (2.40)
3-Methoxyluteolin
PDF !"# "pdfFactory Pro" $#%&'( www.fineprint.cn
Figure 5. A simplified scheme of the flavonoid biosynthesis pathway.
Enzymes encoded by genes that are induced by grazing at 2 h are in red. The expression difference (log2) between the control plants and the grazed plants is listed in brackets. Note: Genes that
are significantly induced in response to
88 Chen et al.
Guilfoyle, 2002). Auxin signaling in plants is involved in resistance to bacterial pathogens (Navarro et al., 2006). As part of a plant-induced immune response, bacterial pathogen-associated molecular pattern (PAMP) recognition down-regulates auxin signaling in Arabidopsis by targeting auxin receptor transcripts. These results indicate that decreasing plant auxin signaling can increase the resistance to bacterial pathogens (Navarroet al., 2006). These previous reports suggested that the up-regulated expressions of two Aux/IAA proteins (OsIAA2 and OsIAA6) might repress auxin signaling and increase the resistance to potential pathogens induced by wound under stimulated grazing. Wounding can repress auxin actions (Cheong et al., 2002) and cause IAA levels to decline (Thornburg and Li, 1991).
Ethylene participates in a variety of defense and abiotic stress responses (Ecker, 1995). In this study, the induction of genes that are involved in the ethylene biosynthetic pathway, such as 1-aminocyclopropane-1-carboxylate oxidase 1 may increase the ethylene level and subsequently activate ethylene response genes such as genes involved in senescence.
The gibberellin-20 oxidase gene up-regulated by grazing (Figure 3B) in rice seedling encodes a gibberellin-synthesis-required key enzyme that catalyzes the conversion of GA53 to GA20 via a three-step oxidation at C-20 of the GA skeleton. The upregulation of this gene suggests that grazing may increase gibberellin biosynthesis within two hours after grazing.
Stress- and defense-related gene expression
Many studies have also indicated that JA and its derivatives play an important role in the defense mechanism against different types of herbivores in Arabidopsis (McConn et al., 1997; Stintzi et al., 2001; Stotz et al., 2002; Reymond et al., 2004; Van Poecke and Dicke, 2004). Grazing-induced insect resistance cross-talks with the salicylic acid and jasmonic acid signal transduction pathways and the pathogen-induced systemic, acquired resistance (Felton et al., 1999). A regulatory protein NPR1 gene and a pathogenesis-related protein PRB1-3 gene were up-regulated in this study (Figure 3C). The expression of these genes have been previously reported to be upregulated after wounding in Arabidopsis (Zhang et al., 1999). NPR1 is a critical component of the salicylic acid (SA)-mediated signal transduction pathway leading to the induction of defense genes, such as the pathogenesis-related (PR-1) gene, and the enhancement of disease resistance (Zhou et al., 2000). Pathogenesis-related genes were also induced after wounding (Kim et al., 2005) and insects feeding (Figure 7) (Yuanet al., 2008) in rice and in Arabidopsis suspension cell cultures (Guan and Nothnagel, 2004).
Protease inhibitors are often induced by both herbivory and wounding. They are defense-related proteins that occur naturally in a wide range of plants and are considered to be an essential part in the plant direct defense against herbivores. A Bowman-Birk type protease inhibitor and a seed storage protease inhibitor responsive to grazing were also wounding-induced proteins (Figure 7). Most of
protease inhibitors identified in this study were also induced
ACETATE Glc-6-P Glc-1-P ADP-Glc Glucose-1-phosphate adenylyltransferase Os.4166.1.S1_at (-1.87) Starch synthase Os.9212.1.S1_at (-1.52) STARCH PLASTID GLUCOSE Alpha-amylase Os.10908.1.S1_a_at (3.60) Glc-6-P UDP-Glc G6P translocator Os.47946.1.S1_s_at (-1.44) SUCROSE Suc-6-P Sucrose-phosphate synthase Os.49091.1.S1_at (1.27) Fru-6-P PEP PYRUVATE ACETALDEHYDE Aldehyde dehydrogenase Os.313.1.S1_a_at (1.73) ACETYL-CoA L-lactate dehydrogenase Os.10215.1.S1_at (1.07) L-LACTATE Branching enzyme Os.4179.1.S1_at (-1.02) Pyruvate dehydrogenase Os.19003.1.S1_a_at (1.19) Suc Glc Fru VACUOLE Sugar transporter Os.21906.1.S1_at (1.16) ACETATE Glc-6-P Glc-1-P ADP-Glc Glucose-1-phosphate adenylyltransferase Os.4166.1.S1_at (-1.87) Starch synthase Os.9212.1.S1_at (-1.52) STARCH PLASTID GLUCOSE Alpha-amylase Os.10908.1.S1_a_at (3.60) Glc-6-P UDP-Glc G6P translocator Os.47946.1.S1_s_at (-1.44) SUCROSE Suc-6-P Sucrose-phosphate synthase Os.49091.1.S1_at (1.27) Fru-6-P PEP PYRUVATE ACETALDEHYDE Aldehyde dehydrogenase Os.313.1.S1_a_at (1.73) ACETYL-CoA L-lactate dehydrogenase Os.10215.1.S1_at (1.07) L-LACTATE Branching enzyme Os.4179.1.S1_at (-1.02) Pyruvate dehydrogenase Os.19003.1.S1_a_at (1.19) ACETATE Glc-6-P Glc-1-P ADP-Glc Glucose-1-phosphate adenylyltransferase Os.4166.1.S1_at (-1.87) Starch synthase Os.9212.1.S1_at (-1.52) STARCH PLASTID GLUCOSE Alpha-amylase Os.10908.1.S1_a_at (3.60) Glc-6-P UDP-Glc G6P translocator Os.47946.1.S1_s_at (-1.44) SUCROSE Suc-6-P Sucrose-phosphate synthase Os.49091.1.S1_at (1.27) Fru-6-P PEP PYRUVATE ACETALDEHYDE Aldehyde dehydrogenase Os.313.1.S1_a_at (1.73) ACETYL-CoA L-lactate dehydrogenase Os.10215.1.S1_at (1.07) L-LACTATE Branching enzyme Os.4179.1.S1_at (-1.02) Pyruvate dehydrogenase Os.19003.1.S1_a_at (1.19) Glc-6-P Glc-1-P ADP-Glc Glucose-1-phosphate adenylyltransferase Os.4166.1.S1_at (-1.87) Starch synthase Os.9212.1.S1_at (-1.52) STARCH PLASTID GLUCOSE Alpha-amylase Os.10908.1.S1_a_at (3.60) Glc-6-P UDP-Glc G6P translocator Os.47946.1.S1_s_at (-1.44) SUCROSE Suc-6-P Sucrose-phosphate synthase Os.49091.1.S1_at (1.27) Fru-6-P PEP PYRUVATE ACETALDEHYDE Aldehyde dehydrogenase Os.313.1.S1_a_at (1.73) ACETYL-CoA L-lactate dehydrogenase Os.10215.1.S1_at (1.07) L-LACTATE Branching enzyme Os.4179.1.S1_at (-1.02) Pyruvate dehydrogenase Os.19003.1.S1_a_at (1.19) Suc Glc Fru VACUOLE Sugar transporter Os.21906.1.S1_at (1.16) Suc Glc Fru VACUOLE Sugar transporter Os.21906.1.S1_at (1.16)
!"#
"pdfFactory Pro"
$#%&'(
www.fineprint.cn
by insect feeding (Figure 7). Genes encoding subtilisin-chymotrypsin inhibitor and metallothionein-like protein were found to exhibit rapidly and highly induced expression after insect feeding ( Yuan et al., 2005; Hua et al., 2007; Yuan et al., 2008), but down-regulated under grazing at 2h. Genes
either shared by multiple stresses or specific to the grazing
stress are subject to further investigation.
Plant cell walls play critical roles during the life cycle of a plant, including response to environmental stresses. In this study, a number of cell wall-related genes such as expansins and peroxidases were induced by grazing (Figure 3C). These genes are involved in cell wall construction,
modification, and maintenance of cell wall architecture.
Expansins are involved in cell wall expansion (Cosgrove et al., 2002). Peroxidases play a wide range of functions in removal of peroxides, oxidation of toxic reductants, biosynthesis and degradation of lignin, suberization, and auxin catabolism. The peroxidase gene expression activity was up-regulated in response to environmental stresses such as wounding (Figure 7) and pathogen attacks (Tognolli et al., 2002).
Cytochrome P450s participate in many biochemical pathways, such as those for the synthesis/metabolism of phenylpropanoids, alkaloids, terpenoids, lipids and involve in the protection of plant against environmental stresses.
P450 genes identified in this study can also activated by
wounding (Yang et al., 2005) and insects feeding (Yang et al., 2006). In the current study, several secondary metabolic
pathways, such as flavonoid and terpene pathways, were significantly induced after grazing. Flavonoids, synthesized
via the phenylpropanoid pathway, are a diverse group of secondary metabolites with a wide array of biological functions, including the defense against various stresses, such as pathogens, wounding, and UV light damage (Winkel-Shirley, 2002). Terpene synthase gene, indole-3-glycerol phosphate lyase gene, lipoxygenase gene, and phenylalanine ammonia-lyase gene induced by this study were involved in biosynthesis of plant volatiles of terpenoids, indole, fatty acid derivatives, and phenylpropanoids/ benzenoids. These genes were also responsive to insect feeding and/or wounding (Figure 7). Volatile terpenes are the most abundant armyworm induced volatile in rice (Yuan et al., 2008). Volatiles induced by cow saliva in plants need future investigation.
Signal transduction pathways target transcription factors and chromatin modifying factors leading to their phosphorylation by protein kinases or dephosphorylation in response to alterations in the environment. These
modifications influence transcription factor activities and
regulate gene expression networks, which results in appropriate changes in cell behavior (Hunter and Karin, 1992; Hill and Treisman, 1995). Grazing-induced activity changes of several signal transduction pathway genes such as protein kinases and many transcription factors such as AP2 and WRKY were observed in rice seedlings (Figure 3A). Most of these protein kinases and transcription factors were also reported to have response to insects feeding in rice (Figure 7). The C2H2-type zinc finger proteins represent a large and transcription factor family. These proteins play various roles in developmental processes. They also respond to multiple stresses including wounding, pathogen infection, and abiotic stresses and may be regulators in the ROS scavenging mechanism (Takatsuji, 1999; Davletova et Figure 7. Comparative cluster analysis of the genes induced
90 Chen et al.
al., 2005; Vogel et al., 2005). AP2 gene families and WRKY proteins have been reported to be induced by wounding, SA, JA, ethylene, and pathogen attack (Rushton et al., 1996; Eulgem et al., 2000; Maleck et al., 2000; Schenk et al., 2000).
Among grazing induced genes, thirteen genes were found to be the targets of known miRNA (Table 2). These genes involved in signal transduction, transcription factor, and stress defense. It has been reported that miRNAs can be induced by environmental stress (Jones-Rhoades and Bartel, 2004; Sunkar and Zhu, 2004), suggesting that miRNAs may play an important role in regulating plant response to grazing.
Carbohydrate metabolism
The stimulation of genes involved in starch degradation detected in this study can be interpreted by the following hypothesis: the energy and sugar demand in sink tissues, such as the roots, took some time before it slowed down to a balanced level. The tissues met this demand by stimulating
starch degradation within the first 2 hours after grazing.
Twenty-four hours after grazing, the sucrose transporter was no longer upregulated, which may suggest that the sink demand slowed down and sucrose transporter proteins had reached their balanced requirement.
Starch degradation can be either through starch phosphorylases or amylases, depending on the plants and conditions. Starch phosphorylases are responsible for starch degradation in stored potato tubers (Sowokinos, 2001). However, enhanced alpha-amylase gene expression has been reported in rice cell culture (Ho et al., 2001), water-stressed barley leaves (Jacobsen et al., 1986), virus-infected tobacco leaves (Heitz et al., 1991), and wounded mung bean cotyledons (Koizuka et al., 1995). The
microarray-based findings in the rice seedling in this study
also indicated that starch degradation in the rice leaves after grazing was through the alpha amylase pathway, not the starch phosphorylase pathways (Figure 6).
The immediate reduction in expression of genes involved in the starch synthesis pathways as well as glucose-phosphate transporters suggested that the supply of starch synthesis-required energy and substrates was suddenly reduced by grazing off the mature leaf blades (Figure 6). This result might suggest that the immature leaves at the
3- to 4-leaf stage in non-clipped rice seedlings not only use translocated sucrose for growth but also use some of the
over-flowed sucrose from the top leaves to conduct starch synthesis. To the best of our knowledge, this finding has not
been previously reported in plants.
Grazing suddenly reduce the stomata uptake of oxygen at the plant level because of the sudden removal of most leaf blades that were rich in stomata on the surfaces. This reduction of oxygen uptake might limit the
power of mitochondria to emergently produce sufficient
energy for the plants. Therefore, the up-regulation of the anaerobic respiration pathway observed in this study is likely an emergency approach for the seedlings to meet the demand for providing essential energy after the sudden loss of photosynthetic leaves. This result is intriguing and may suggest a positive role of anaerobic respiration for aboveground non-water-stressed leafy tissues.
The lactate dehydrogenase was up-regulated at 2h, then declined at 6h and 24h, while the aldehyde dehydrogenase remained up-regulated during the 24-hour period (Table 1, Figure 4). These results suggest that the aldehyde dehydrogenase pathway is the main anaerobic respiration pathway in rice seedlings under grazing-induced stress, but the relatively more toxic aldehyde dehydrogenase pathway can be also needed when there is a sudden loss of energy supply.
This study focuses on identifying genes and pathways in early response to grazing. Further studies may be needed to investigate other factors such as grazing intervals, effects of different animals, saliva types, teeth sharpness, grazing severity, clipping methods, seedling stages, grass species, and grass growing conditions.
Conclusions
This study illustrated that grazing caused the rice seedlings
to immediately adjust their gene expression profile within
two hours. In the aboveground tissues, gene expression data suggest that starch synthesis in the seedlings slowed down, while starch degradation increased. Sucrose synthesis and transportation immediately enhanced likely due to the demand for sugars in the sink from the remained tissues, and then likely due to the re-growth of the shoot. Anaerobic respiration pathways were enhanced in leafy tissues in the air without obvious anoxic stress, likely in
23 Os.47946.1.S1_s_at / glucose-6-phosphate/phosphate Starch and sucrose metabolism Group IV -1.43 -1.64 -1.79 -1.60 1
translocator 2 2
Os.49091.1.S1_at / sucrose phosphate synthase Starch and sucrose metabolism Group IV 1.27 1.48 0.95 1.10 3
Os.21893.3.A1_at / trehalose-6-phosphate synthase Starch and sucrose metabolism Group IV 2.45 2.23 2.49 2.55 4
Os.9212.1.S1_at / granule-bound starch synthase 1b Starch and sucrose metabolism -1.51 -2.94 -3.84 -3.47 5
Os.4166.1.S1_at / glucose-1-phosphate Starch and sucrose metabolism Group IV -1.89 -1.89 -3.18 -2.84 6
adenylyltransferase 7
Os.10908.1.S1_a_at / alpha-amylase isozyme Starch and sucrose metabolism Group IV 3.60 4.56 3.32 2.06 8
Os.10215.1.S1_at / L-lactate dehydrogenase A Pyruvate metabolism Group IV 1.06 2.43 0.46 0.43 9
Os.19003.1.S1_a_at / pyruvate dehydrogenase Pyruvate metabolism Group IV 1.18 1.08 0.95 0.79 10
Os.313.1.S1_a_at / aldehyde dehydrogenase Pyruvate metabolism Group IV 1.73 1.53 1.71 1.90 11
Os.21906.1.S1_at / sugar transporter family protein Transport Group IV 1.16 1.01 0.69 0.51 12
13 14
Table 2: Known micro-RNA and its target genes responsive to grazing.
15
16
Probe sets ID Gene product Known micro-RNA accession
17
18
Os.23468.1.A1_at Avr9 elicitor response protein MI0001050
19
Os.50455.1.S1_at Phospholipase D alpha 2 MI0001439
20
Os.36152.1.S1_at Zinc finger, C2H2 type family protein MI0001434
21
Os.11608.1.S1_at OsIAA6 - Auxin-responsive Aux/IAA gene family member MI0001149
22
Os.609.3.S1_a_at Plastocyanin-like domain containing protein MI0001149, MI0001434
23
Os.6450.1.S1_at 1-deoxy-D-xylulose-5-phosphate synthase MI0001434
24
Os.10091.1.S1_at Long cell-linked locus protein MI0001147
25
Os.14921.1.S1_at Protein app1 MI0001704, MI0001705, MI0001706, MI0001718
26
Os.10255.1.S1_s_at F-box domain containing protein MI0001049
27
Os.24864.3.S1_at Acid phosphatase MI0001063
28
OS.14830.1.S1_A_AT Multicopper oxidase family protein MI0001050
29
OS.53763.1.A1_AT Leucine Rich Repeat family protein MI0001092, MI0001093
response to emergency demand for the supply of energy/ substrates. Gene expression data favors the possibility that there is starch synthesis in the immature leaves or the lower leaf portion in non-clipped rice seedlings using some of the
over-flowed sucrose from the full functional leaf blades.
The activity of signal transduction and hormone pathways suggest that both wound-related recovery and many abiotic stress pathway-shared genes are stimulated in grazed plants. Many genes induced by simulated grazing are shared by wound response and insect feeding response. This provides us a clue that animal feeding and insects feeding may have some common response mechanism in
plants. The genes and pathways with significantly modified
expression activities detected in this study but not shared with wounding or insect-feeding may represent
grazing-specific genes and may provide insights into the plant specific response to grazing.
Acknowledgements
We are grateful to Man Su and Zhipeng Liu for their assistance in this research, Professor Shihua Shen for
his useful discussion and Rebecca Griffiths for her critical
reading of the manuscript. This research was supported by the National Basic Research Program of China (973, 2007CB108905), Natural Science Foundation of China (No. 30600370 and 30500106), and the Key Project of the Chinese Academy of Sciences (KSCX2-YW-N-50).
References
Agarwal, S., and Grover, A. (2006) Molecular biology,
biotechnology and genomics of flooding-associated low O2
stress response in plants. Crit. Rev. Plant Sci. 25, 1-21. Belesky, D. P., and Hill, N. S. (1997) Defoliation and leaf
age influence on ergot alkaloids in tall fescue. Ann. Bot.
79, 259-264.
Brueland, B. A., Harmoney, K. R., Moore, K. J., George, J. R., and Brummer, E. C. (2003) Forage and grazing lands: Developmental morphology of smooth bromegrass growth following spring grazing. Crop Sci. 43, 1789-1796. Cheong, Y. H., Chang, H.-S., Gupta, R., Wang, X., Zhu, T.,
and Luan, S. (2002) Transcriptional profiling reveals novel
interactions between wounding, pathogen, abiotic stress, and hormonal responses in Arabidopsis. Plant Physiol. 129, 661-677.
Cosgrove, D. J., Li, L. C., Cho, H. T., Hoffmann-Benning, S., Moore, R. C., and Blecker, D. (2002) The growing world of expansins. Plant Cell Physiol. 43, 1436-1444.
Crawley, M. J. (1990) Rabbit grazing, plant competition and seedling recruitment in acid grassland. J. Appl. Ecol. 27, 803-820.
Davletova, S., Schlauch, K., Coutu, J., and Mittler, R. (2005)
The zinc-finger protein Zat12 plays a central role in reactive
oxygen and abiotic stress signaling in Arabidopsis. Plant Physiol. 139, 847-856.
De Vos, M., Van Oosten, V. R., Van Poecke, R. M. P., Van Pelt, J. A., Pozo, M. J., Mueller, M. J., Buchala, A. J., Métraux, J. P., Van Loon, L. C., Dicke, M., and Pieterse, C. M. J. (2005) Signal signature and transcriptome changes of Arabidopsis during pathogen and insect attack. Mol. Plant-Microbe Interact. 18, 923-937.
Del-Val, E., and Crawley, M. J. (2005) Are grazing increaser species better tolerators than decreasers? An experimental assessment of defoliation tolerance in eight British
grassland species. J. Ecol. 93, 1005-1016.
Detling, J. K., Dyer, M. I., and Winn, D. T. (1979) Net photosynthesis, root respiration, and regrowth of Bouteloua gracilis following simulated grazing. Oecologia 41, 127-134.
Donaghy, D. J., and Fulkerson, W. J. (2002) The impact of defoliation frequency and nitrogen fertilizer application in spring on summer survival of perennial ryegrass under grazing in subtropical Australia. Grass Forage Sci. 57, 351-359.
Ecker, J. R. (1995) The ethylene signal transduction pathway in plants. Science 268, 667-675.
Eulgem, T., Rushton, P. J., Robatzek, S., and Somssich, I. E. (2000) The WRKY superfamily of plant transcription factors. Trends Plant Sci. 5, 199-206.
Felton, G. W., Bi, J. L., Mathews, M. C., Murphy, J. B., Korth, K., Wesley, S. V., Lamb, C., and Dixon, R. A. (1999) Cross-talk between the signal pathways for pathogen-induced systemic acquired resistance and grazing-induced insect resistance. In Novartis Foundation Symposium, Vol 223, pp 166-174.
Gibson, G. (2002) Microarrays in ecology and evolution: a preview. Mol. Ecol. 11, 17-24.
Givan, C. V. (1999) Evolving concepts in plant glycolysis: Two centuries of progress. Biol. Rev. Camb. Phil. Soc. 74, 277-309.
Goff, S. A., Ricke, D., Lan, T. H., Presting, G., Wang, R., Dunn, M., Glazebrook, J., Sessions, A., Oeller, P., Varma, H., Hadley, D., Hutchison. D., Martin. C., Katagiri. F., Lange, B.M., Moughamer, T., Xia, Y., Budworth, P., Zhong, J., Miguel, T., Paszkowski, U., Zhang, S., Colbert, M., Sun, W.L., Chen, L., Cooper, B., Park, S., Wood, T.C., Mao, L., Quail, P., Wing, R., Dean, R., Yu, Y., Zharkikh, A., Shen, R., Sahasrabudhe, S., Thomas, A., Cannings, R., Gutin, A., Pruss, D., Reid, J., Tavtigian, S., Mitchell, J., Eldredge, G., Scholl, T., Miller, R.M., Bhatnagar, S., Adey, N., Rubano, T., Tusneem, N., Robinson, R., Feldhaus, J., Macalma, T., Oliphant, A., and Briggs, S. (2002) A draft sequence of the rice genome (Oryza sativa L. ssp. japonica). Science 296, 92-100.
Goffard, N., and Weiller, G. (2007) GeneBins: A database for classifying gene expression data, with application to plant genome arrays. BMC Bioinfo. 8, 87.
Gold, W. G., and Caldwell, M. M. (1990) The effects of the spatial pattern of defoliation on regrowth of a tussock grass - III. Photosynthesis, canopy structure and light interception. Oecologia 82, 12-17.
Guan, Y., and Nothnagel, E. A. (2004) Binding of Arabinogalactan Proteins by Yariv Phenylglycoside Triggers Wound-Like Responses in Arabidopsis Cell Cultures. Plant Physiol. 135, 1346-1366.
Hagen, G., and Guilfoyle, T. (2002) Auxin-responsive gene expression: Genes, promoters and regulatory factors. Plant Mol. Biol. 49, 373-385.
Heitz, T., Geoffroy, P., Fritig, B., and Legrand, M. (1991) Two
apoplastic α-amylases are induced in tobacco by virus
infection. Plant Physiol. 97, 651-656.
Hill, C. S., and Treisman, R. (1995) Transcriptional regulation
by extracellular signals: Mechanisms and specificity. Cell
80, 199-211.
92 Chen et al.
network and multiple control mechanisms. Plant Physiol. 125, 877-890.
Hua, H., Lu, Q., Cai, M., Xu, C., Zhou, D. X., Li, X., and Zhang, Q. (2007) Analysis of rice genes induced by striped
stemborer (Chilo suppressalis) attack identified a promoter fragment highly specifically responsive to insect feeding.
Plant Mol. Biol. 65, 519-530.
Hunter, T., and Karin, M. (1992) The regulation of transcription by phosphorylation. Cell 70, 375-387.
Jacobsen, J. V., Hanson, A. D., and Chandler, P. C. (1986) Water stress enhances expression of an a-amylase gene in barley leaves. Plant Physiol. 80, 350-359.
Jauregui, B. M., Celaya, R., Garcia, U., and Osoro, K. (2007) Vegetation dynamics in burnt heather-gorse shrublands under different grazing management with sheep and goats. Agroforest. Sys. 70, 103-111.
Jones-Rhoades, M. W., and Bartel, D. P. (2004) Computational
identification of plant MicroRNAs and their targets, including
a stress-induced miRNA. Mol. Cell 14, 787-799.
Kato-Noguchi, H., Ohashi, C., and Sasaki, R. (2003)
Metabolic adaptation to flooding stress in upland and
lowland rice seedlings. Acta Physiol. Plant. 25, 257-261. Kim, K. M., Cho, S. K., Shin, S. H., Kim, G. T., Lee, J. H., Oh,
B. J., Kang, K. H., Hong, J. C., Choi, J. Y., Shin, J. S., and Chung, Y. S. (2005) Analysis of differentially expressed transcripts of fungal elicitor- and wound-treated wild rice (Oryza grandiglumis). J. Plant Res. 118, 347-354. Koizuka, N., Tanaka, Y., and Morohashi, Y. (1995) Expression
of alpha-amylase in response to wounding in mung bean. Planta 195, 530-534.
Kursteiner, O., Dupuis, I., and Kuhlemeier, C. (2003) The Pyruvate decarboxylase1 gene of Arabidopsis is required during anoxia but not other environmental stresses. Plant Physiol. 132, 968-978.
Lan, L., Li, M., Lai, Y., Xu, W., Kong, Z., Ying, K., Han, B., and Xue, Y. (2005) Microarray analysis reveals similarities and variations in genetic programs controlling pollination/ fertilization and stress responses in rice (Oryza sativa L.). Plant Mol. Biol. 59, 151-164.
Li, C., and Wong, W. H. (2001) Model-based analysis of oligonucleotide arrays: Expression index computation and outlier detection. Proc. Natl. Acad. Sci. U. S. A. 98, 31-36.
Li, C., and Wong, W. H. (2001) Model-based analysis of oligonucleotide arrays: model validation, design issues and standard error application. Genome biol. 2
Liscum, E., and Reed, J. W. (2002) Genetics of Aux/IAA and ARF action in plant growth and development. Plant Mol. Biol. 49, 387-400.
Maleck, K., Levine, A., Eulgem, T., Morgan, A., Schmid, J., Lawton, K. A., Dangl, J. L., and Dietrich, R. A. (2000) The transcriptome of Arabidopsis thaliana during systemic acquired resistance. Nat. Genet. 26, 403-410.
McConn, M., Creelman, R. A., Bell, E., Mullet, J. E., and Browse, J. (1997) Jasmonate is essential for insect defense in Arabidopsis. Proc. Natl. Acad. Sci. U. S. A. 94, 5473-5477.
McPherson, K., and Williams, K. (1998) The role of carbohydrate reserves in the growth, resilience, and persistence of cabbage palm seedlings (Sabal palmetto). Oecologia 117, 460-468.
Meers, T., and Adams, R. (2003) The impact of grazing by Eastern Grey Kangaroos (Macropus giganteus) on
vegetation recovery after fire at Reef Hills Regional Park,
Victoria. Ecol. Manage. Rest. 4, 126-132.
Moran, P. J., Cheng, Y., Cassell, J. L., and Thompson, G. A.
(2002) Gene expression profiling of Arabidopsis thaliana in
compatible plant-aphid interactions. Arch. Insect Biochem. Physiol. 51, 182-203.
Navarro, L., Dunoyer, P., Jay, F., Arnold, B., Dharmasiri, N., Estelle, M., Voinnet, O., and Jones, J. D. G. (2006) A plant miRNA contributes to antibacterial resistance by repressing auxin signaling. Science 312, 436-439.
Nowak, R. S., and Caldwell, M. M. (1984) A test of
compensatory photosynthesis in the field: Implications for
herbivory tolerance. Oecologia 61, 311-318.
Orodho, A. B., and Trlica, M. J. (1990) Clipping and long-term grazing effects on biomass and carbohydrate reserves of Indian ricegrass. J. Range Manage. 43, 52-57.
Pecetti, L., and Piano, E. (2002) Penetrance of creeping-rootedness in clonal progenies of lucerne and observations on underground morphology of plants differing for this character. Euphytica 128, 35-45.
Reymond, P., Bodenhausen, N., Van Poecke, R. M. P., Krishnamurthy, V., Dicke, M., and Farmer, E. E. (2004) A conserved transcript pattern in response to a specialist and a generalist herbivore. Plant Cell 16, 3132-3147.
Reymond, P., Weber, H., Damond, M., and Farmer, E. E. (2000) Differential gene expression in response to mechanical wounding and insect feeding in Arabidopsis. Plant Cell 12, 707-719.
Rushton, P. J., Torres, J. T., Parniske, M., Wernert, P., Hahlbrock, K., and Somssich, I. E. (1996) Interaction of elicitor-induced DNA-binding proteins with elicitor response elements in the promoters of parsley PR1 genes. EMBO J. 15, 5690-5700.
Schenk, P. M., Kazan, K., Wilson, I., Anderson, J. P., Richmond, T., Somerville, S. C., and Manners, J. M. (2000) Coordinated plant defense responses in Arabidopsis revealed by microarray analysis. Proc. Natl. Acad. Sci. U. S. A. 97, 11655-11660.
Sowokinos, J. R. (2001) Biochemical and molecular control of cold-induced sweetening in potatoes. Am. J. Potato Res. 78, 221-236.
Stintzi, A., Weber, H., Reymond, P., Browse, J., and Farmer, E. E. (2001) Plant defense in the absence of jasmonic acid: The role of cyclopentenones. Proc. Natl. Acad. Sci. U. S. A. 98, 12837-12842.
Stotz, H. U., Koch, T., Biedermann, A., Weniger, K., Boland, W., and Mitchell-Olds, T. (2002) Evidence for regulation of resistance in Arabidopsis to Egyptian cotton worm by salicylic and jasmonic acid signaling pathways. Planta 214, 648-652.
Sunkar, R., and Zhu, J. K. (2004) Novel and stress regulated microRNAs and other small RNAs from Arabidopsis w inside box sign. Plant Cell 16, 2001-2019.
Takatsuji, H. (1999) Zinc-finger proteins: The classical zinc finger emerges in contemporary plant science. Plant Mol.
Biol. 39, 1073-1078.
Thornburg, R. W., and Li, X. (1991) Wounding Nicotiana tabacum leaves causes a decline in endogenous indole-3-acetic acid. Plant Physiol. 96, 802-805.
Tognolli, M., Penel, C., Greppin, H., and Simon, P. (2002) Analysis and expression of the class III peroxidase large gene family in Arabidopsis thaliana. Gene 288, 129-138.
analysis of microarrays applied to the ionizing radiation response. Proc. Natl. Acad. Sci. U. S. A. 98, 5116-5121. Van Poecke, R. M. P., and Dicke, M. (2004) Indirect defence
of plants against herbivores: Using Arabidopsis thaliana as a model plant. Plant Biol. 6, 387-401.
Voelckel, C., Weisser, W. W., and Baldwin, I. T. (2004) An analysis of plant-aphid interactions by different microarray hybridization strategies. Mol. Ecol. 13, 3187-3195. Vogel, J. T., Zarka, D. G., Van Buskirk, H. A., Fowler, S.
G., and Thomashow, M. F. (2005) Roles of the CBF2
and ZAT12 transcription factors in configuring the low
temperature transcriptome of Arabidopsis. Plant J. 41, 195-211.
Vourch', G., Russell, J., and Martin, J. L. (2002) Linking deer browsing and terpene production among genetic identities in Chamaecyparis nootkatensis and Thuja plicata (Cupressaceae). Journal of Heredity 93(5), 370-376.
Winkel-Shirley, B. (2002) Biosynthesis of flavonoids and
effects of stress. Curr. Opin. Plant Biol. 5, 218-223. Yang, D. H., Chung, B. Y., Kim, J. S., Kim, J. H., Yun, P. Y.,
Lee, Y. K., Lim, Y. P., and Lee, M. C. (2005) cDNA cloning and sequence analysis of the rice cinnamate-4-hydroxylase gene, a cytochrome P450-dependent monooxygenase involved in the general phenylpropanoid pathway. J. Plant Biol. 48, 311-318.
Yang, Z., Zhang, F., Zhu, L., and He, G. (2006) Identification
of differentially expressed genes in brown planthopper Nilaparvata lugens (Hemiptera: Delphacidae) responding to host plant resistance. Bull. Entomol. Res. 96, 53-59.
Yuan, H., Chen, X., Zhu, L., and He, G. (2005) Identification
of genes responsive to brown planthopper Nilaparvata lugens Stål (Homoptera: Delphacidae) feeding in rice. Planta 221, 105-112.
Yuan, J. S., Köllner, T. G., Wiggins, G., Grant, J., Degenhardt, J., and Chen, F. (2008) Molecular and genomic basis of volatile-mediated indirect defense against insects in rice. Plant J. 55, 491-503.
Zhang, Y., Fan, W., Kinkema, M., Li, X., and Dong, X. (1999) Interaction of NPR1 with basic leucine zipper protein transcription factors that bind sequences required for salicylic acid induction of the PR-1 gene. Proc. Natl. Acad. Sci. U. S. A. 96, 6523-6528.
Zhou, J. M., Trifa, Y., Silva, H., Pontier, D., Lam, E., Shah, J., and Klessig, D. F. (2000) NPR1 differentially interacts with members of the TGA/OBF family of transcription factors that bind an element of the PR-1 gene required for induction by salicylic acid. Mol. Plant-Microbe Interact. 13, 191-202.
y = 0.8636x + 0.2351
R
2= 0.9329
-3
-2
-1
0
1
2
3
4
5
-4
-3
-2
-1
0
1
2
3
4
5
RT-qPCR log2 ratio
Mi
cr
oa
rr
a
y
lo
g2
r
at
io
!"#
"pdfFactory Pro"
$#%&'(
www.fineprint.cn
Supplemental Material94 Chen et al.
25
Supplemental Material
1
Table S1: Genes and primers used in RT-qPCR analysis.
2
3
Probe sets ID Gene Product Forward Primer (5'-3') Reverse Primer (5'-3') 4
5
Os.25606.1.S1_at WRKY DNA binding domain protein CAAGAAGAGGAGCAGGGAGA CATTGGTACCCGTCCTTGAC 6
Os.54934.1.S1_at Myb-like DNA-binding domain protein TGAGGAGGAGCACAGGCTAT CAGTGATGTCGTGGATGCTC 7
Os.27759.1.S1_at Protein kinase domain containing protein TGAGCTGTACGGTTCGACGGT ACATCATCTGTCGGCGAGCC 8
Os.15426.1.S1_at Receptor-like protein kinase homolog RK20-1 TCCTCAATGGCACGACGATG TCTCTCGTCCCGGCGTGGCC 9
Os.19617.1.S1_at Leucine Rich Repeat family protein CGCTCACTCGGTTTCGTTCAG ACGGTGCACCACAAAGCCTT 10
Os.19952.1.S1_at OsIAA2 - Auxin-responsive Aux/IAA gene GTCATCGTCGTCCAAGCAG CGCCGTCCATGTTGATCT 11
family member 12
Os.11608.1.S1_at OsIAA6 - Auxin-responsive Aux/IAA gene GTGGAGGAAATGATAGCAGCCG TCTTCCCTGGGTCTGTGGTCTG 13
family member 14
Os.17449.1.A1_at Auxin efflux carrier component 6 ATCTTCACGAGGGAGCAGTGCG TTCACCTGGAACGGGTCGGT 15
Os.31778.1.S1_x_at Gibberellin 20 oxidase 2 AGAGCCCGGCCAAATACTGG ACAGCAACCTCATCAGCCGC 16
Os.53660.1.S1_at Ethylene responsive protein AATCCGGCGTCGAGAGAGGT ACCATGTCCTCGGCGTCGTT 17
Os.405.1.S1_a_at Lipoxygenase 2.1 CCACTGCAACTCTTGGATCG TGCGCAGATTCTTCACGC 18
Os.27112.1.S1_at Regulatory protein NPR1 CCCACAACTCGGAGAAGC CGGAAACATAATCCTCGCC 19
Os.54545.1.S1_at Dihydroflavonol-4-reductase CCCTCGCAGTACCAAGTACA GATCGAGAGGAGTCCAGCAT 20
Os.17112.1.S1_at Flavonol synthase CGCTGGCCTTCTTCTACAAC GGTTGCCATCTGCTGAGACT 21
Os.10510.1.S1_at Naringenin 3-dioxygenase GTTCTCAAGGAAGGCAGGTG CATCGGTGATGAGCTTCTGA 22
Os.46511.1.S1_at flavonol 3-O-methyltransferase ATGATGCCAAGGATGGTAGC GGGAGATCCAAAACCGTACA 23
Os.18431.1.S1_at chalcone synthase TACTACCTCGTGCCGGTCTC TCACCTTGGTCATGAACTCC 24
Os.51127.1.S1_a_at flavonol 3-O-glucosyltransferase GTGGCTTCCACATCACCTTC AAGTGAGGGAGGCACGTCT 25
Os.7314.1.S1_at Glucan 1,3-beta-glucosidase ACAAGTGGGCTAAACGCAGT ACTGTGCTCAAACGGGTTCT 26
Os.4179.1.S1_at 1,4-alpha-glucan branching enzyme GATGTTGTTCACAGCCATGC TACTCCTCGAGCCACCATCT 27
Os.47946.1.S1_s_at Glucose-6-phosphate/phosphate translocator 2 GCCAAGATCGGGGTCTACTT GACAGGGCCTTCCAGAAATC 28
Os.49091.1.S1_at sucrose phosphate synthase ATCGTTGTCGAGGAGACAGC AATCCATAACTTCCCGAGCA 29
Os.21893.3.A1_at trehalose-6-phosphate synthase CGAAACAACTGATGGGTCCT CCTTGCTAACTCCCTGTGGT 30
Os.9212.1.S1_at Granule-bound starch synthase 1b GTCGAGTGCGAAACTGTTGA CTTGAGCCATGCAGTTCTGA 31
Os.4166.1.S1_at Glucose-1-phosphate adenylyltransferase TGGGAAGACATTGGAACGAT CGATGGTACATTCACGCAAG 32
Os.10908.1.S1_a_at Alpha-amylase isozyme GTGAAGATCGGGACGAGGTA CCTTCTCCCAGACGCTGTAG 33
26
Os.10215.1.S1_at L-lactate dehydrogenase GATGTCCAGGCGTACATGG GAAGCTCTGGTGGCTCTCC
1
Os.19003.1.S1_a_at Pyruvate dehydrogenase CACACTCTCCACACCAGCAG CCCCTTCCCTCCAGTAACTC
2
Os.313.1.S1_a_at Aldehyde dehydrogenase GGCGAGCAATTCAAGAAGAT AGACGGTTGGCTGGATGTAG
3
Os.21906.1.S1_at Sugar transporter family protein CGTGAACCAGTTGTCCGTTA TCAAACCCCCTCAAAACTTG
4
Os03g0718100 actin (as RT-qPCR internal control) ATGGAGACTGCCAAGACCAG AAGGAAGGCTGGAAGAGGAC
5 6
Table S1. Genes and primers used in RT-qPCR analysis.
Table S2. Differential expression genes in response to stimulated grazing at 2h detected by microarray analysis (Attached MS
Excel file). The list includes 376 up-regulated genes with log2 (ratio) ≥1 (2-fold change) and 90 down-regulated genes with log2 (ratio) ≤-1 (0.5-fold change).
Probe sets ID Fold log2 Locus ID Putative function
change ratio
OS.1478.1.S1_AT 0.03 -4.87 LOC_Os03g19436.1 Nicotianamine synthase 1
Os.51491.1.S1_at 0.07 -3.89 LOC_Os11g21970.1 transposon protein, putative, CACTA, En/Spm sub-class Os.409.1.S1_at 0.10 -3.35 LOC_Os07g15460 Metal transporter Nramp1
OS.9311.1.S1_AT 0.11 -3.14 LOC_Os03g19420 Nicotianamine synthase 2
Os.12498.1.S1_at 0.12 -3.10 LOC_Os01g72370.2 Helix-loop-helix DNA-binding domain containing protein Os.26063.1.S1_at 0.12 -3.01 LOC_Os12g43060 retrotransposon protein
Os.49111.1.S1_at 0.13 -2.92 LOC_Os04g48930 ferric-chelate reductase Os.16044.1.S1_at 0.14 -2.82 LOC_Os02g30910 nodulin MtN3 family protein Os.14921.1.S1_at 0.18 -2.48 LOC_Os03g56930 expressed protein Os.12629.1.S2_at 0.19 -2.38 LOC_Os03g64140.1 expressed protein
Os.54370.1.S1_at 0.21 -2.23 LOC_Os03g48750 Oxalate oxidase GF-2.8 precursor Os.4978.1.S2_at 0.23 -2.10 LOC_Os03g54000 oligopeptide transporter 3
Os.6330.1.S1_at 0.23 -2.10 LOC_Os03g07180 Late embryogenesis abundant protein OS.2821.1.A1_AT 0.26 -1.96 LOC_Os02g02210 aminotransferase, class III family protein Os.27759.1.S1_at 0.26 -1.94 LOC_Os01g46720 Protein kinase domain containing protein
Os.9216.1.S1_at 0.26 -1.92 LOC_Os03g26210 Helix-loop-helix DNA-binding domain containing protein
OS.51718.1.S1_AT 0.26 -1.92 LOC_Os11g26780 Dehydrin RAB 16B
Os.11150.1.S1_at 0.27 -1.90 LOC_Os03g32490 expressed protein
Os.4166.1.S1_at 0.27 -1.87 LOC_Os05g50380 Glucose-1-phosphate adenylyltransferase
Os.54698.1.S1_at 0.28 -1.83 LOC_Os03g51540 Lariat debranching enzyme, C-terminal domain containing protein Os.32686.1.S1_at 0.28 -1.82 LOC_Os01g65110 POT family protein
Os.52323.1.S1_at 0.30 -1.73 LOC_Os12g15000 retrotransposon protein, putative, Ty1-copia subclass Os.12551.1.S1_s_at 0.30 -1.72 LOC_Os05g46480 Late embryogenesis abundant protein
OS.11491.1.S1_AT 0.30 -1.72 LOC_Os03g19290 mitochondrial import inner membrane translocase subunit Tim17/Tim22/Tim23 family protein
Os.27943.1.S1_a_at 0.31 -1.71 LOC_Os01g50030 Phosphoethanolamine N-methyltransferase Os.55575.1.S1_at 0.31 -1.71 LOC_Os05g02200 33 kDa secretory protein
Os.55380.1.S1_at 0.31 -1.68 LOC_Os06g46740 early nodulin 20 precursor Os.27606.1.S1_at 0.32 -1.66 LOC_Os03g63330 Aspartate kinase family protein Os.12633.1.S1_s_at 0.32 -1.65 LOC_Os11g26790 Dehydrin family protein Os.52298.1.S1_at 0.32 -1.64 LOC_Os06g02960 expressed protein
Os.50950.1.S1_x_at 0.33 -1.61 LOC_Os02g44730 tetracycline transporter protein Os.28427.1.S2_a_at 0.33 -1.61 LOC_Os05g12640 polygalacturonase
Os.55671.1.S1_at 0.33 -1.60 LOC_Os06g44250 Haemolysin-III related family protein Os.30528.1.S1_at 0.33 -1.59 LOC_Os08g31860 expressed protein
OsAffx.10755.1.S1_at 0.33 -1.59 LOC_Os03g46454.1 zinc transporter 10 precursor Os.17916.1.S1_at 0.33 -1.58 LOC_Os05g12630 expressed protein
OS.9417.1.S1_AT 0.34 -1.57 LOC_Os09g36680 Ribonuclease T2 family protein Os.9212.1.S1_at 0.35 -1.52 LOC_Os07g22930 granule-bound starch synthase 1b
OSAFFX.18737.1.S1_AT 0.35 -1.50 ---
---OSAFFX.25073.1.S1_X_AT 0.36 -1.48 LOC_Os03g12700 expressed protein
OS.34112.1.S1_AT 0.36 -1.47 LOC_Os04g12700 retrotransposon protein, putative, Ty1-copia subclass Os.49571.1.S1_at 0.37 -1.45 LOC_Os03g15530 expressed protein
Os.21957.1.S1_at 0.37 -1.45 LOC_Os10g02260 POT family protein Os.10091.1.S1_at 0.37 -1.45 LOC_Os03g19070 long cell-linked locus protein
Os.47946.1.S1_s_at 0.37 -1.44 LOC_Os07g33910 Glucose-6-phosphate/phosphate translocator 2 Os.12629.1.S1_at 0.37 -1.44 LOC_Os02g49650.1 expressed protein
OS.12761.1.S1_AT 0.38 -1.41 LOC_Os03g46060 P21 protein
Os.7767.1.S1_at 0.38 -1.41 LOC_Os07g04930 expressed protein Os.18485.1.S1_s_at 0.38 -1.39 LOC_Os03g52680 expressed protein Os.34952.1.S1_at 0.39 -1.38 LOC_Os01g55610 POT family protein
Os.51460.1.S1_at 0.39 -1.36 LOC_Os02g33380 pectinesterase inhibitor domain containing protein Os.27650.1.S1_at 0.40 -1.32 LOC_Os07g43560 Protein kinase domain containing protein OS.23151.1.S1_AT 0.40 -1.30 LOC_Os01g13610 NmrA-like family protein
OS.23187.1.S1_AT 0.41 -1.29 LOC_Os04g01470 O-methyltransferase family protein OS.14951.1.S1_AT 0.41 -1.27 LOC_Os08g39730 Cytochrome P450 76C2
OS.10583.1.S1_S_AT 0.42 -1.25 LOC_Os06g04920 Zn-finger in Ran binding protein and others containing protein Os.11260.1.S1_at 0.42 -1.25 LOC_Os05g31670 plasma membrane associated protein
Os.52036.1.S1_at 0.43 -1.23 LOC_Os05g31020 Eukaryotic peptide chain release factor subunit 1-2 OS.2423.1.S1_AT 0.43 -1.21 LOC_Os12g36850 Pathogenesis-related protein Bet v I family protein Os.6288.1.S1_at 0.43 -1.21 LOC_Os08g31850 expressed protein
OS.50222.1.S1_AT 0.44 -1.20 LOC_Os12g24800 nine-cis-epoxycarotenoid dioxygenase4 Os.17449.1.A1_at 0.44 -1.19 LOC_Os01g69070 Auxin Efflux Carrier family protein Os.55378.1.S1_at 0.44 -1.18 LOC_Os09g34890 expressed protein
OS.9103.1.S1_AT 0.46 -1.13 LOC_Os09g09930 heavy metal-associated domain containing protein OS.46450.1.S1_AT 0.46 -1.13 LOC_Os10g34930 secretory protein
OS.11218.1.S1_AT 0.46 -1.12 LOC_Os07g44440 peroxiredoxin
OS.1043.1.S1_AT 0.46 -1.11 LOC_Os01g42860 subtilisin-chymotrypsin inhibitor 2 Os.9321.1.S1_a_at 0.47 -1.10 LOC_Os01g65100 POT family protein
Os.53579.1.S1_at 0.47 -1.09 LOC_Os02g30240 expressed protein
OS.3415.1.S1_AT 0.47 -1.09 LOC_Os10g39680 Acidic 27 kDa endochitinase precursor OS.34273.1.S1_AT 0.47 -1.09 LOC_Os01g71710 Amino acid permease family protein Os.50292.1.S1_at 0.47 -1.08 LOC_Os02g13560 Sugar transporter type 2a OS.56976.1.S1_AT 0.47 -1.08 LOC_Os12g38320 expressed protein Os.47446.1.S1_at 0.47 -1.08 LOC_Os07g01090 proline transporter
Os.11354.1.S1_at 0.47 -1.08 LOC_Os04g51460 xyloglucan endotransglucosylase/hydrolase protein 15precursor Os.1479.1.S1_at 0.48 -1.07 LOC_Os07g48980 Nicotianamine synthase 3
Os.49648.1.S1_s_at 0.48 -1.06 LOC_Os02g54140 Hsp20/alpha crystallin family protein OS.52461.1.S1_AT 0.48 -1.06 LOC_Os06g02850 expressed protein
OS.27688.1.A1_AT 0.48 -1.05 LOC_Os04g21350 flowering promoting factor-like 1 Os.29003.1.S1_at 0.49 -1.04 LOC_Os01g49210 expressed protein
Os.20230.1.S1_at 0.49 -1.03 LOC_Os11g37950 Barwin, putative, expressed OS.21387.3.S1_AT 0.49 -1.03 LOC_Os04g48670 hypothetical protein OS.17496.1.S1_AT 0.49 -1.03 LOC_Os12g16090 expressed protein
OS.9279.1.S1_AT 0.49 -1.02 LOC_Os12g38270 Metallothionein-like protein 1 OS.4179.1.S1_AT 0.49 -1.02 LOC_Os02g32660.1 1,4-alpha-glucan branching enzyme OS.16532.1.S1_AT 0.49 -1.02 LOC_Os03g52370 expressed protein
OS.23518.1.A1_AT 0.49 -1.02 LOC_Os02g36190 Cytochrome P450 71D7
OS.165.1.S1_AT 0.50 -1.01 LOC_Os12g36880 Pathogenesis-related protein Bet v I family protein
OS.55484.1.S1_AT 0.50 -1.00 LOC_Os02g45620 uncharacterized plant-specific domain TIGR01568 family protein OS.54229.1.S1_AT 2.00 1.00 LOC_Os04g36670 expressed protein
OS.28032.1.A1_AT 2.00 1.00 LOC_Os01g21070 endogl