RESEARCH ARTICLE
TERM PROM: ACTIVE VERSUS EXPECTANT MANAGEMENT
*Janhavi Mukkharya and Dr. Inamdar
Department of Obstetrics and Gynecology, AVBRH, Sawansi Meghe, Wardha, Maharashtra, India
ARTICLE INFO
ABSTRACT
Background: Premature rupture of membranes (PROM) refers to the loss of integrity of membranes before onset of labor, with resulting leakage of amniotic fluid and establishment of communication between the amniotic cavity and the endocervical canal and vagina. Premature rupture of membranes (PROM) complicates 5-10 % of pregnancies. Approximately 60-70 % of term PROM cases are followed by the onset of labor within 24 hours. Diagnosis and proper management is very important. In spite of many studies available in the literature, the clinical management is surprisingly controversial The aim of the study was to compare the fetal and maternal outcomes of actively managed and expectantly managed term PROM.
Methods: In this observational study we included 200 women with diagnosed prelabour rupture of membranes. All women had gestational age >36 weeks and <4o weeks with singleton pregnancy and vertex presentation. Study excluded all patients with previous uterine scar or with any medical or surgical disorder. They were randomly divided in two groups with 100 women each: Group A which was induced with PGE1 or oxytocin depending on their cervical score and Group E which was managed expectantly and late induction after 24 hours was done. Both the groups were given intravenous antibiotics. They were evaluated on the basis of fetal and maternal outcomes.
Results: In this study we found that 70% women who were managed expectantly went in labour within 24 hours of PROM. But PROM to delivery interval was longer in expectantly managed as compared to actively managed or induced group. Rate of cesarean was more in induced group but was statistically insignificant when compared in both the groups. So was NICU admission more in expectant group but was statistically insignificant when compared in both the groups.
Conclusions: Expectant managed can be done in patients with term PROM to reduce the cesarean rate with proper antibiotic prophylaxis. There was no significant difference in maternal and fetal outcomes of both the management.
Copyright©2017,Janhavi Mukkharya and Dr. Inamdar.This is an open access article distributed under the Creative Commons Attribution License, which permits unrestricted use, distribution, and reproduction in any medium, provided the original work is properly cited.
INTRODUCTION
The maintenance of the integrity of the fetal membranes is critical for successful progression of pregnancy. Membranes hold the amniotic fluid and guard the fetus against infection ascending from the genital tract. However rupture of the fetal membranes is an integral part of the normal and abnormal parturition process. Under normal circumstances, fetal membranes rupture during the active phase of labor. Once the membranes rupture the integrity of pregnancy is in jeopardy. Many complications like preterm labor, prolonged labor, dry labor, chorioamnionitis, congential pneumonia, neonatal infection, and even death of neonate might occur. Premature rupture of membranes (PROM) refers to the loss of integrity of membranes before onset of labor, with resulting leakage of amniotic fluid and establishment of communication between
*Corresponding author: Janhavi Mukkharya
Department of Obstetrics and Gynecology, AVBRH, Sawansi Meghe, Wardha, Maharashtra, India.
the amniotic cavity and the endocervical canal and vagina. 1
Prelabor rupture of membranes is a matter of major concern for all obstetricians as it is associated with high fetal morbidity and mortality and maternal morbidity and mortality sometimes. The majority (90 %) of Prelabor rupture of membranes (PROM) occurs in women who are at term (Zamzami, 2005), and PROM at term occurs in 8 per cent of
all births (Hannah et. al., 1996). In the majority of patients at
term, labor will occur spontaneously within the first 24 hours following amniorrhexis. PROM occurs when intrauterine pressure overcomes membrane resistance. This happens as a result of weakening of membrane either congenital or acquired (smoking and vitamin C deficiency), or because of damaging factors, either mechanical (amniocentesis or amnioscopy) or physical–chemical damage by infection (Trichomonas, group B Streptococci, bacterial vaginosis, etc.). Failure of mechanical support such as cervical dilatation can lead to
PROM, favoring bacterial contamination as well.1
Interestingly, at term, PROM can be a physiological variation
rather than a pathological event.5 The major question regarding
ISSN: 0976-3376
Vol. 08, Issue, 02, pp.4244-4254, February,Asian Journal of Science and Technology 2017ASIAN JOURNAL OF
SCIENCE AND TECHNOLOGY
Article History:
Received 23rd November, 2016
Received in revised form
19th December, 2016
Accepted 26th January, 2017
Published online 28th February, 2017
Key words:
management of these patients is whether to allow them to enter labor spontaneously or to induce labor as there is a major maternal risk of intrauterine infection which is a most serious complication associated with PROM for the mother and the neonate. The risk of chorioamnionitis with term PROM has been reported to be less than 10 per cent and to increase to 24 per cent after 24 hours of PROM. These points out the importance of appropriate management strategies for PROM at term. The key to the management depends on the accurate assessment of gestational age, likelihood of infection, duration of latent phase and the availability of NICU facilities. There is a general agreement that the term pregnant patients with PROM should be delivered to avoid infection to both mother and the infant as the dangers of infection goes on increasing with prolonged latent phase. But early interference may increase the incidence of cesarean section. Neonatal morbidity will also be increased because of the mechanical difficulties encountered with delivery, either by vaginal or abdominal route due to reduced volume of amniotic fluid. In the event of non-induction of labor in PROM, there may be good uterine contractions but reduced amount of liquor causes failed progression and consequently dry labor followed by rupture uterus.
According to Flenady V6, where membranes rupture in latent
phase, latent phase is longer but the remaining portion of curve is uninfluenced. If induction is attempted with intravenous oxytocin drip, the frequency of failed induction is attempted with intravenous oxytocin, the frequency of failed induction and subsequent cesarean delivery approaches 30-40% and protracted labor increases the risk of maternal and neonatal infection. Conversely if women are observed expectantly to allow the cervix to ripen and labor to begin spontaneously, infection, umbilical cord prolapse or compression of the cord may occur, these in turn lead to an increased frequency of caesarean delivery, and if women are hospitalized, increased expenses is incurred. The specific dilemma involves how best to treat patients with PROM. Thus the frequency of term PROM and the questions that still exist with regard to optimal management of these cases justify the need to carry out this randomized study to evaluate and compare the results of active and expectant management of term PROM. Hence, there is a need to assess the effects of planned early birth versus expectant management for women with prelabor rupture of membranes at term on fetal, infant and maternal wellbeing.
Aim and Objectives
Aim
The aim of the study was to compare the effects of expectant and active management of PRE-LABOR RUPTURE OF MEMBRANES at term on feto-maternal outcome in a rural setup
Objectives
To study the effect of expectant management on feto
maternal outcomes in term PROM
To study the effect of active management on feto
maternal outcomes in term PROM
To study and compare the of feto-maternal outcome
expectant and active management of PROM at term
Hypothesis
Pre-labor Rupture of Membrane (PROM) occurs in approximately 5-10% of all pregnancies of these 80% occur in term pregnancy. There is a general agreement that the term pregnant patients with PROM should be delivered to avoid infection to both mother and the infant as the dangers of infection goes on increasing with prolonged latent phase. But early interference may increase the incidence of cesarean section. Thus the frequency of term PROM and the questions that still exist with regard to optimal management of these cases justify the need to carry out this randomized study to evaluate and compare the results of active and expectant management of term PROM.
MATERIALS AND METHODS
Type of study –prospective and observational study
The study was conducted at the department of Obstetrics and Gynecology Acharya Vinoba Bhave Rural Hospital of Jawaharlal Nehru Medical College,Sawangi (Meghe), Wardha 442004,Maharashtra over a period of 24 months from October 2014 to August 2016. 200 Patients with diagnosis of pre labor rupture of membranes with term gestation (37 - 40) weeks having PROM irrespective of gravidity and parity Gestational age assessment was done by LMP – Naegle’s formula
The formula used for determination sample size is
n = x²*N* P(1-P)/C²(N-1)+x² *P(1-P)
Where
x² =chisquare tabulated value at 5% level of significance =3.84 C=0.05 = desired level of error
N = total no. yearly pts with confirmed pre labor rupture of membranes 60
P =0.50 Thus n = 51.49
Inclusion Criteria
a. Women at term gestation (37 - 40) weeks having PROM
irrespective of gravidity
Gestational age assessment was done by
LMP – Naegle’s formula
Ultrasound
b. Singleton Pregnancy
c. Pregnancy with Vertex Presentation
Exclusion Criteria
a. Women less than 37 Weeks of gestation and more than
41 Weeks of gestation.
b. Women with medical disorders
c. Women with obstetric high risk factors like Diabetes,
Pregnancy induced hypertension, heart disease
complicating pregnancy, Antepartum hemorrhage etc.
d. Women with congenital anomalous fetus, abnormal
e. Women did not give consent to participate in the study
f. Women with sign and symptoms of chorioamniotis,
leucocytosis, fever more than 100’F at the time of admission
g. Women with meconium stained liqor , fetal distress or
non assuring CTG at the time of admission
The Ethical committee clearance was taken before initiation of the study. All term pregnant women reporting with complaints of watery vaginal discharge, fulfilling above inclusion criteria were included in the study. An informed written consent was taken. All the information and results were recorded in the pre-designed proforma. Detailed history was taken and clinical examination done. Demographic information, height and weight were recorded to calculate the body mass index. Speculum examination with all aseptic precautions was done to observe for pooling of liquor, Nitrazine test was done. Vaginal examination was done to know the length, dilatation and effacement of the cervix and station of presenting part. Bishop scoring was done. Gestational age was determined
from last menstrual period (LMP) and/or early
ultrasonography. An obstetric ultrasonography was done for gestational age, presentation of baby, any congenital anomaly and baby weight, placental grading, amniotic fluid index. Blood sample was collected for complete blood counts and Rh typing and other routine investigations.
Management
Women having confirmed diagnosis of PROM were randomly allotted to either active management or expectant management by random sampling. Informed consent was taken for either management.
Active management
After assessment of pelvis and Bishop’s Score if cervix unfavorable i.e 0-5, induction with PGE1 25mcg given orally and was repeated 6 hourly till favourable bishop’s score was achieved followed by augmentation with oxytocin drip was practised. If favorable i.e. 6 -13 of bishops score, Oxytocin drip 5 units in 500ml RL was given. Infusion started at 2 m IU/min via infusion pump and doubled every 30 minutes till there is optimal response i.e. 3 contractions in 10 min each lasting for 45 seconds . If labour had not supervened drip is again repeated after 2 – 4 hours. Partograph was plotted.
During active management
Monitoring once in every ½ hr for maternal pulse rate, uterine action with descent of head, Fetal heart sounds rate was noted. Per vaginal examination done and temperature was recorded once in 4 hours in active labour.
Expectant management for 24 Hours
After admitting a woman with PROM, vitals recorded every 4th hourly .Abdominal examination done for uterine action and descent of head. Repeated per vaginal examinations were avoided. Pad given for observation and for any meconium stained leak or foul smelling infected discharge. Prophylactic antibiotic given. Maternal pulse rate and fetal heart sounds
uterine action monitored every half an hourly. Mode of delivery was noted as
a. Spontaneous onset of labor, delivered vaginally
b. Outlet or vacuum
c. Caesarean section
In few patients who went into active labor needed augmentation of labor was done with oxytocin drip drip 5 units in 500ml PL was given. Infusion started at 2 m IU/min and doubled every 20 minutes till there is optimal response. The mother was followed up in the puerperium for one week for any signs and symptoms of morbidity high fever, foul smelling lochia, wound gaping etc. By maintaining 4th hourly – temperature, pulse rate chart. In the presence of fever other causes like breast engorgement, Respiratory tract infection and prior urinary tract infection were excluded. The smell and colour of lochia were noted. Rate of involution of uterus and duration of hospital stay was also noted.
Neonatal outcome
The newborn babies were examined for APGAR score at 1 min of birth. Their birth weight, Presence of caput & excessive moulding, temperature (Fever), Any resuscitation required with oxygen (or) ambu bag, feeding problems were noted. CRP was done of all the new born babies of patients who had PROM. If CRP was positive the babies were started on antibiotics for 7 days and were further screened for blood culture. If blood culture was positive antibiotics were given for 14 days as were the organism detected. The progress of the babies in the neonatal period was observed for one week for any fever and feeding problems Data regarding each case was made out based on the following proforma. Maternal and fetal outcome of all the cases were recorded including the follow up of babies up to 7 days. If the neonate was admitted in NICU, complete follow up was done.
OBSERVATION AND RESULTS
Table 1A. Distribution of patients according to mode of delivery
Mode of delivery Active
Management
Expectant
Management א2-value
Vaginal 63 71 1.038
p=0.58,NS
Forceps 3 1
Caeserean Section 34 28
Total 100 100
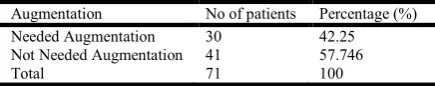
Table 1B. Number of patients who delivered spontaneously in expectant management and need augmentation of labour
Augmentation No of patients Percentage (%)
Needed Augmentation 30 42.25
Not Needed Augmentation 41 57.746
Total 71 100
Graph 1A. Distribution of patients according to mode of delivery
Out of 71 patients who underwent spontaneous vaginal delivery 30 patients needed augmentation after getting into active labor. Graph 9: Number of patients who delivered
spontaneously in expectant management and need
augmentation of labour.
Graph 1B. Number of patients who delivered spontaneously in expectant management and need augmentation of labour
Table 2. Correlation of mode of delivery with duration of PROM in active management
Duration of Leaking PV Total
<6 hrs
6-12 hrs
12-18 hrs
18-24 hrs Mode of
delivery
Vaginal 6 34 22 1 63
LSCS 1 15 13 5 34
Instrumental 0 1 2 0 3
Total 7 50 37 6 100
א2-value 9.50,p=0.147,NS
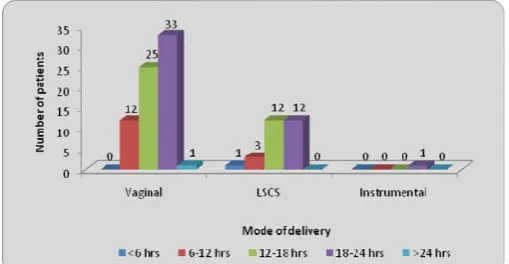
63% patients of actively managed group delivered vaginally and 34 patients out of 68 who delivered vaginally had delivered within 12hrs whereas 34% patients of actively managed group underwent cesarean section and out of those 34 patients 13 patients had PROM to delivery interval of more than12 hrs and 5 patients had PROM to delivery interval of more than 18 hrs. 2 patients out of 3 who underwent instrumental delivery had PROM to delivery interval of more than 12 hrs
Graph 2. Correlation of mode of delivery with duration of PROM in active management
Table 3. Correlation of mode of delivery with duration of PROM in expectant management
Duration of Leaking PV Total
<6 hrs
6-12 hrs
12-18 hrs
18-24 hrs
> 24 hours Mode of
delivery
Vaginal 0 12 25 33 1 71
LSCS 1 3 12 12 0 28
Instrumental 0 0 0 1 0 1
71% patients of expectantly managed group delivered vaginally and 33 patients out of 71who delivered vaginally had PROM to delivery time of 18-24hrs and 1 patient had PROM to delivery time more than 24hrs whereas 28 %(28ou of 100) patients of expectantly managed group underwent cesarean section and out of those 12patients had PROM to delivery interval of 12-18 hrs and 12 patients had PROM to delivery interval of 18-24 hrs. 1patient who underwent instrumental delivery had PROM to delivery interval of more than 18 hrs
Graph 3. Correlation of mode of delivery with duration of PROM in expectant management
Graph 4. Correlation of parity with mode of delivery in active management
Graph 5. Correlation of parity with mode of deliveryin expectant management
In actively managed group In actively managed group there were 70 nulliparaous patients of which 30 patients had PROM to delivery interval >12 hrs and 5 patients had PROM to delivery interval >18 hrs. In multiparous patients PROM to delivery interval was short only 4 patients with parity 1 had PROM to delivery interval >12hrs and only 3 patients with parity more than 1 had PROM to delivery interval of >12 hrs.
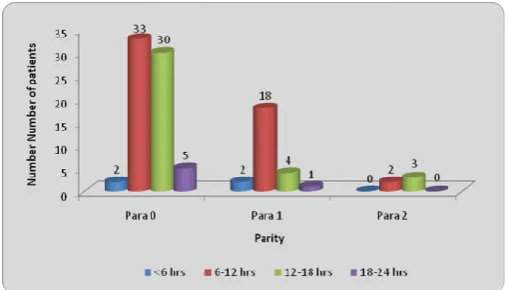
Graph 6. Correlation of parity with PROM to delivery interval in active management
In expectantly managed group there were 61 nulliparaous patients of which 27 patients had PROM to delivery interval >12 hrs and 29 patients had PROM to delivery interval >18 hrs. In multiparous patients PROM to delivery interval was short only 7 patients with parity >1& 4 patients with parity >2 Table 4. Correlation of parity with mode of delivery in active management
Total Mode of delivery א2-value
Vaginal Caeserean Instrumental
Parity Parity o 70 36 31 3 13.77
p=0.008,S
Parity 1 25 22 3 0
Parity 2 5 5 0 0
Total 100 68 34 3
Table 5. Correlation of parity with mode of deliveryin expectant management
Total Mode of delivery א2-value
Vaginal Caeserean Instrumental
Parity Parity o 61 36 24 1 13.47
p=0.034,S 100
Parity 1 27 25 2 0
Parity 2 11 9 2 0
Parity 3 1 1 0 0
Total 100 71 28 1
Table 6. Correlation of parity with PROM to delivery interval in active management
PROM to delivery interval Total א2-value
<6 hrs 6-12 hrs 12-18 hrs 18-24 hrs
Parity Para 0 2 33 30 5 70 8.70
p=0.191, NS
Para 1 2 18 4 1 25
Para 2 0 2 3 0 5
Total 4 53 37 6 100
Table 7. Correlation of parity with PROM to delivery interval in expectant management
PROM to delivery interval Total א2-value
<6 hrs 6-12 hrs 12-18 hrs 18-24 hrs >24 hrs
Parity Para 0 0 4 27 29 1 61 20.86
p=0.042, S
Para 1 0 7 8 12 0 27
Para 2 1 4 2 4 0 11
Para 3 0 0 0 1 0 1
had PROM to delivery interval >6hrs and 12 patients with parity more than >1 had PROM to delivery interval of >18 hrs. Progress of labor speeded among women with higher parity and gravidity.
Graph 7. Correlation of parity with PROM to delivery interval in expectant management
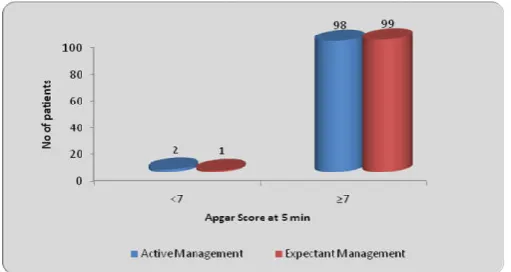
Table 8. Distribution of patients according to Apgar Score at 5 min
Apgar Score at 5 min
Active Management
Expectant
Management א2-value
<7 2 1 0.33
p=0.56,NS
≥7 98 99
Total 100 100
2 babies out of 100 of actively managed patients had
Apgar <7 at 5 minute of birth whereas 1 babies out of 100 of expectantly managed patients had Apgar <7 at 5 minute of birth .On applying chi square test there was no significant difference found in Apgar score at 5 minute of birth of babies in both the groups
Graph 8. Distribution of patients according to Apgar Score at 5 min
Table 9. Distribution of patients according to neonatal outcomes
Neonatal Outcome Active
Management
Expectant
Management א2-value
Meconium 6 4 0.42,p=0.51,NS
Birth asphyxia 10 11 0.05,p=0.81,NS
hyperbilirubinemia 6 1 3.70,p=0.05,NS
Healthybaby 78 84
Total 100 100
In the present study in actively managed group 6% neonates had meconium stained liqor at birth 10% neonates had birth asphyxia and 6% neonates had hyperbilirubinemia and in expectantly managed group 4 % neonates meconium stained
liqor at birth, 11 % neonates had birth asphyxia and 1% neonates had hyperbilirubinemia. On applying chi square there was no significant difference in neonatal outcome at birth in both the groups
Graph 9. Distribution of patients according to neonatal outcomes
Table 10. Distribution of patients according to NICU stay
NICU Stay
Active Management
Expectant
Management א2-value
Present 15 11 0.70
p=0.40,NS
Absent 85 89
Total 100 100
In actively managed group 15% babies had NICU admission whereas in expectantly managed group 11% babies had NICU admission. On applying Chi square test there was no significant difference found in the NICU admission of both the groups.
Table 10. Distribution of patients according to NICU stay
Table 11. Distribution of patients according to hospital stay
Hospital Stay Active
Management
Expectant
Management א2-value
Up to 5 days 37 0 51.91
p=0.0001,S
5- 8 days 48 66
8-10 days 15 24
>10 days 0 10
Total 100 100
Mean ±SD 6.56±1.58 8.34±1.47
Hospital stay was significantly prolonged in expectantly managed patients
Graph 11. Distribution of patients according to hospital stay
Statistical analysis was done by using descriptive and inferential statistics using chisquare test and software used in the analysis were SPSS 17.0 version and GraphPad Prism 5.0 version and p<0.05 is considered as level of significance.
DISCUSSION
Those women who were less than 37 weeks of gestation
and more than 41 weeks of gestation and the women with other obstetric complications LIKE
PROM more than 12 hrs
Patients with features of chorioamnionitis like fever,
tachycardia, uterine tenderness and foul smelling liquor
Fetal distress and meconium stained amniotic fluid at
admission
Active labour at admission and cervical dilatation more
than 4 cm(who criteria of actve labor
Previous caesarian section
History of ante partum hemorrhage
Maternal medical diseases like severe pre ecclampsia,
diabetes or heart diseases
IUGR and fetal anomalies
Abnormal presentation And Multiple Fetus Were
Excluded
Total study subjects were 200 women who were randomised in two groups Group A and Group E 100 patients of group a were actively managed and 100 patients of group were expectantly managed. The incidence of PROM in the present study was 7.99% in our hospital during the study period which is
comparable with study done by Vaishnav et al.,(2012) where
PROM incidence was 8.09% and with study done by DR S kiranmaie in which PROM incidence was found to be 9.8%
Distribution of patients according to PROM TO Delivery interval
Study Prom to delivery interval
Active Expectantly P value
GRACA KRUPA et al., (2005) 18.9±11.0 27.5±14.8 <0.0001
Umairah et al.,(2011) 17.4±2.0 22.2±2.0 <0.0001
Chaudhuri Snehamay et al., (2006) 17.10±10.3 21.63±10.3 <0.001
Dr Shanthi et al.,(2008) 11.46±6.01 30.49±16.07 S
Present study 12.39±3.88 17.81±5.25 <0.003
In the present study the PROM to delivery interval in actively managed group was 12.39±3.88 hours and in expectantly managed group was 17.81±5.25 hours. PROM to delivery time was significantly more in expectant group as compared to actively managed group. Thus, the present study was
comparable to study done by Graca krupa et al., (2005),
Chaudhuri Snehamay et al., (2006), Dr Shanthi et al.,(2008),
Umairah et al., (2011). In the present study as well as in all the
above given study PROM to delivery interval was significantly higher in expectantly managed group.
Comparison of Occurrence of Spontaneous Delivery
Study Active Expectant P value
PRESENT STUDY 63% 71% 0.58 NS
Graca Krupa et al38 (2005) 80% 69% 0.465 NS
Umairah et al50(2011) 83.8% 76.0% 0.678 NS
Chaudhuri Snehamay et al49 (2006) 78.5% 57.14% 0.178 NS
Dr Shanthi et al42(2008) 70.1% 88.6% 0.272 NS
Vaishanav et al., 44 (2012) 78.78% 74% 0.77 NS
In the present study the percentage of spontaneous vaginal delivery was 63% in actively managed and 71% in expectantly managed group, thus no significant difference was found in the two groups. Whereas in the studies done by Chaudhuri
Snehamay et al49 (2006) and GRACA KRUPA et al38 (2005)
the percentage of spontaneous vaginal delivery was significantly more in actively managed group as compared to expectantly managed group. In study done by Dr Shanthi et
al42(2008) 70.1% patients had spontaneous vaginal delivery in
actively managed group and 88.6% patients had spontaneous vaginal delivery in expectantly managed group. In the present study in expectantly managed group out of 71 spontaneous vaginal delivery 30 (42.25%of spontaneous vaginal delivery) needed augmentation of labor after patient went into active labor spontaneously which was comparable to study done by
Dr Shanthi et al., (2008) where in expectantly managed group
67.8% of all spontaneous vaginal delivery needed
augmentation of labor.
Comparison of Rate of Cesarean Section
Study Active Expectant
PRESENT STUDY 34% 28%
Dr Shanthi et al., 42(2008) 5.7% 12%
GRACA KRUPA et al38 (2005) 15% 23%
Umairah et al50(2011) 31% 56%
Chaudhuri Snehamay et al49 (2006) 15% 24%
The rate of cesarean in the present study was 34% in actively managed patients and 28% in expectantly managed patient. Though the rate is slightly higher in actively managed group but. there is no significant difference in view of cesarean section rate in both the groups .The study is comparable to all
the above given study. But in studies done by Dr Shanthi et al.,
(2008), Graca Krupa et al., (2005), Umairah et al., (2011),
Chaudhuri Snehamay et al., (2006) the rate of cesarean section
was significantly higher in expectantly managed patient.
Whereas in study done by Zamzami(2005) the rate of cesarean
section was twice in actively managed group than in expectant
group. In study done by Pintucci et al., (2013) the rate of
with duration of PROM in both the expectant and actively managed group which was similar to the study done by
Vaishanav et al., (2012). In table 15 & 16 there was significant
correlation was found between parity and mode of delivery in both active and expectantly managed group i.e rate of cesarean was high in primi /nulliparous women and was significantly low in multiparous women when compared. But in the study
done by Vaishanav et al., (2012) there was no correlation
found in the parity and mode of delivery. In table 17 in actively managed group PROM to delivery interval was less in multiparous patients but no significant correlation was found. But in table 18 significant correlation was found in PROM to delivery interval and parity of the patient. The interval decreased with multiple gestation .Progress of labor was speeded among women with higher parity and gravidity. In table 20 distribution of patients according to indication of cesarean section. In the present study 71.42 % (20 of 28 ) patients underwent cesarean section with indication of fetal distress/ non assuring ctg in expectant group whereas in active group only 50% (17 out of 34) of underwent cesarean section with the indication of fetal distress .Fetal distress was the most common indication of cesarean in both the groups.
Comparison on basis of Apgar score at 5 minutes of birth
Active Expectant P value
PRESENT STUDY 2% 1% 0.56 NS
Umairah et al50(2011) 7.29% 9.90% 0.363NS
Chaudhuri Snehamay et al49 (2006) 5.4% 7.1% 0.59 NS
In the present study only 2 % neonates had apgar < 7 after 5 minutes of birth in active group whereas only 1% in expectant managed group. There was no significant difference found on applying Chi square. Thus, the present study is comparable to
studies done by Umairah et al., (2011) and Chaudhuri
Snehamay et al., (2006)
Comparison on basis of NICU admission of neonates
Active Expectant P value
Present study 15% 11% 0.40
Chaudhuri Snehamay et al49 (2006) 2.7% 3.5% 0.71
Vaishanav et al., 44(2012) 1.5% 1.5% 0 NS
In the present study total NICU admissions were 15% in active group and 11% in expectant group. On applying chi square no significant difference was found among both the groups. Thus, the study is comparable to similar study done by Chaudhuri
Snehamay et al., (2006) and Vaishanav et al., (2012)
Comparison on basis neonatal outcome at birth
In the present study in actively managed group 6% neonates had meconium stained liqor at birth 10% neonates had birth asphyxia and 6% neonates had hyperbilirubinemia and in expectantly managed group 4 % neonates meconium stained liqor at birth, 11 % neonates had birth asphyxia and 1% neonates had hyperbilirubinemia. On applying chi square there was no significant difference in neonatal outcome at birth in
both the groups. In study done by Chaudhari Snehamay49
(2006) in actively managed group 5.4% neonates had birth asphyxia at birth and needed resuscitation with oxygen 3% neonates had feeding problems. Whereas in expectant group
4.4% neonates had birth asphyxia and needed resuscitation with oxygen 3.5% neonates needed ventilation after initial resuscitation and 3.5% neonates had feeding problems. In the
study done by Dr Shanthi et al., (2008) in actively managed
group 7.5% neonates had meconium stained liqor at birth 9.4% neonates had birth asphyxia and needed resuscitation , 1.8 % neonates had feeding problems whereas in expectantly managed group 8% neonates had meconium stained liqor at birth 6% neonates had birth asphyxia and needed resuscitation, 2 % neonates had feeding problems. Thus the present study is comparable to the above studies
Comparison on basis of mean hospital stay
Active Expectant P value
Present study 6.56±1.58 8.34±1.47 0.0001 S
Vaishanav et al38(2012) 6.87 5.12
Dr Shanthi et al42(2008) 3.66±1.27 2.76±1.73 0.001 S
In the present study in actively managed group mean hospital stay was 6.56 ±1.27days and in expectant group 8.34±1.47 days. Mean hospital was significantly more in expectant group as compared to actively managed group. The present study was comparable to the above studies
Limitation
The long term follow up of mothers and neonates who were admitted to NICU or were treated for infection could not be taken. Due to increased awareness of fetal and maternal outcome it was difficult to counsel patient for expectant management. In expectant group few patients had fever more than 100 ‘F during the management and thus had to be managed actively and had to be excluded from the study. Mean hospital stay of patients in expectantly managed group was significantly more in active managed group thus adding to increased hospital charges.
Conclusion
The present study concludes
However, active management is responsible for shortening the latency period, the total time between prelabor rupture of membranes and delivery and total maternal hospital stay.
Recommendation
Patients should be thoroughly assessed and examined before recruiting the type of management. More studies with follow up of maternal morbidity with correlation with maternal CRP values is further required for better evaluation and comparison between the two managements.
REFERENCES
1. Larrañaga-Azcárate C, Campo-Molina G, Pérez-Rodríguez
AF, Ezcurdia-Gurpegui M. Dinoprostone vaginal
slow-release system (Propess) compared to expectant
management in the active treatment of premature rupture of the membranes at term: impact on maternal and fetal
outcomes. Acta Obstet Gynecol Scand. 2008;87(2):195–
200.
2. Gunn GC, Mishell DR, Morton DG. Premature rupture of
the fetal membranes. A review. Am J Obstet Gynecol.,
1970 Feb 1;106(3):469–83.
3. Zamzami TYY. Prelabor rupture of membranes at term in
low-risk women: induce or wait? Arch Gynecol Obstet.
2006 Feb;273(5):278–82.
4. Hannah ME, Ohlsson A, Farine D, Hewson SA, Hodnett
ED, Myhr TL, et al. Induction of labor compared with expectant management for prelabor rupture of the
membranes at term. TERMPROM Study Group. N Engl J
Med., 1996 Apr 18; 334(16):1005–10.
5. Ozden S, Delikara MN, Avci A, Fiçicioglu C. Intravaginal
misoprostol vs. expectant management in premature rupture of membranes with low Bishop scores at term. Int J Gynaecol Obstet Off Organ Int Fed Gynaecol Obstet. 2002 May;77(2):109–15.
6. Flenady V, King J. Antibiotics for prelabour rupture of
membranes at or near term. Cochrane Database Syst Rev. 2002; (3):CD001807.
7. B.S. Kodkany, M.A. Telang. Premature rupture of
membranes. A study of 100 cases. J Obstet Gynaecol
India. 41(4).
8. Allen SR. Tocolytic therapy in preterm PROM. Clin Obstet
Gynecol., 1998 Dec; 41(4):842–8.
9. Mercer BM. Preterm premature rupture of the membranes.
Obstet Gynecol. 2003 Jan; 101(1):178–93.
10. Moberg LJ, Garite TJ, Freeman RK. Fetal heart rate
patterns and fetal distress in patients with preterm
premature rupture of membranes. Obstet Gynecol., 1984
Jul;64(1):60–4.
11. Jones G. Pre labour rupture of the membrane. In: Arnold
Mothhg, editor. Obstetrics & Gynaecology-An evidenced based text for MRCOG: Oxford University press; 2004. p. 297.
12. Obi SN, Ozumba BC. Pre-term premature rupture of fetal
membranes: the dilemma of management in a developing
nation. Journal of obstetrics and gynaecology. 2007 Jan
1;27(1):37-40.
13. Liu J, Feng ZC, Wu J. The incidence rate of premature
rupture of membranes and its influence on fetal–neonatal
health: A Report from Mainland China. Journal of tropical
pediatrics. 2009 Jun 19:fmp051.
14. Knox IC, Hoerner JK. The role of infection in premature
rupture of the membranes. American journal of obstetrics
and gynecology., 1950 Jan 31;59(1):190-4.
15. Benirschke K. A review of the pathologic anatomy of the
human placenta. American journal of obstetrics and
gynecology., 1962 Dec 1;84(11):1595-622.
16. Polishuk WZ, Palti Z, Rabau E, Lunenfeld B, David A.
Pregnancy in a case of Sheehan's syndrome following treatment with human gonadotrophins. BJOG: An
International Journal of Obstetrics & Gynaecology., 1965
Oct 1;72(5):778-80.
17. Lavery JP, Miller CE. Deformation and creep in the human
chorioamniotic sac. American journal of obstetrics and
gynecology., 1979 Jun;134(4):366-75.
18. Al‐Zaid NS, Bou‐Resli MN, Goldspink G. Bursting
pressure and collagen content of fetal membranes and their relation to premature rupture of the membranes. BJOG: An
International Journal of Obstetrics & Gynaecology., 1980
Mar 1;87(3):227-9.
19. Dale PO, Tanbo T, Bendvold E, Moe N. Duration of the
latency period in preterm premature rupture of the membranes. Maternal and neonatal consequences of
expectant management. European Journal of Obstetrics &
Gynecology and Reproductive Biology., 1989 Mar
31;30(3):257-62.
20. Vadillo-Ortega Fe, González-Avila Ge, Karchmer S, Cruz
Nm, Ala-Ruiz Aa, Lama Ms. Collagen metabolism in
premature rupture of amniotic membranes. Obstetrics &
Gynecology., 1990 Jan 1;75(1):84-8.
21. Malak TM, Bell SC. Structural characteristics of term
human fetal membranes: a novel zone of extreme
morphological alteration within the rupture site. BJOG: An
International Journal of Obstetrics & Gynaecology., 1994
May 1;101(5):375-86.
22. Parry S, Strauss JF. Premature rupture of the fetal
membranes. New England Journal of Medicine., 1998 Mar
5;338(10):663-70.
23. Gosselink CA, Ekwo EE, Woolson RF, Moawad A, Long
CR. Dietary habits, prepregnancy weight, and weight gain during pregnancy: Risk of pre term rupture of amniotic sac
membranes. Acta obstetricia et gynecologica
Scandinavica., 1992 Jan 1;71(6):425-38.
24. Ekwo EE, Gosselink CA, Moawad A. Previous pregnancy
outcomes and subsequent risk of preterm rupture of
amniotic sac membranes. BJOG: An International Journal
of Obstetrics & Gynaecology., 1993 Jun 1;100(6):536-41.
25. Abe T. The detection of the rupture of fetal membranes
with the nitrazine indicator. American journal of obstetrics
and gynecology., 1940 Mar 31;39(3):400-4.
26. ZONDEK B, Rozin S. Cervical Mucus Arborization: Its
use in the determination of corpus luteum function.
Obstetrics & Gynecology., 1954 May 1;3(5):463-70.
27. Borten M, Friedman EA. Amniotic fluid ferning in early
gestation. American journal of obstetrics and gynecology.,
1986 Mar 31;154(3):628-30.
28. Kappy KA, Cetrulo CL, Knuppel RA, Ingardia CJ, Sbarra
AJ, Scerbo JC, et al. Premature rupture of the membranes:
a conservative approach. Am J Obstet Gynecol., 1979 Jul
15;134(6):655–61.
29. Kappy KA, Cetrulo CL, Knuppel RA, Ingardia CJ, Sbarra
AJ, Scerbo JC, et al. Premature rupture of the membranes at term. A comparison of induced and spontaneous labors.
30. Alcalay M, Hourvitz A, Reichman B, Luski A, Quint J, Barkai G, et al. Prelabour rupture of membranes at term: early induction of labour versus expectant management.
Eur J Obstet Gynecol Reprod Biol., 1996 Dec
27;70(2):129–33.
31. Shalev E, Peleg D, Eliyahu S, Nahum Z. Comparison of
12- and 72-hour expectant management of premature
rupture of membranes in term pregnancies. Obstet
Gynecol., 1995 May;85(5 Pt 1):766–8.
32. Hjertberg R, Hammarström M, Moberger B, Nordlander E,
Granström L. Premature rupture of the membranes (PROM) at term in nulliparous women with a ripe cervix. A randomized trial of 12 or 24 hours of expectant
management. Acta Obstet Gynecol Scand., 1996
Jan;75(1):48–53.
33. Akyol D, Mungan T, Unsal A, Yüksel K. Prelabour rupture
of the membranes at term--no advantage of delaying
induction for 24 hours. Aust N Z J Obstet Gynaecol., 1999
Aug;39(3):291–5.
34. Hodnett ED, Hannah ME, Weston JA, Ohlsson A, Myhr
TL, Wang EE, et al. Women’s evaluations of induction of labor versus expectant management for prelabor rupture of the membranes at term. Term PROM Study Group. Birth Berkeley Calif., 1997 Dec; 24(4):214–20.
35. McCaul JF, Rogers LW, Perry KG, Martin RW, Allbert JR,
Morrison JC. Premature rupture of membranes at term with
an unfavorable cervix: comparison of expectant
management, vaginal prostaglandin, and oxytocin
induction. South Med J., 1997 Dec; 90(12):1229–33.
36. Ben-Haroush A, Yogev Y, Glickman H, Bar J, Kaplan B,
Hod M. Mode of delivery in pregnancies with premature rupture of membranes at or before term following induction of labor with vaginal prostaglandin E2. Am J Perinatol. 2004 Jul;21(5):263–8.
37. Ezra Y, Michaelson-Cohen R, Abramov Y, Rojansky N.
Prelabor rupture of the membranes at term: when to induce
labor? Eur J Obstet Gynecol Reprod Biol. 2004 Jul
15;115(1):23–7.
38. da Graça Krupa F, Cecatti JG, de Castro Surita FG,
Milanez HMBP, Parpinelli MA. Misoprostol versus expectant management in premature rupture of membranes
at term. BJOG Int J Obstet Gynaecol. 2005
Sep;112(9):1284–90.
39. Lin MG, Nuthalapaty FS, Carver AR, Case AS, Ramsey
PS. Misoprostol for labor induction in women with term
premature rupture of membranes: a meta-analysis. Obstet
Gynecol. 2005 Sep;106(3):593–601.
40. Dare MR, Middleton P, Crowther CA, Flenady VJ,
Varatharaju B. Planned early birth versus expectant management (waiting) for prelabour rupture of membranes at term (37 weeks or more). Cochrane Database Syst Rev. 2006;(1):CD005302.
41. Ayaz A, Saeed S, Farooq MU, Ahmad F, Bahoo LA,
Ahmad I. Pre-labor rupture of membranes at term in patients with an unfavorable cervix: active versus
conservative management. Taiwan J Obstet Gynecol. 2008
Jun;47(2):192–6.
42. Dr. K. Shanthi, Dr.G.Prameela Devi, Dr.T.Bharathi,
Dr.P.A.Chandrasekharan. Comparative study of Active versus Expectant management and Maternal and Neonatal outcome in Premature rupture of the membranes (PROM) in Tertiary Care Hospital, Tirupathi. IOSR-JDMS. 2015 Apr;14(4):34–9.
43. El Fekih C, Ouerdiane N, Mrezguia C, Mourali M, Douagi
M, Abdennebi M, et al. [Premature rupture membrane at
term with unfavourable cervix]. Tunis Médicale. 2009
Sep;87(9):603–6.
44. J V, G V. A Study of Feto-Maternal Outcome in Patients
with Prelabour Rupture of Membranes at Term >37
Weeks. Med Sci Int Med J. 2012;1(2):118.
45. Shah K, Doshi H. Premature Rupture of Membrane at
Term: Early Induction Versus Expectant Management. J
Obstet Gynecol India. 2012 Apr;62(2):172–5.
46. Mbaluka CM, Kamau K, Karanja JG, Mugo N.
Effectiveness And Safety Of 2-Hourly 20 Mcg Oral Misoprostol Solution Compared To Standard Intravenous Oxytocin In Labour Induction Due To Pre-Labour Rupture Of Membranes At Term: A Randomised Clinical Trial At
Kenyatta National Hospital. East Afr Med J. 2014
Sep;91(9):303–10.
47. Pintucci A, Meregalli V, Colombo P, Fiorilli A. Premature
rupture of membranes at term in low risk women: how long
should we wait in the “latent phase”? J Perinat Med., 2014
Mar;42(2):189–96.
48. Sadeh-Mestechkin D, Samara N, Wiser A, Markovitch O,
Shechter-Maor G, Biron-Shental T. Premature rupture of the membranes at term: time to reevaluate the
management. Arch Gynecol Obstet. 2016 Aug 8;
49. Chaudhuri Snehamay 1,, Biswas Pranab Kumar1,
Bhattacharyya Sudipta2, Mitra Sankar Nath1. Premature rupture of membranes at term : immediate induction with PGE2 gel compared with delayed induction with oxytocin.
J Obstet Gynecol India. Vol. 56, No. 3 : May/June
2006(May/June 2006).
50. 50. Yaqub U. Obstetric and perinatal outcome in induction
of labor compared with expectant management for prelabor
rupture of the membranes at term. Mushtaq R, editor. Pak
Armed Forces Med J. 2015;65(2):179–83.
51. Lebherz TB, Hellman LP, Madding R, Anctil A, Arje SL.
Double-Blind Study of Premature Rupture of the
Membranes. A Report of 1,896 Cases. Am J Obstet
Gynecol., 1963 Sep 15;87:218-25.
52. Gunn GC, Mishell DR, Jr., Morton DG. Premature rupture
of the fetal membranes. A review. Am J Obstet Gynecol.,
1970 Feb 1;106(3):469-83.
53. Berkowitz RL, Bonta BW, Warshaw JE. The relationship
between premature rupture of the membranes and the
respiratory distress syndrome. Am J Obstet Gynecol., 1976
Apr 1;124(7):712-8.
54. Schlievert P, Johnson W, Galask RP. Isolation of a
low-molecular-weight antibacterial system from human amniotic fluid. Infect Immun., 1976 Nov;14(5):1156-66.
55. Tafari N, Ross SM, Naeye RL, Galask RP, Zaar B. Failure
of bacterial growth inhibition by amniotic fluid. Am J
Obstet Gynecol., 1977 May 15;128(2):187-9.
56. Fayez JA, Hasan AA, Jonas HS, Miller GL. Management
of premature rupture of the membranes. Obstet Gynecol.,
1978 Jul;52(1):17-21.
57. Vintzileos AM, Campbell WA, Nochimson DJ, Weinbaum
PJ. Preterm premature rupture of the membranes: a risk
factor for the development of abruptio placentae. Am J
Obstet Gynecol., 1987 May;156(5):1235-8.
58. Seo K, McGregor JA, French JI. Preterm birth is associated
with increased risk of maternal and neonatal infection.
59. Rib DM, Sherer DM, Woods JR, Jr. Maternal and neonatal outcome associated with prolonged premature rupture of
membranes below 26 weeks' gestation. Am J Perinatol.,
1993 Sep;10(5):369-73.
60. Vergani P, Ghidini A, Locatelli A, Cavallone M, Ciarla I,
Cappellini A, et al. Risk factors for pulmonary hypoplasia
in second-trimester premature rupture of membranes. Am J
Obstet Gynecol., 1994 May;170(5 Pt 1):1359-64.
61. Carroll SG, Ville Y, Greenough A, Gamsu H, Patel B,
Philpott-Howard J, et al. Preterm prelabour amniorrhexis: intrauterine infection and interval between membrane
rupture and delivery. Arch Dis Child Fetal Neonatal Ed.,
1995 Jan;72(1):F43-6.
62. Egarter C, Leitich H, Karas H, Wieser F, Husslein P,
Kaider A, et al. Antibiotic treatment in preterm premature rupture of membranes and neonatal morbidity: a
metaanalysis. Am J Obstet Gynecol., 1996
Feb;174(2):589-97.
63. Kenyon S, Boulvain M. Antibiotics for preterm premature
rupture of membranes. Cochrane Database Syst Rev. 2000(2):CD001058.
64. Osmanagaoglu MA, Unal S, Bozkaya H. Chorioamnionitis
risk and neonatal outcome in preterm premature rupture of membranes. Arch Gynecol Obstet. 2005 Jan;271(1):33-9.
65. Everest NJ, Jacobs SE, Davis PG, Begg L, Rogerson S.
Outcomes following prolonged preterm premature rupture of the membranes. Arch Dis Child Fetal Neonatal Ed. 2008 May;93(3):F207-11.
66. Moberg LJ, Garite TJ, Freeman RK. Fetal heart rate
patterns and fetal distress in patients with preterm
premature rupture of membranes. Obstet Gynecol., 1984
Jul;64(1):60-4.
67. Pajntar M, Verdenik I. Maternal and neonatal outcome
related to delivery time following premature rupture of
membranes. Int J Gynaecol Obstet., 1997 Sep;58(3):281-6.
68. ACOG Practice Bulletin No. 80: premature rupture of
membranes. Clinical management guidelines for
obstetrician-gynecologists. Obstet Gynecol. 2007
Apr;109(4):1007-19
69. Lenihan JP, Jr. Relationship of antepartum pelvic
examinations to premature rupture of the membranes.
Obstet Gynecol., 1984 Jan;63(1):33-7.
70. Johnston MM, Sanchez-Ramos L, Vaughn AJ, Todd MW,
Benrubi GI. Antibiotic therapy in preterm premature rupture of membranes: a randomized, prospective,
double-blind trial. Am J Obstet Gynecol., 1990 Sep;163(3):743-7.
71. Guinn DA, Goldenberg RL, Hauth JC, Andrews WW,
Thom E, Romero R. Risk factors for the development of preterm premature rupture of the membranes after arrest of
preterm labor. Am J Obstet Gynecol., 1995
Oct;173(4):1310-5.
72. Marlowe SE, Greenwald J, Anwar M, Hiatt M, Hegyi T.
Prolonged rupture of membranes in the term newborn. Am
J Perinatol., 1997 Sep;14(8):483-6.
73. Tasnim S, Bhuiyan AB. Outcome of premature rupture of
membranes. Bangladesh J Obstet Gynaecol., 1
998;13:16-20.
74. ACOG practice bulletin. Premature rupture of membranes.
Clinical management guidelines for
obstetrician-gynecologists. Number 1, June 1998. American College of
Obstetricians and Gynecologists. Int J Gynaecol Obstet.,
1998 Oct;63(1):75-84.
75. Nili F, Shams Ansari AA. Neonatal complications of
premature rupture of membranes. Acta Medica Iranica
2003;41 (3):175-9.
76. Pasquier JC, Rabilloud M, Picaud JC, Ecochard R, Claris
O, Gaucherand P, et al. A prospective population-based study of 598 cases of PPROM between 24 and 34 weeks'
gestation: description, management, and mortality
(DOMINOS cohort). Eur J Obstet Gynecol Reprod Biol.
2005 Aug 1;121(2):164-70.
77. Simhan HN, Canavan TP. Preterm premature rupture of
membranes: diagnosis, evaluation and management strategies. BJOG. 2005 Mar;112 Suppl 1:32-7.
78. Getahun D, Ananth CV, Oyelese Y, Peltier MR, Smulian
JC, Vintzileos AM. Acute and chronic respiratory diseases in pregnancy: associations with spontaneous premature
rupture of membranes. J Matern Fetal Neonatal Med. 2007
Sep;20(9):669-75.
79. Caughey AB, Robinson JN, Norwitz ER. Contemporary
diagnosis and management of preterm premature rupture of membranes. Rev Obstet Gynecol. 2008 Winter;1(1):11-22.
80. Recommendation from 'Intrapartum care: care of healthy
women and their babies during childbirth' (NICE clinical guideline 55).