©2016 New Delhi Publishers. All rights reserved
Input use Pattern in different Soybean Based Cropping System
in Karnataka
Vijaykumar. N
1*, Suresh S. Patil
2, G.M. Hiremath
3and
B.S. Reddy
4*1Assistant Professor, Department of Agricultural Economics, ARS, College of Agriculture, B’Gudi, Karnataka, India
2Dean (Agri.) and Professor & Head, Department of Agricultural Economics, College of Agriculture, B’Gudi, Karnataka, India 3Head, Project Planning and Monitoring Cell (PPMC), UAS, Raichur, India
4 Assistant Professor, Department of Agricultural Economics, College of Agriculture, Kalaburagi, Karnataka, India
*Corresponding author: [email protected]
Abstract
The research study was conducted in Bidar and Kalaburagi Districts of Karnataka to assess the input use
pattern in soybean based cropping systems. A sample size of 160 farmers was selected using multistage random sampling method. Field level data were elicited for the Agricultural year 2013-14 through personal interview method. The data collected were using tabular analysis. The major soybean based cropping systems followed were soybean + redgram, soybean + jowar, soybean +bajra and soybean sole crop in the study area. The input utilization pattern under soybean based cropping systems was more or less equal to the recommended level. The fertilizer utilized was more in cropping system-II. Whereas, it was bullock labour which was found to be highest in CS-III followed by cropping system-II. The machine labour in cropping system-IV was found to be highest. In all the cropping systems it was observed that the utilization of human labour was more when compared to bullock labour and machine labour. Keywords: Soybean, Input, Cropping system,Karnataka
Indian agriculture sector accounts for 13.8% of India's Gross Domestic Product (GDP) and provides employment to 50% of the country’s workforce. The production of foodgrains increased from 257 million tons in 2012-13 to 264 million tons in 2013-14. Soybean based cropping systems are important for sustaining agricultural production. Sustainability aims at balanced use of all available resources to achieve maximum production with minimum exploitation of natural resources. Soybean based cropping system were followed in North-Eastern Karnataka. In North-North-Eastern Karnataka region especially in Bidar and Kalaburagi districts, most of the farmers are growing soybean because of suitability of climatic factors viz., rainfall, temperature, sunshine, humidity and soil type and it is an important pulse as well as oilseed crop in the North-Eastern Karnataka region. With this background, the present study has been taken up with a view to study the input use pattern in different soybean based cropping systems.
Materials and Methods
The present investigation was carried out during the period 2013-14. Multistage random sampling technique was followed to choose the sample. In the first stage, two districts were selected based on the highest area under soybean crop. In the second stage, two taluks from the selected districts were
chosen based on the highest area under soybean
based cropping system. Similarly, two villages from each taluk were selected based on the same criterion.
Results and Discussion
Socio-economic characteristics of sample respondents
The information on socio-economic characteristics of the sample respondents is presented in Table 1. Which revealed that, majority of the respondents belong to middle age group in all the selected soybean based cropping systems. The average age of the sample respondents was 43, 45, 41, 44 and 43 years in cropping system-I (soybean + redgram), cropping system-II (soybean + jowar), cropping system-III (soybean + bajra), cropping system-IV (soybean sole crop) and overall respectively. It was observed that most of the sample respondents were fall under middle age group. This had relative influence on innovative and timely decisions in
adoption of new technology and enhances their
farm income. The family composition of sample respondents in the study area revealed that, The proportion of male accounted for 22.79, 23.34, 23.69, 26.83 and 24.10% respectively in CS-I, CS-II, CS-III,
CS-IV and overall. Average family size was 7.68, 6.94, 6.67, 6.41 and 6.93 in CS-I, CS-II, CS-III, CS-IV and overall respectively.
Literate sample respondents possessed education ranging from primary to PUC and above level. In CS-I, 22.50% had primary school education, 25.00% had high school education, 27.50% had PUC and above level education and 25.00% of them were illiterate. In CS-II, 25.00% had primary school education, 20.00% had high school education, 25.00% had PUC and above and 30.00% of them were illiterate. In CS-III, 20.00% had primary school education 30.00% had high school education and 25.00% of them are illiterate. In CS-IV, 25% had primary school, 17.50% had high school, and 27.50% had PUC and above level and 30% of them are illiterate. It was noticed that 27.50% of the farmers were illiterates. This indicated that, literacy level in the study area was higher as compared to state level average. To take care of the illiterates, there is a need for the extension agencies to educate the respondents regarding recent developments and
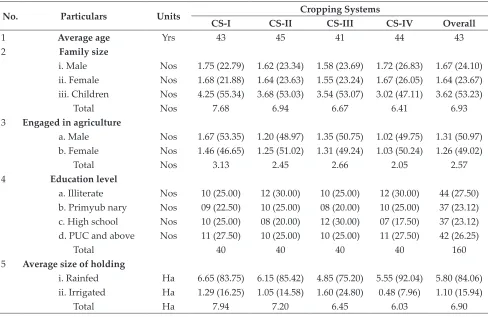
Table 1: Socio-economic characteristics of sample respondents in the study area (N=160)
Sl. No. Particulars Units Cropping Systems
CS-I CS-II CS-III CS-IV Overall
1 Average age Yrs 43 45 41 44 43
2 Family size
i. Male Nos 1.75 (22.79) 1.62 (23.34) 1.58 (23.69) 1.72 (26.83) 1.67 (24.10) ii. Female Nos 1.68 (21.88) 1.64 (23.63) 1.55 (23.24) 1.67 (26.05) 1.64 (23.67) iii. Children Nos 4.25 (55.34) 3.68 (53.03) 3.54 (53.07) 3.02 (47.11) 3.62 (53.23)
Total Nos 7.68 6.94 6.67 6.41 6.93
3 Engaged in agriculture
a. Male Nos 1.67 (53.35) 1.20 (48.97) 1.35 (50.75) 1.02 (49.75) 1.31 (50.97) b. Female Nos 1.46 (46.65) 1.25 (51.02) 1.31 (49.24) 1.03 (50.24) 1.26 (49.02)
Total Nos 3.13 2.45 2.66 2.05 2.57
4 Education level
a. Illiterate Nos 10 (25.00) 12 (30.00) 10 (25.00) 12 (30.00) 44 (27.50) b. Primyub nary Nos 09 (22.50) 10 (25.00) 08 (20.00) 10 (25.00) 37 (23.12) c. High school Nos 10 (25.00) 08 (20.00) 12 (30.00) 07 (17.50) 37 (23.12) d. PUC and above Nos 11 (27.50) 10 (25.00) 10 (25.00) 11 (27.50) 42 (26.25)
Total 40 40 40 40 160
5 Average size of holding
i. Rainfed Ha 6.65 (83.75) 6.15 (85.42) 4.85 (75.20) 5.55 (92.04) 5.80 (84.06) ii. Irrigated Ha 1.29 (16.25) 1.05 (14.58) 1.60 (24.80) 0.48 (7.96) 1.10 (15.94)
Total Ha 7.94 7.20 6.45 6.03 6.90
Note: Figures in parentheses indicate percentage to respective total
technologies in agriculture and other enterprises
to increase their level of income and productivity on the farm.
With regard to occupational pattern of the sample respondents, the participation of adults male respondents in agriculture was more (50.97%) when compared to female respondents (49.02%) which was quite obvious in paternal females. The study also revealed that, the main income of the sample respondents was from agriculture. As far as pattern of land holding was concerned, about 83.75%, 85.42%, 75.20%, 92.04% and 84.06% of cultivable land was under rainfed condition and proportion of irrigated land was 16.25%, 14.58%, 24.80% and 7.96%, 15.94% under I, II, CS-III and overall respectively. Incidentally irrigated land was not found in case of CS-IV category. The major proportion of land holding was under rainfed condition ranges between 75.20 to 92.04% with an average of 84.06%. In other words, all the sample respondents were having lands. The study revealed that the majority of the sample respondents had medium to large sized landholdings.
Input use pattern under soybean based cropping systems
The results on quantity of inputs used per hectare
under soybean based cropping systems were presented in Table 2. It indicated that, on an average quantum of seed used in CS-I was 47.65 kg, 13.26 q of farmyard manure and of 150.0 kg of chemical fertilizer. Similarly, the average human labour employed in CS-I was 43.68 mandays and bullock pair days used was 12.77. On an average, the machine labour used in CS-I was 4.90 hours. Human labour was mainly used in sowing, intercultivation, harvesting and threshing operations. Hence, the study revealed that, these operations were labour
intensive, so there was a need to use more number of human labours in these operations.
In case of CS-II, an average quantum of seed used was 64.09 kg, farmyard manure of 13.39 q and chemical fertilizer of 126.24 kg per hectare. Similarly, the average number of human labour employed in CS-II was 41.02 mandays and the bullock pair days of 10.20 per hectare. The machine labour used in CS-II was 3.16 hours per hectare. The amount spent on plant protection chemical was to the extent of 385.95. Human labour was mainly used in sowing, intercultivation and harvesting including threshing operations. Hence, the study revealed that, these operations were labour intensive and hence, there was a need for more number of human labours in the said operations. The bullock labour (10.20 pair day) was also a component in crop production and was mainly used in ploughing, harrowing and sowing operations. The machine labour (3.16 hr) was mainly used for the purpose of transportation of farmyard manure.
In case of CS-III, the average quantum of seed used was 73.72 kg, farmyard manure of 14.40 q and chemical fertilizer used was 112.25 kg per hectare. Similarly, the average human labour employed in CS-III was 38.40 mandays and the bullock pair days used was 10.24 and on an average the machine labour used was 3.11 hours. The expenditure on plant protection chemical was to the extent of 319.07. Human labour was mainly required in sowing, intercultivation and harvesting including threshing operations. As these operations were labour intensive and required more number of human labours. Bullock labour (10.24 pair day) was also a main in component in land preparation crop production and was mainly used in ploughing, harrowing and sowing operations.
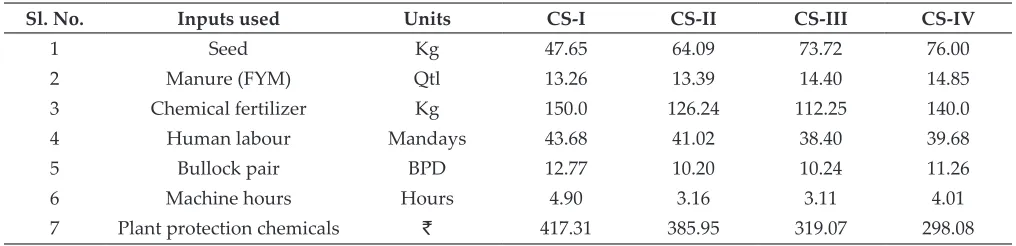
Table 2: Input use pattern under soybean based cropping systems (Per hectare)
Sl. No. Inputs used Units CS-I CS-II CS-III CS-IV
1 Seed Kg 47.65 64.09 73.72 76.00
2 Manure (FYM) Qtl 13.26 13.39 14.40 14.85
3 Chemical fertilizer Kg 150.0 126.24 112.25 140.0
4 Human labour Mandays 43.68 41.02 38.40 39.68
5 Bullock pair BPD 12.77 10.20 10.24 11.26
6 Machine hours Hours 4.90 3.16 3.11 4.01
Similarly, in case of CS-IV, the average quantum of seed usage was 76.00 kg, farmyard manure of 14.85 q and chemical fertilizer used to the extent of 140.00 kg per hectare. The average human labour employed in CS-IV was 39.68 mandays and the bullock pair days used was 11.26 and on an average, the machine labour used in CS-IV was 4.01 hours. The PPC used by the farmers was 298.08. The quantity of farmyard manure used by the farmers per hectare was 14.85 q. It may be due to the non-availability of cash with the farmers during peak season. Chemical fertilizer used by the farmers per hectare was 140.00 kg of fertilizer the main reason for using less quantity of inputs were, lack of technical guidance about cropping system and level of awareness of seed rates and fertilizer dosage. Hence, there is need to have a separate package of practice book on cropping systems which may help the educated farmers to adopt suitable cropping system in the study area. Further, more and more
training programmes or seminars may be planned to educate the farmers about the proper use of inputs.
Labour utilization pattern in different soybean based cropping system
The per hectare quantities of labour used in different operations under cropping system-I is presented in Table 3. In CS-I, the farmers used 43.68 mandays of human labour, followed by 12.77 pair days of bullock labour and 4.90 hours of machine labour per hectare. These three operations were the most labour intensive operations. One more important labour intensive operation was intercultivation, on an average 7.18% of human labour was used in intercultivation operation. The study revealed that, frequent intercultivation may reduce the weed
infestation and indirectly help to increase the net
returns of the farmers through increase in yield. The labour intensive operations were harvesting
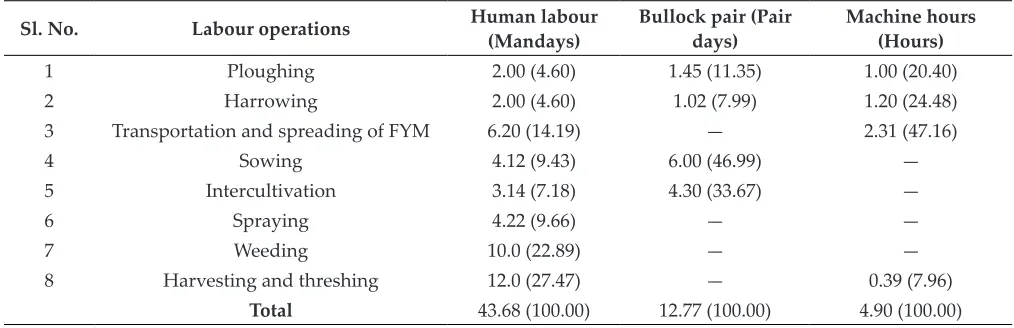
Table 3: Operation wise labour use pattern in CS-I (Soybean + Redgram) (Per hectare)
Sl. No. Labour operations Human labour (Mandays) Bullock pair (Pair days) Machine hours (Hours)
1 Ploughing 2.00 (4.60) 1.45 (11.35) 1.00 (20.40)
2 Harrowing 2.00 (4.60) 1.02 (7.99) 1.20 (24.48)
3 Transportation and spreading of FYM 6.20 (14.19) — 2.31 (47.16)
4 Sowing 4.12 (9.43) 6.00 (46.99) —
5 Intercultivation 3.14 (7.18) 4.30 (33.67) —
6 Spraying 4.22 (9.66) — —
7 Weeding 10.0 (22.89) — —
8 Harvesting and threshing 12.0 (27.47) — 0.39 (7.96)
Total 43.68 (100.00) 12.77 (100.00) 4.90 (100.00)
Table 4: Operation wise labour use pattern in CS-II (Soybean + Jowar) (Per hectare)
Sl. No. Labour operations Human labour (Mandays) Bullock pair (Pair days) Machine hours (Hours)
1 Ploughing 2.00 (4.90) 1.0 (9.80) 1.0 (31.64)
2 Harrowing 2.00 (4.90) 1.0 (9.80) —
3 Transportation and spreading of FYM 6.50 (15.84) — 2.0 (63.30)
4 Sowing 5.00 (12.80) 3.20 (31.38) —
5 Intercultivation 6.49 (15.82) 5.0 (49.01) —
6 Spraying 5.14 (12.53) — —
7 Weeding 6.69 (16.30) — —
8 Harvesting and threshing 7.20 (17.55) — 0.16 (5.06)
and threshing which accounted for about 27.47%, followed by weeding (22.89%), transportation and spreading of farmyard manure (14.19%), spraying (9.66%), sowing (9.43%), intercultivation (7.18%), harrowing (4.61%) and ploughing (4.60%) respectively. The use of bullock pair days was found to be highest in sowing (46.99%), followed by intercultivation (33.67%), ploughing (11.35%), and harrowing (7.99%) operations. The machine labour was mainly used for transportation of farmyard manure which was found to be the highest (47.16%), followed by harrowing (24.48%), ploughing (20.40%) and harvesting and transportation of produce (7.96%). The use of machine labour for farmyard manure transportation may help to carry huge quantities of FYM in a shorter period of time compared to cart load as opined by the sample farmers. The similar results were reported Vishwanath (2005) while studying an economic analysis of threshing of maize crop in Karnataka:
a comparative study of mechanical v/s traditional threshing.
The quantity of human labour used in different operations under cropping system-II is presented in the Table 4. On an average, the farmers used 41.02 mandays of human labour, followed by 10.20 pair days of bullock labour and 3.16 hours of machine labour per hectare. Labour intensive operations among the different operations were harvesting and threshing which accounted for about 17.55 per cent, followed by weeding (16.30%), transportation and spreading of FYM (15.84%), intercultivation (15.82%), spraying (12.53%), sowing (12.80%), harrowing (4.90%) and ploughing (4.90%). These three operations were the major labour intensive operations as opined by the farmers during survey. Here, transportation of farmyard manure included loading and unloading of FYM and harvesting included threshing activity. In this cropping system, Table 5: Operation wise labour use pattern in CS-III (Soybean + Bajra) (Per hectare)
Sl. No. Labour operations Human labour
(Mandays)
Bullock pair (Pair days)
Machine hours (Hours)
1 Ploughing 2.00 (5.20) 1.00 (9.80) 1.0 (32.15)
2 Harrowing 2.00 (5.20) 1.00 (9.80) —
3 Transportation and spreading of FYM 5.24 (13.65) — 2.0 (64.30)
4 Sowing 4.46 (11.61) 3.20 (31.25) —
5 Intercultivation 5.23 (13.62) 5.04 (49.21) —
6 Spraying 5.48 (14.30) — —
7 Weeding 7.17 (18.70) — —
8 Harvesting and threshing 6.82 (17.80) — 0.11 (3.54)
Total 38.40 (100.00) 10.24 (100.00) 3.11 (100.00)
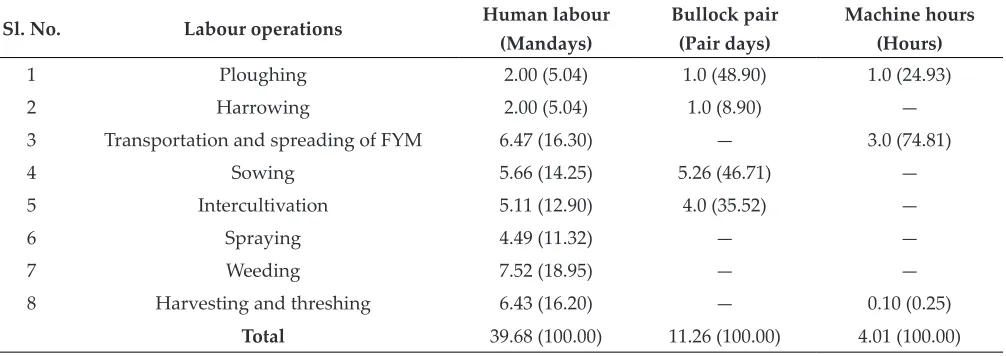
Table 6: Operation wise labour use pattern in CS-IV (Soybean sole) (Per hectare)
Sl. No. Labour operations Human labour
(Mandays)
Bullock pair (Pair days)
Machine hours (Hours)
1 Ploughing 2.00 (5.04) 1.0 (48.90) 1.0 (24.93)
2 Harrowing 2.00 (5.04) 1.0 (8.90) —
3 Transportation and spreading of FYM 6.47 (16.30) — 3.0 (74.81)
4 Sowing 5.66 (14.25) 5.26 (46.71) —
5 Intercultivation 5.11 (12.90) 4.0 (35.52) —
6 Spraying 4.49 (11.32) — —
7 Weeding 7.52 (18.95) — —
8 Harvesting and threshing 6.43 (16.20) — 0.10 (0.25)
one more human labour intensive operation was intercultivation and for this operation on an average 15.82 per cent of human labour was used. The use of bullock pair was found to be the highest in inter cultivation operation (49.01%) followed by sowing (31.38%), harrowing (9.80%) and ploughing (9.80%). The machine labour was mainly used for transportation and spreading of FYM (63.30%), followed by ploughing (31.64%). The farmers preferred to carryout sowing operations with the bullock labour because farmers owned bullock pairs and also they have been following this practice since time immemorial. The machine labour was mainly used for transportation of farmyard manure and that accounted for about 63.30 per cent as the, use of machine labour for transporation of farmyard manure is advanageous to carry huge quantities of FYM in shorter period of time compared to cart load.
The quantity of human labour used in different operations of cropping system-III is presented in Table 5. On an average, the farmers used 38.40 mandays of human labour followed 10.24 pair days of bullock labour and 3.11 hours of machine labour per hectare. The intensive human labour operations was weeding which accounted for about 18.70 per cent, followed by harvesting and threshing (17.80%), spraying (14.30%), transportation and spreading of FYM (13.65%), intercultivation (13.62%), and sowing (11.61%). The ploughing and harrowing operation accounted each 5.20 per cent of total human lands used. The use of bullock labour was found to be the highest for inter cultivation (49.21%) followed by sowing (31.25%), ploughing (9.80%) and harrowing (9.80%). The machine labour used for transportation and spreading of FYM (64.30%) was the highest followed by ploughing (32.15 %). The transportation of farmyard manure included loading and unloading of FYM and harvesting included threshing activity. In this cropping system, one more human labour intensive operation was intercultivation and for this operation on an average 13.62 per cent of human labour was used. Farmers use to carry the inter cultivation frequently as it
reduces the weed infestation and indirectly help to
increase the net returns of the farmers.
The per hectare quantities of labour used in different operations of cropping system-IV is presented in the Table 6. In all, farmers used 39.68 mandays of
human labour 11.26 pair days of bullock labour and 4.01 hours of machine labour per hectare in the study area. The labour intensive operations were weeding which was found to be 18.95 per cent, followed by transportation and spraying of FYM (16.30%), harvesting and threshing (16.20%), sowing (14.25%) and intercultivation (12.90%). The bullock
pair used for sowing was found to be highest
(46.71%), followed by intercultivation (35.52%), ploughing (8.90%) and harrowing (8.90%). The machine labour was mainly used for transportation of farmyard manure which was 74.81 per cent followed by 24.93 per cent in case of ploughing operation. Transportation of farmyard manure included loading and unloading of FYM and harvesting included threshing activity. In an average 12.90 per cent of human labour was used for inter cultivation. The machine labour was mainly used for transportation of farmyard manure and that accounts for about 74.81 per cent and 24.93 per cent for ploughing.
Conclusion
The literacy percentage was highest in CS-I followed by CS-IV, CS-II and CS-III respectively. The input utilization pattern under soybean based cropping systems was more or less equal to the recommended level. The fertilizer utilized was more in cropping system-II. Whereas it was bullock labour which was found to be highest in CS-III followed by bullock labour used in cropping system-III was found to be the highest. The machine labour in cropping system-IV was found to be highest. The labour utilization pattern varied from one cropping system to another cropping system. In all the cropping systems, it was observed that the human labour utilized was more compared to bullock labour and machine labour.
References
Aski, S.H., Gotyal, S.H., Patil, M.B. and Hanumanaikar, R.H. 2010, Knowledge and its relationship with personal, socioeconomic and psychological characteristics of sunflower growers of Bijapur district. Agric. Update., 5(3-4): 430-432.
Godwin, A.A., Djomo, R.F. and Okpachu, S.A. 2011, Evaluating the constraints and opportunities of maize production in the west region of Cameroon for sustainable development. J. Sustainable Dev. Africa., 15(13): 189-191. Narayanmoorthy, A. 2000, Farmer ’s education and
Ranbir Singh, Ashok Kumar, Chnillar, R.K. and Rana, 2002. The study on production potential and economics of maize based on cropping system. Indian J. Agric. Sci., 72(3): 156-157.
Reddy, A.R. and Sen, C. 2004. Technical inefficiency in rice production and its relationships with farm-specific socio-economic characteristics. Indian J. Agric. Econ., 59(2): 259-267.