A Distributed Power Management Design
Based on MOST Networks
Yushan Jin1, 2, Ruikai Liu1, Xingran He1, and Yongping Huang1, 2
1
College of Computer Science and Technology, Jilin University, Changchun 130012, P.R. China
2
Key Laboratory of Symbolic Computation and Knowledge Engineering of Ministry of Education,
Jilin University, Changchun 130012, P.R. China [email protected]
Abstract. MOST (Media Oriented Systems Transport) protocol is a high-speed multimedia bus protocol. The system can make more and more media devices in the car automatically collaborate, sharing of audio, video and other data, but its own power consumption has not been a better optimization. In the paper, depending on the network management and the notification mechanism, a distributed power management solutions was designed that the slave nodes can sleep independently and the master node manages the network state, and the wake-up mechanisms in the sleep state were proposed. A mathematical modeling and analysis of MOST networks power were built in MATLAB. This program takes full advantage of MOST network protocol for the intelligent management. Simulation results shown that, with the increasing number of nodes in MOST, energy saving become more effective. More than 20% power saved can be achieved with distributed power management solution in 8-node MOST.
Keywords: power management, MOST, notification, distributed management.
1.
Introduction
framework that simplifies the development of complete systems and applications to distribute and manage multimedia content [1].
It solved some problems about the complexity of car wiring, the increase of the weight and EMI of cars. Although its roots are in the automotive industry, MOST can be used for applications in other areas such as other transportation applications, A/V networking, security and industrial applications. With the devices increasing, it has become a very serious problem that the power cost of MOST enlarged greatly. In some cases, we can reduce system power consumption actually. For example, when using a car phone, all the audio equipment should be shut down.
The current power management is ensured by a central controller in which a program is implemented. This centralized management is based on a „„top–down‟‟ approach. The master node as a central controller switched the system state between running, standby and sleep [2].In this mode, as long as there is a node in work, the entire network is running. Only all the nodes have not the task, the system will sleep or be shut down. The centralized management requires the designer of the control system to be exhaustive in the control flow written in the program. If an event not covered by the system occurs it is unable to respond adequately. Moreover, if the configuration has to be changed (addition or removal of a node), the program must be completely redesigned. So the effect of energy saving with the centralized power management solution is low and not obvious. Therefore this paper gives a more intelligent power management solution based on a „„bottom–up‟‟ approach. Every slave node controls its state based on the event, and shares the changes with the other nodes [3]. On the basis of the overall management, we added the control of each node, only to maintain the current working node. In last the design achieved minimum power consumption across the network and reached the green energy-conserving results.
This paper makes the following specific contributions:
Depending on the network management principle and the notification mechanism, a distributed power management solution was designed that the slave nodes can sleep independently and the master node manages the network state, and the wake-up mechanisms in the sleep state were proposed.
A mathematical modeling and analysis of MOST networks power were built in MATLAB. After executing the same sequence of tasks generated randomly, the total cost of MOST based on a distributed power management is shown.
2.
Related Works
MOST is a novel network architecture which is designed for high quality of service and efficient transport of audio and video,so related research in MOST is poor and the references on the power management of MOST were very limited. So the related work we focused on was MOST principle and application of power management in other projects.
The centralized management In MOST principle was implemented by a PowerMaster(master node). It broadcasts a query message to each node to make sure whether every node is already to be shut down [2][4]. It was accomplished by a poll procedure so that there would be a heavy load on the bus. The „„top–down‟‟ approach results in the weaknesses such as bad fault tolerance of an element, high operating costs and so on.
Distributed management idea has been introduced by various systems. The distributed management solution was proposed as an application of multi-agent (MAS) to power management in a hybrid power source [3] [5]. Various photovoltaic generator, super-condensators, batteries and grids regarded as agents were developed individually, and communicated between each other for ensure cohesion of the system. A multi-agent system was proposed for a distributed smart grid whose message exchange is designed to be compatible with an IP-based network [6].
In wireless network, [7] demonstrated Busy-time power consumption of 802.11 interfaces can be dramatically reduced by judiciously putting the interface into a power-saving mode for idle intervals as short as several microseconds. Cell2Notify was presented to minimize energy consumption by powering off the Wi-Fi interface when there is no VoIP call in progress, and powering it on only on the reception of an incoming VoIP call [8]. Proxy architecture was proposed for reducing energy waste based on network traffic patterns and user presence indicators [9]. Sleeping and rate adaptation are valuable [10] depending on the power profile of network equipment and the utilization of the network itself for reducing network energy. A power assignment was found, which induced communication graph is an energy t-spanner, and its cost is bounded by some constant times the cost of an optimal power assignment [11].Neighborhood-based Power Management was proposed for conserving energy by allowing neighbors of the signaling node to send data opportunistically [12]. A predictive control algorithm was developed which, in an online fashion, determines the transmission power levels and codebooks to be used by the sensors [13], it conserved sensor energy well.
3.
MOST Transmission Principle
3.1. MOST Structure
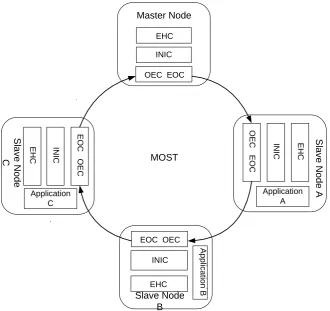
MOST system is a ring network, which is composed of device nodes connected each other by optical fiber. The node communicates with the MOST ring network through optical-to-electrical transducer. The connection between each node is reciprocal, one-way and point to point. So there is only one path between two nodes. The data frame is transmitted in the direction fixed in the network.
In the MOST network nodes can be divided into the master node and the slave nodes. The master node is the network master controller and the interface between the network and external application. The slave node receives the control message (such as volume tuner) from the master node, able to manage one or more network function [2].
Master Node
INIC
OEC EOC
MOST EHC O E C E O C E H C IN IC Application A S la v e N o d e A E O C O E C E H C IN IC Application C S la v e N o d e C Slave Node B INIC EOC OEC
EHC A p p lic a tio n B
The MOST system uses either 44.1 KHZ or 48 KHZ sample rates for transmitting digital audio signals in hi-fi quality. Devices with a different sample rate can be adapted to the networks by mans of a sample rate conversion. Since the MOST system transmits the audio data synchronously, additional data buffering is not needed and complexity of the device is reduced, thus saving costs.
A MOST25 frame consists of 512 bits or 64 bytes. Sixty bytes are used for the transmission of synchronous and asynchronous data. Two bytes transport part of the control message that is made of a total of 32 bytes for the administration of network and notes. The control message is transported over 16 frames that are combined into one block [14]. The first and the last bytes contain control information for the frame. Synchronous and asynchronous areas that share a total of 60 bytes are available in a frame for transmitting streaming and packet data. The bandwidths of the two areas can be adapted to their corresponding requirements by means of boundary descriptor. The boundary between the two areas can be shifted in steps of 4 bytes (a quadlet). The synchronous area can thus have a width of between 24 and 60 bytes and the asynchronous area a width of between 0 and 36 bytes.
3.2. MOST Network Management
The workflow of the MOST networks include: Wake-up start, system initialization, notification, connection management [4].
The components of the MOST system are woken up by a light signal received via the RX diode of the FOT. Basically all components can wake up the network. After a wake-up, the network master first of all builds up the communicative relations to the slave components via a system scan.
If there is a stable lock, the network master starts quarrying all nodes present about their function blocks. It addresses each physical node address and uses the physical node position address as instance. The network master stores the information by quarrying the node in the Central Registry [15] [16]. It is filled with the logical address and the corresponding function blocks of all nodes. As soon as there is a valid system status, the stored information is available for all participants in the ring, the network master can then compare with a previously stored registry and detect possible changes of the current network configuration.
If the Central Registry has not changed after the last system run, the network master sends the massage Configuration.status(OK).The notification of this status means for all nodes that the Central Registry can be quarried. The slave components can then establish their communicative relations with each other [17] [18].
stored in a table, the Notification Matrix which is implemented in the network service layer 2 [15].
4.
Design and Implementation
In this section, hardware and software design were given. Hardware design includes selection and application of components, interface design. Software design was divided into three subsections: Slave Nodes Sleep, Network Shutdown, Waking from Device Shutdown.
Power management
CD
Local Wakup BatConP
Local Wakup
Power Master
HMI
Local Wakup Battery
Continuous Power(BatConP)
Clamp Status
Power management
Radio
Local Wakup BatConP
Power management
Amplifier
Local Wakup BatConP
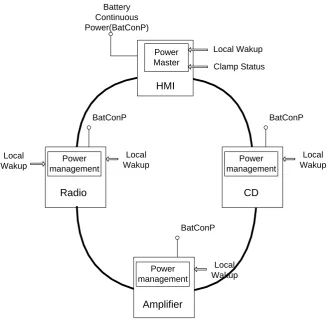
Fig. 2. Power Management Structure Diagram of MOST
time threshold, the master power management module will make the entire network sleep. Any local wake-up signals from the slave node or the master node can wake up the whole network. The Wake-up signal was transmitted in the direction fixed in the network and the nodes were waked up one by one. The power management structure of the MOST networks is shown in Figure 2.
4.1. Hardware Design
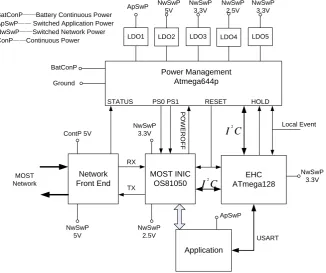
In the node‟s power management model, the FOR (Fiber Optic Receiver) receives continually the messages from the network to detect the occurrence of the events. So as the controller the power management works without any break. Therefore, the FOR and the power manager are out of power management, and always in a working state. INIC, EHC, and applications are the managed part, which can be set to power, sleep or power-down mode.
Power Management Atmega644p
BatConP Ground
BatConP——Battery Continuous Power ApSwP—— Switched Application Power NwSwP——Switched Network Power ConP——Continuous Power
Network Front End
MOST INIC OS81050
EHC ATmega128
MOST Network
ContP 5V
NwSwP 5V
Application
STATUS PS0 PS1 RESET
C
I2
C
I2
HOLD
Local Event
ApSwP
USART
NwSwP 3.3V
NwSwP 2.5V NwSwP
3.3V
RX
TX
LDO1 LDO2 LDO3 LDO4
ApSwP NwSwP 5V
NwSwP 3.3V
NwSwP 2.5V
LDO5 NwSwP
3.3V
P
O
W
E
R
O
F
F
Fig. 3. Hardware Structure of Power Management Module
and provides the corresponding API functions to application layer. The master controller ATmega128 focuses on the data controlled processing and the entire network management. In the design of power module interface, we set two external interrupt as a wake-up trigger and a closing network interrupt signal. At the same time two reset control ports were established for INIC and EHC. The data transferred between EHC and the power management Module is two-way. So we select the I2C serial bus as the communication which is simple and effective. Foregoing considerations, ATmega644 is quite fit for the control chip of the power management module, which controls the LDO on and off, to provide intermittent power supply for devices. The hardware structure was shown in Figure 3.
The wake-up process started from the network front end or the local event. Network front end received light signals from the network, and sent an external interrupt STATUS to the Power Management Module ATmega644. So the node was waked up. The ATmega644 has begun to trigger the LDOs to supply the other parts with power. The local event is also an external interrupt which can wake up the EHC and power management directly. The 2-wire Serial Interface (TWI) which is compatible with the I2C protocol is ideally suited for typical microcontroller applications. The TWI protocol allows the systems designer to interconnect up to 128 different devices using only two bi-directional bus lines, one for clock (SCL) and one for data (SDA). The EHC is master and the INIC and the ATmega644 are the slave in communication. They all receive and transmit the commands. When the EHC is deciding whether to wake up the network, HOLD is used to maintain power supply in the active state.
4.2. Software Design
Software design must be considered from the whole and part. The master node manages the entire power supply of the network, or shuts down the entire network. The slave node has its own power management features. When there is no command to be executed, the slave node can send a message to the master node and then automatically sleep [21].
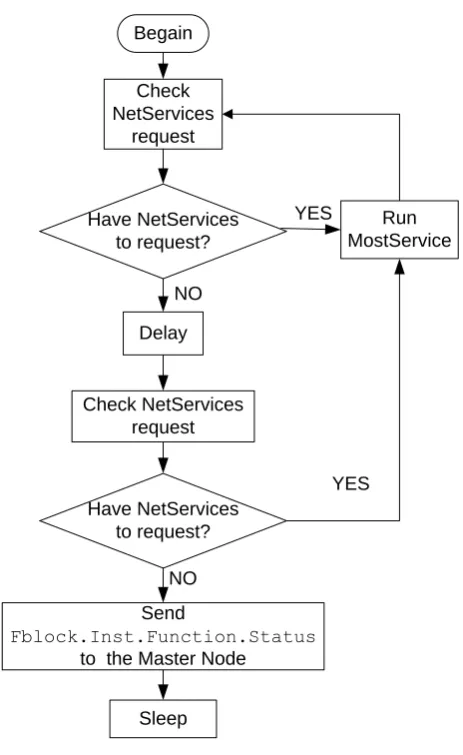
4.2.1. Slave Nodes Sleep
When a node has no transactions from request to NetServices, after a delay of inquiry, still no transaction request, the node can be ready to go to sleep. Before sleeping, the node must release the information to the network through the Notification Mechanism [15]. The master node sends
FBlockID.Inst.Notification.Set(DeviceID, FktID) to each node,
so the Notification Mechanism about the sleep state property was launch.
FBlockID mans the position of the sleep function module; DeviceID is the
function of the sleep property. The slave node set the notification matrix and
equipment matrix through the function
NtfSetNotificationMatrix(*tx_ptr,*rx_ptr), then send
FblockID.Inst.Function.Status (Paramerer Values) to inform the
master node that the sleep property has been changed, in which Parameter Values is the value of the property. The slave node calls the function
NtfPropertyChanged (device_index_tab_pt) which mans some
changes occurred in the property. The corresponding parameter
device_index_tab_ptr points to the sleep property in the notification
matrix. The NTFS [22] services ware called for the message processing. Then contrasted to the notification matrix of the master node, the master node will know the slave node preparing to go to sleep.
Begain
Check NetServices
request
Run MostService
Send
Fblock.Inst.Function.Status
to the Master Node
Sleep Delay
Check NetServices request
Have NetServices to request?
YES
YES NO
NO Have NetServices
to request?
When the slave node is Stand-by state, the external control module Interface (EHCI) is semi-protected. In this state the EHC can not access the network and communicate with the other nodes. It allows, however, full access to the Fblock INIC. EHC can configure the INIC and open ports, such as the streaming Port. Sleep is the EHCI is protected. The other nodes in MOST networks can not access this node‟s EHC and the communication between EHC and with INIC is also limited. In both states, for the message asked from the MOST networks, NBMIN will return an empty list as the message response.
4.2.2. Network Shutdown
Begain
Update notification matrix, counter plus one
A node to sleep?
Count Is the total number?
Delay
No request or wake-up Signal?
Shut down the ring
Network Management
,counter minus one YES
YES
NO YES
NO
NO
Fig. 5. Flow Chart of Network ShutDown
TIMER0 will overflow and trigger interrupts, then the interrupt service program
ISR(TIMER0_OVF_vect) will be called. For avoiding that devices have to
save their status to persistent memory very often, the master node procedure ShutDown has two stages (request and execution). After interrupt, the master waits for tShutDownWait before it sends NetBlock.ShutDown.Start(Query).
If no respond on NetBlock.ShutDown.Start(Query), the execution will be announced by the master node by starting NetBlock.ShutDown.Start
(Execute).Then the network shutdown was completed, which is shown by
Figure 5.
4.2.3. Waking from Device Shutdown
The device can be woken up by the master node or the slave node itself. If the device waked up by master node, the master node sends
NetBlock.ShutDown.Start(WakeFromDeviceShutDown) to the slave
nodes firstly. The FOR in INIC receives the message from optical fiber and wakes its application (EHC) by signaling an external interrupt STATUS. Then the NBEHC registers its own Fblocks using FblockIDs.Status
(FblockIDList) to the master node, when the master node responds the
new Fblocks, the device can be used.
The internal Wakeup is similar to the Wakeup by the master node. They are different in that the application was waked up by local events. After it, the device registers its own Fblocks using FblockIDs.Status
(FblockIDList), when the system state is OK or when explicitly by the
master node. As soon the master node responds the new Fblocks they can be used.
5.
Simulation Test
In this section, the model of most cost was created and the control algorithm was programmed by MATLAB. Based on the model, the cost of 4-node MOST, 6-node MOST and 8-node MOST were simulated, which driven by different types of events. Analysis of images and data are essential.
5.1. Modeling
also starts to work. So there are not events set for the amplifier node. “B” also generates 10 random numbers as the time interval of the 10 events.
Pdistributed means the power cost of MOST with the distributed power
management; Pcentralized means the power cost of MOST with the centralized
power management; PD1, PD2, PD3, PD4 identify the real-time power of the master node, the CD node, the radio node, and the amplifier node with the distributed power management, respectively. PL1, PL2, PL3, PL4identify the real-time power of the master node, CD node, radio node, and the amplifier node with the centralized power management respectively; Pmin is the power of
each node in sleep, whose device has be turned off; P1‟, P2‟, P3‟, P4‟denote
respectively the power of the master node, CD node, radio node, and the amplifier node with all parts of module running. P1
‟‟
, P2 ‟‟
, P3 ‟‟
, P4‟‟denote
respectively the power of the master node, CD node, radio node, and the amplifier node with the device shut off but the others running [23].
Distributed D1 D2 D3 D4
P
P
P
P
P
(1) 2
2 min
0 A i 6
Else D
P
P
P
(2) 3 3
min
A i >6
Else D
P
P
P
(3) 4 4
min
A i 0
Else D
P
P
P
(4) 1 1
min
A i 0
Else D
P
P
P
(5)
centralized L1 L2 L3 L4
P
P
P
P
P
(6) 2
2 min
2
0 A i 6
A i 0
L Else
P
P
P
P
(7)
3
3 min
3
A i >6
A i 0
L Else
P
P
P
P
4 4
min
A i 0
Else L
P
P
P
(9) 1 1
min
A i 0
Else L
P
P
P
(10)△P is the difference of power consumption between the two methods:
d centralized min 3min 2
0 ; ( ) 0
; 0 ( ) 6
; ( ) 6
istributed
A i
P A i
A i
P
P
P
P
P
P
(11)
It can be seen from the formula (11), when no event request, △P = 0, which shows the power consumption of two methods is same. Now the system with two methods is also in sleep state. After examination, Pmin =0.3w; P2
‟‟
=P3 ‟‟
=0.4w. So when the CD or the radio node has a request, △P <0, that means the power consumption of MOST system with the distributed power management is less than the power consumption of MOST system with the traditional power management.
5.2. Simulation Results
Based on the model, experiments were conducted and the simulation images were given by MATLAB. The random sequences were created in simulation for 4-node MOST:
A= [0 7 4 9 4 4 8 5 2 6;];
B= [98 70 163 73 27 40 39 121 54 39;]; The corresponding graph is Figure 6.
In figure 6, P(distributed) is the power cost of MOST system with the distributed power management. P(centralized) is the power cost of MOST system with the centralized power management. It can be seen from the figure the minimum power consumption is 1.2W, when the system is not the task request, the minimum power consumption of the two methods is also 1.2W. When a task requests the radio, P(distributed)=2.1W< P(centralized)=2.0W. When a task requests the CD, P(distributed)=2.3W< P(centralized)=2.4W.
0 100 200 300 400 500 600 700 800 1
1.5 2 2.5 3 3.5
Time(S)
T
h
e
P
o
w
e
r
C
o
st
(W
)
The Real-time Power Cost of MOST(4 nodes)
P(distributed) P(centralized)
Fig. 6. Simulation Power Cost of 4-node MOST
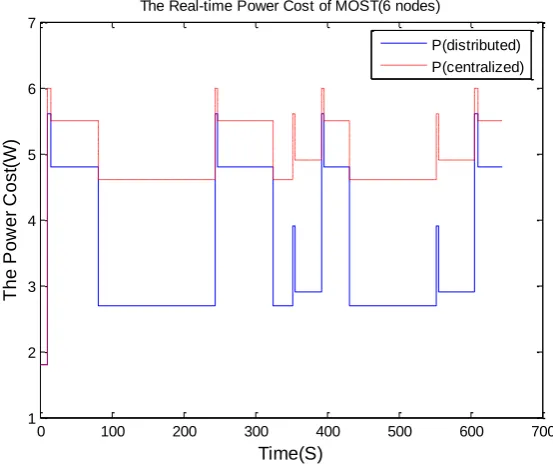
0 100 200 300 400 500 600 700 1
2 3 4 5 6 7
Time(S)
T
h
e
P
o
w
e
r
C
o
st
(W
)
The Real-time Power Cost of MOST(6 nodes)
P(distributed) P(centralized)
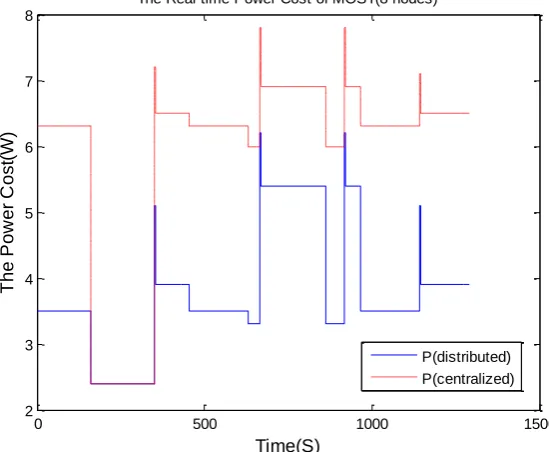
We also obtained an 8-node MOST system by adding a MP3 node and a telephone node into 6-node MOST. The corresponding simulation result is Figure 8.
As Figure 6 shown, P(distributed) curve is close to P(centralized) curve, the energy saving result is not apparent. Figure 7 illustrates a better result than Figure 6 and Figure 8 indicated the best effect. P(distributed) curve was obviously lower than P(centralized) curve in Figure 8. After the contrast and analysis of Figure 6, Figure 7 and Figure 8, we found that the more nodes in MOST networks, the greater effect achieved by distributed power management. So a classified summary of statistical data was completed to prove it.
0 500 1000 1500
2 3 4 5 6 7 8
Time(S)
T
h
e
P
o
w
e
r
C
o
st
(W
)
The Real-time Power Cost of MOST(8 nodes)
P(distributed) P(centralized)
Fig. 8. Simulation Power Cost of 8-node MOST
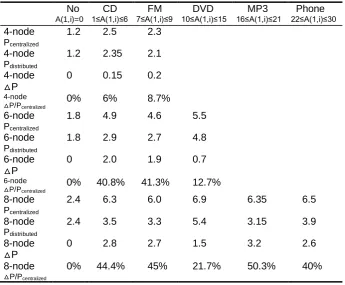
Table 1 shows the cost of three MOST systems based on centralized management and distributed management. A(1,i) as an element of random event matrix A denotes the type of event.Firstly, no matter how many nodes in MOST, Pcentralized equals Pdistributed when no events request, △P=0. As long as
there is an event to process, Pdistributed is smaller than Pcentralized. This is due to
MOST, the MP3 and amplifier node set up the communication between each other and the master node still run for supervision, while the other five nodes can be shut down. Compared with the centralized management, the distributed management saved more energy from five nodes, especially for high power node such as DVD. This explained the reason: the more nodes in MOST networks, the greater effect achieved by distributed power management.
It can be seen from Figure 6, Figure 7, and Figure 8, when switching task between nodes or waking up from sleep, the power consumption of system increased dramatically, because the current peak appears.
Table 1. Comparisons of Various System Energy Saved
No A(1,i)=0 CD 1≤A(1,i)≤6 FM 7≤A(1,i)≤9 DVD 10≤A(1,i)≤15 MP3 16≤A(1,i)≤21 Phone 22≤A(1,i)≤30 4-node Pcentralized
1.2 2.5 2.3
4-node Pdistributed
1.2 2.35 2.1
4-node △P
0 0.15 0.2
4-node
△P/Pcentralized
0% 6% 8.7%
6-node Pcentralized
1.8 4.9 4.6 5.5
6-node Pdistributed
1.8 2.9 2.7 4.8
6-node △P
0 2.0 1.9 0.7
6-node
△P/Pcentralized 0% 40.8% 41.3% 12.7%
8-node Pcentralized
2.4 6.3 6.0 6.9 6.35 6.5
8-node Pdistributed
2.4 3.5 3.3 5.4 3.15 3.9
8-node △P
0 2.8 2.7 1.5 3.2 2.6
8-node
△P/Pcentralized
0% 44.4% 45% 21.7% 50.3% 40%
Only when the total power saving of the system is greater than the power consumption of switching the state and start-up, the power management is effective. We set Pu is the system power during wake-up, Pw is the power of
the working process, Pe is the power of the system into sleep, Ps is the system
power in sleep, Tsd is the time to sleep, Twd is the wake-up time, and Tth is the
limit time of a effective power management. So we have:
u
u
( ) ( ) ( ) ( )
( ( ))
w wd w e sd w s wd sd
wd e sd s sd wd th w s
t
t
P P T P P T P P T T P T P T P T T T
P P
Fig.9.Energy Saved Efficiency Based on Various Events 0%
10% 20% 30% 40% 50% 60%
No CD FM DVD MP3 Phone
Events
4-node △P/ Pcentralized 6-node △P/ Pcentralized
8-node △P/ Pcentralized
Fig. 9. Comparison of Energy Saved Based on Various Events
We obtained from the formula (12), free time interval must be greater than Tth, and the system could go to sleep. Otherwise, the energy consumed when
the wake-up will be more than the energy savings, so the management is useless. Switching state too often will make the system of energy consumption higher, we selected time valve for 10 seconds.
6.
Conclusions
In this paper, the objective of the distributed power management program is that the node can control separately its state in the absence of task requests, regardless of the status of other nodes. The traditional management model is a master switch. Each node can not manage separately, which results that the node still work without the task, waste of the energy. As can be seen from the test, when there are tasks in the system, distributed power management is always superior to the traditional power management. As the system will perform a task, not all nodes need to participate, so we can close some idle nodes to save energy.
References
1. Grzemba, A.: Annual Achievement Report 2010. [Online]. Available:http:// www.mostcooperation.com/publications/brochures_newsletters/archive/index.html ?backurl=%2Fhome%2Findex.html (current March 2011)
2. Grzemba, A.: MOSTSpecification_3V0E2. (2010). [Online]. Available:http:/ /www.mostcooperation.com/publications/Specifications_Organizational_Procedure s/index.html?doc=4425&dir=291 (current March 2011)
3. Lagorse, J., Paire, D., Miraoui, A.: A multi-agent system for energy management of distributed power sources. Renewable Energy, vol. 35, no1, 174-182. (2010) 4. Grzemba, A.: MOST - The Automotive Multimedia Network- From MOST25 to
MOST150. Deggendorf.140-152.(2008)
5. Jun, Z., Junfeng, L., Jie, W., Ngan, H. W.: A multi-agent solution to energy management in hybrid renewable energy generation system. Renewable Energy, Volume 36, Issue 5, Pages 1352-1363. (2011)
6. Pipattanasomporn, M., Feroze, H., Rahman, S.: Multi-Agent Systems in a Distributed Smart Grid: Design and Implementation. Proc. IEEE PES 2009 Power Systems Conference and Exposition (PSCE‟09), Seattle, Washington, USA, 1 – 8, 15-18 .(2009).
7. Jiayang, L., Zhong, L.: Micro Power Management of Active 802.11 Interfaces. Proceeding of the 6th international conference on Mobile systems, applications, and services,New York,146-159.(2008)
8. Agarwal, Y., Chandra, R., Wolman, A., Bahl, P., Chin, K., Gupta, R.: Wireless wakeups revisited: energy management for voip over wi-fi smartphones. MobiSys '07 Proceedings of the 5th international conference on Mobile systems, applications and services, New York, NY, USA ,179-191.(2007)
9. Nedevschi, S., Chandrashekar, J., Liu, J., Nordman, B., Ratnasamy, S., Taft, N.: Skilled in the Art of Being Idle: Reducing Energy Waste in Networked Systems. Proceedings of the 6th USENIX symposium on Networked systems design and implementation, USENIX Association Berkeley, CA, USA , 381-394.(2009) 10. Nedevschi, S., Popa, L., Iannaccone, G., Ratnasamy, S., Wetherall, D.: NSDI'08
Proceedings of the 5th USENIX Symposium on Networked Systems Design and Implementation, USENIX Association Berkeley, CA, USA ,323-336.(2008)
11. Aschner, A., Katz, C.: Minimum Power Energy Spanners in Wireless Ad Hoc Networks, INFOCOM, 2010 Proceedings IEEE, San Diego, CA , On page(s): 1 - 6 ,14-19. (2010)
12. Ashraf, F., H.Kravets, R.: Poster Abstract: Neighborhood-based Power Management. ACM SIGMOBILE Mobile Computing and Communications Review, New York, NY, USA, Volume 13 Issue 3, 30-33. (2009).
13. Ahl n, Q., Stergaard: Energy Efficient State Estimation with Wireless Sensors Through the Use of Predictive Power Control and Coding. Signal Processing, IEEE Transactions on, Volume: 58 Issue: 9, 4811 – 4823. (2010).
14. Grzemba, A.: MOST NetServices Layer I Wrapper for INIC. Karlsruhe, Germany: MOST Cooperation. (2008).
15. Grzemba, A.: MOST NetServices Layer II. Karlsruhe, Germany: MOST Cooperation. (2008)
16. Bo, C., Yong-ping, H., Wei, C.:Design and Implementation of in-Vehicle MOST Control Node. Journal of Jilin University (Information Science Edition), Vol 27,No 5,447-449. (2009)
18. Bo, C., Yong-ping, H., Wei, C., Feng-hua, Z.: MOST-Based in-Vehicle Audio System. Journal of Jilin University (Information Science Edition), Vol 27,No 5,472-475. (2009)
19. Anand,M., Nightingale,E., Flinn, J.:Self-tuning wireless network power management. Proceedings of the 9th annual international conference on Mobile computing and networking. Volume 11 Issue 4. (2005).
20. SMSC Cooperation. MOST OS81050 INIC. (2007) [Online]. Available: http://www.smsc-ais.com/AIS/component/option,com_content:9-20 (current March 2011)
21. Sinha, A., Chandrakasan, A.: Dynamic power management in wireless sensor networks. Design & Test of Computers, IEEE. 18 Issue: 2, on page(s): 62 – 74. (2001).
22. Grzemba, A.: Dynamic Specification. (2007). [Online]. Available: http://www.mostcooperation.com/publications/Specifications_Organizational_Proc edures/index.html?doc=2865&dir=291 (Current March 2011)
23. Dunkels, A., Osterlind, F., Tsiftes, N., Zhitao H: Software-based sensor node energy estimation. Proceedings of the 5th international conference on Embedded networked sensor systems. ACM New York, NY, USA, 409-410. (2007)
24. Srivastava, M. B., Chandrakasan, A. P., Brodersen, R. W.: Predictive system shutdown and other architectural techniques for energy efficient programmable computation. Very Large Scale Integration (VLSI) Systems, IEEE, On page(s):4 , Issue:1,42. (1996)
25. Chi-Hong, H., Wu, A. C. H.: A predictive system shutdown method for energy saving of event-driven computation.ACM Transactions on Design Automation of Electronic Systems, Pages 226-241. (2000)
26. Kusic, D., Kephart, J., Hanson, J., Kandasamy, N., Guofei J: Power and Performance Management of Virtualized Computing Environments via Lookahead Control. Cluster Computing, Volume 12, Number 1, 1-15.(2008).
27. Hiltermann, J., Lodewijks, G., Schott, D. L., Rijsenbrij, J. C., Dekkers, J. A. J. M., Pang, Y.: A Methodology to Predict Power Savings of Troughed Belt Conveyors by Speed Control. Particulate Science and Technology: An International Journal, Volume 29, Issue 1, Pages 14 – 27.(2011)
Yushan Jin, born in 1963. Associate Professor. Her main research interests include intelligent control system and evolvable hardware.
Ruikai Liu, born in 1985. Master. His main research interests include embedded system and automatic control.
Xingran, born in 1984. Master. His main research interests include intelligent control and embedded system.
Yongping Huang, born in 1964. PhD. Associate Professor. His main research interests include embedded system, intelligent control system and IPv6 for Smart Object Networks.