© 2016 IJSRSET | Volume 2 | Issue 4 | Print ISSN: 2395-1990 | Online ISSN : 2394-4099 Themed Section: Engineering and Technology
Implementation and Diffusion Modeling of Selected Renewable
Energy Technologies in India
Mr.
G.JogaRao, Dr. D.K.Mangal
Dr.
S.K.Shrivastava
EEE Department, Sun Rise University, Alwar,Maharashtra, India
ABSTRACT
Energy is the most essential element of socio-economic development and nation‘s economic growth. Renewable energy sources can play an immense role to full fill this need of energy. We see the tremendously energy gap increases, for the mitigation of this energy gap we need to some renewable energy like solar and wind energy. Renewable energy is becoming an increasingly important element of India‘s national energy mix. The huge potentials of the country in renewable energy are recognized as an additional important energy source which can contribute to the key policy objectives of the energy sector, given the ever increasing prices and the shortages in fossil fuel supplies. By diversifying the energy mix in a climate friendly way and by increasing the energy security at the same time, the main benefits of renewable energy for India become obvious. In addition, renewable energy allows for increased energy access to the Indian people, especially in the rural and remote areas, catering to their basic energy needs.Renewable energy technologies can help countries meet their policy goals for secure, reliable and affordable energy to expand electricity access and promote development. renewable energy sources,especially solar and wind energy, are likely to play a significant role in providing reliable andsustainable electricity to consumers. In this regard, different policies could be applied to reducing carbon emissions, such as enhancing renewable energy deployment and encouraging technological innovations. Diffusion of Renewable Energy Technologies (RETs) is governed by the status of the technology in terms of efficiency and techno-economical feasibility. The states plans for the deployment of resources for development, with special reference to sustainable environment and the demand and supply energy model help to provide more focus on the long term goals. This paper reviews the renewable energy scenario of India and extrapolates the future developments keeping in view the consumption, production and supply of power and also presents an approach to apply diffusion modeling technique to review policies supporting Renewable energy technology deployment and use diffusion parameters to provide inputs for designing future programmes. The wind and solar power are selected for detailed analysis. The resultsshow how present trends and future forecasts of electricity-generating technologies change theelectricity generation in the country.
Keywords - Renewable Energy Technology (RET), Diffusion, Wind Power, Solar Power, India, Ministry of New and Renewable Energy (MNRE)
I.
INTRODUCTION
Because of the shortage of fossil fuels, seeking alternative energy sources is an urgent business for a country‘s economic development. There are six major types of renewable energy available in the world, i.e. the solar energy, geothermal energy, wave energy, hydraulic energy, biomass energy and wind energy, which can be converted to electrical power through various devices. Among these, producing electrical power from solar radiation using photovoltaic (PV) cells as well as from wind energy via wind turbines are more popular applications than others. Developing countries face the twin challenge of developing stronger economies through measures such as expanding energy
volume coming from within developing countries. Consequently, in 2008 the aggregate energy‐ related CO2 emissions of developing countries surpassed those of industrialized and transition countries for the first time in history (IEA 2010). Currently, the electricity sector constitutes a major source of energy‐related CO2 emissions, accounting for 41 percent of global CO2 emissions (IEA 2010). This reality clearly makes the reduction of emissions from electricity generation an essential ingredient in any climate change mitigation strategies. The essential characteristic of a sustainable energy system is its ability to deliver required services without exhausting resources. The first step to createsuch a system is to use the existing resources efficiently and increase the use of resources that are renewable. Shifting from non-renewable to renewable energy technologies (RETs) should be the top priority in moving to a sustainable energy system. Increased utilization of RETs will not only meet the growing energy demand but also reduce adverse environmental impacts of energy usage. There are Eight National Missions which form the core of the National Action Plan, representing multi-pronged, long-term and integrated strategies for achieving key goals in the context of climate change. While several of these programmes are already part of our current actions, they may need a change in direction, enhancement of scope and effectiveness and accelerated implementation of time-bound plans. In this paper some of initiatives taken are focus of discussion which are primarily necessary for RET diffusion. The growth of electricity demand coupled with the geographically dispersed nature of many renewable sources makes electricity an attractive energy vector to harness RE where adequate network infrastructure is available. The world energy demand is expected to increase by 35 percent by 2030 from 2005 levels. This increase in demand is driven predominantly by growing population and economic growth in developing countries, even with substantial efficiency gains in all regions. The developing countries account for nearly two thirds of this increase which is spurred by their rapid economic growth.India is both a major energy producer and a consumer. India currently ranks as the world‘s seventh largest energy producer, accounting for about 2.49% of the world‘s total annual energy production. It is also the world‘s fifth largest energy consumer, accounting for about 3.45% of the world‘s total annual energy consumption in 2004. India
1. National Solar Mission (10,000 MW of grid solar capacity; 1000 MW of off-grid solar applications; and 15 Million sq.m. solar concentrators
2. National Mission for Enhanced Energy Efficiency (10,000 MW energy savings by 2012)
3. National Mission on Sustainable Habitats (waste to energy)
4. National Water Mission (20% water use efficiency improvement)
5. National Mission for Sustaining the Himalayan Ecosystem
6. National Mission for a Green India
7. National Mission for Sustainable Agriculture 8. National Mission on Strategic Knowledge for
Climate Change
II.
PRESENT ENERGY SCENARIO IN INDIA
A. Wind Energy
Electrical energy obtained from harnessing the wind with windmills or wind turbines. The development of wind power in India began in the 1986 with first wind farms being set up in coastal areas of Maharshtra (Ratnagiri), Gujarat (Okha) and Tamil Nadu (Tuticorin) with 55 kW Vestas wind turbines. Wind energy is one of the most promising alternative energy technologies of the future. During recent years, the amount of energy produced by wind-driven turbines has increased rapidly due to considerable advancement in turbine technologies, making wind power economically compatible with conventional sources of energy. The use of wind power in India has been gaining importance with rapid installation in the last few years. Wind energy makes up the majority about 68 per cent of the total renewable energy capacity installed in India. Wind energy program was commenced in India by the end of the 6th five yearly plan during 1983-84 and in the last few years it has increased considerably. The main objective of the program was the commercialization of wind energy production, support research and development, provide help to wind projects and to create awareness among people. Under this program Ministry of New and Renewable Energy (MNRE) has done various modification regarding incentives, schemes and policies for wind energy The development of wind power in India began in the 1990s, and has progressed steadily in the last few years. The short
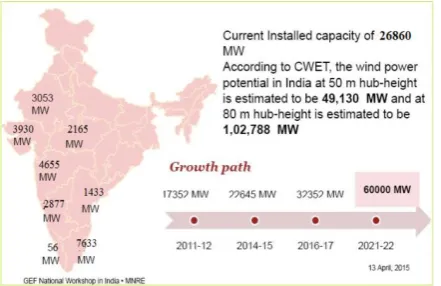
than 95 percent of total nation‘s wind energy generates from just five states located in southern and western India i.e. Gujarat, Maharashtra, Karnataka, Tamil Nadu and Andhra Pradesh. These five states are also accounted for approximately 85 percent of total installed capacity before the end of 11th five yearly plan. It clearly indicates that these five states have been leaders in wind energy generation while other states like Madhya Pradesh, Rajasthan and Kerala are also quickly increasing their capacity. Table-1 provides state wise installed wind power capacity in India (up to March 2016). As per MNRE Reports the highest wind energy installed state Tamil Nadu, which has total installed capacity of 7633.27 MW till March 2016 and total installed capacity in India as of March-2016 (MW) is approximately 2686.34 MW. The figure.1 shows Wind energy across states in India.
State
Installed capacity as of
March 2016 (MW)
Tamil Nadu 7633.27
Gujarat 3930.94
Maharashtra 4655.25
Karnataka 2877.95
Rajasthan 4031.99
Madhya Pradesh 2165.49
Andhra Pradesh 1432.95
Kerala 55.80
Others 76.7
Total 26860.34
Table 1 State wise installed Wind Power Capacityin India
Figure 1. Wind Energy across states in India
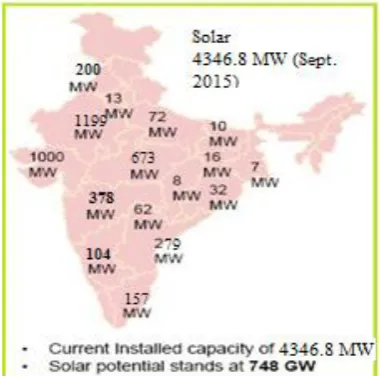
B. Solar Energy
added by 313MW. The Table 2. Provides state wise solarinstalled capacity in India, Rajasthan has the largest share of solar power generation of 28.4%i.e 1199.7 MW and Gujarat share is 24.4% ( 1000.05 MW) as on September 2015. The figure.2 shows Solar energy across states in India.
State
Installed Capacity Sept.
2015
Tamil Nadu 157.98
Gujarat 1000.05
Maharashtra 378.7
Karnataka 104.22
Rajasthan 1199.7
Madhya Pradesh
673.58
Andhra Pradesh 279.44
Punjab 200.32
Others 352.828
Total 4346.818
Table 2. State wise installed Solar Power Capacityin India
Figure2. Solar Energy across states in India
C. Biomass Energy
Biomass has always been an important energy source for the country considering the benefits and promises it offers. It is a carbon neutral fuel source for the generation of electricity; and apart from providing the much needed relief from power shortages, biomass
power projects could generate employment in rural areas. About 32% of the total primary energy use in the country is derived from biomass and more than 70% of the country‘s population depends upon it for their energy needs. The Ministry of New and Renewable Energy (MNRE), Government of India has realized the potential and role of biomass energy in the Indian context and has initiated a number of programmes for the promotion of efficient biomass conversion technologies to be used in various sectors of the economy.Table 3 State wise installed Biomass Power Capacityin India.
Table 3. State wise installed Biomass Power Capacityin
India (Source: MNRE Annual Report 2015-16)
State wise biomass power and cogeneration projects
State Capacity (MW)
Andhra Pradesh &Telangana 389.75
Bihar 43.42
Chhattisgarh 264.90
Gujarat 55.90
Haryana 52.30
Karnataka 737.28
Madhya Pradesh 36.00
Maharashtra 1,112.78
Odisha 20.00
Punjab 140.50
Rajasthan 111.30
Tamil Nadu 662.30
Uttarakhand 30.00
Uttar Pradesh 936.70
West Bengal 26.00
Total 4,761.00
only for 2-3 months in a year. So there is a need to have robust institutional and market mechanism for efficient procurement of the required quantity of biomass, within this stipulated short time, and safe storage till it is finally used.The major challenge in ensuring sustained biomass supply at reasonable prices are: Increasing competing usage of biomass resources, leading to higher opportunity costs; unorganized nature of biomass market, which is characterized by lack of mechanization in agriculture sector, defragmented land holdings, and vast number of small or marginal farmers. Another major challenge is the cost of biomass storage and transportation to power plants, which is consistently rising rapidly with time. There is the need to evolve a robust organized biomass market through innovative business models, motivating rural entrepreneurs to take up the responsibility of supplyingbiomass to processing facilities. There is also the need to develop and exploit energy plantations to take up energy crops on marginal and degraded land, as a substitute for crop wastes. Some of the Indian states leading the pack in establishing biomass based power supply are Uttar Pradesh, Maharashtra, Karnataka, Andhra Pradesh, Tamil Nadu, and Chhattisgarh. Ironically, many states with agriculture based economy, despite good biomass power potential, have not properly been able to utilize the opportunity and figure low in biomass power achievements. Only Uttar Pradesh in north India has utilized large part of the biomass potential, whichcan be attributed to its sugarcane industry, with cogeneration power plants. There is also wide variation in tariff being offered for biomass power plants in different states. Government policy can play a big role in enhancing the viability of biomass power plants and in supporting investment growth in the biomass power sector in states with high biomass power potential.The figure.3 shows Biomass energy across states in India.
Figure3. Biomass Energy across states in India
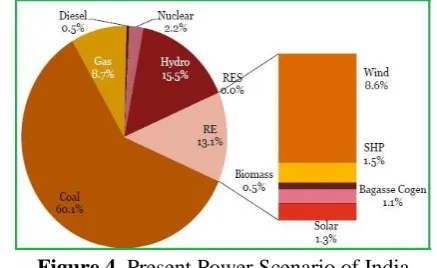
India has a vast supply of renewable energy resources and it has one of the largest programs in the world for deploying renewable energy products and systems. The total installed capacity of 263.66 GW and RE capacity of 34.35 GW (13% of Installed capacity and approximately 7% of electricity produced) as on March 2015.The present Energy scenario is shown in figure 4.
Figure 4. Present Power Scenario of India
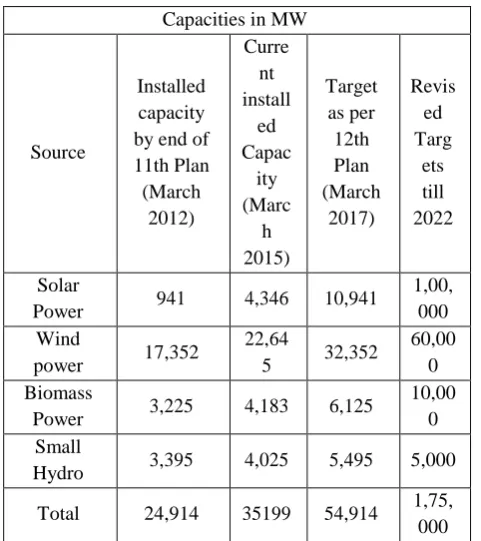
The source wise Renewable Energy capacity for the FY 07-15 is increasing from 9389 MW to 35199 MW is shown in figure. 5 and the revised totaltarget capacity till 2022 is 1,75,000MWis provided by the table 4.
Table 4. Renewable Energy Revised targets
Capacities in MW
Source
Installed capacity by end of 11th Plan (March
2012)
Curre nt install
ed Capac
ity (Marc
h 2015)
Target as per 12th Plan (March
2017)
Revis ed Targ
ets till 2022
Solar
Power 941 4,346 10,941
1,00, 000 Wind
power 17,352
22,64
5 32,352
60,00 0 Biomass
Power 3,225 4,183 6,125
10,00 0 Small
Hydro 3,395 4,025 5,495 5,000
Total 24,914 35199 54,914 1,75,
000
As per the information MNRE the estimated power requirement is expected to increase by 200% from FY 15 to FY 30 is approximately 755719 MW and contribution of Renewable Energy of entire power consumption till 2022 in India is nearly 175 GW (18.9%) andcorresponding data is shown in figure. 6 and7 respectively.
Figure 6. Estimated power requirement till 2030
Figure 7. Contribution of Renewable Energy in 2022
III.
DECENTRALIZED SYSTEMS
Renewable energy technologies are ideally suited to distributed applications, and they have substantial potential to provide a reliable and secure energy supply as an alternative to grid extension or as a supplement to grid-provided power. Over 400 million people in India, including 47.5% of those living in India‘s rural areas, still had no access to electricity. Because of the remoteness of much of India‘s un-electrified population, renewable energy can offer an economically viable means of providing connections to these groups. Some of the renewable energy technologies that are used in villages and rural areas as decentralized systems are:
Family-size biogas plants. Solar street lighting systems.
Solar lanterns and solar home lighting systems. Solar water heating systems
Solar cookers.
Standalone solar/ biomass based power generators.
AkshayUrja / Aditya Solar Shops Wind pumps.Micro-Hydal plants
Many of these systems have been found useful in urban and semi urban areas also to conserve the use of electricity and other fossil fuels. Solar water heating systems have helped in demand side management of electricity in various cities and towns during peak hours. Standalone roof top SPV systems are getting popular for day time diesel abatement in areas where power cuts are very high.
IV.
DIFFUSION THEORY AND MODELING
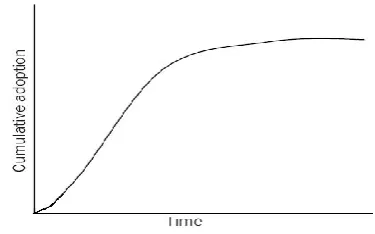
communicated through certain channels over time among the members of a social system. There are four elements in the diffusion process: the innovation, channels of communication, time and the social system. Technology Diffusion is understood as a process by which a new technology or an innovation is propagated through certain channels over time among the units of system. Schumpeter (1939) sees diffusion as the final stage of the technology development. Rogers (1962) describes diffusion of new product as a five-stage process - awareness, interest, evaluation, trial, and adoption. Grubler (1998) describes the diffusion as widespread adoption of technologies over time, in space and between social strata. The elements of technology diffusion comprise of innovation, propagation, time, and units of social systems (Narayanan, 2001). Strategies to commercialize technologies is expected to follow a path way set in stages of imagining, incubating, demonstrating, promoting and sustaining technologies (Vedpuriswar, 2003). Diffusion is considered as the stage after invention and innovation of a technology The diffusion process passes through filtering, tailoring and acceptance of a technology. Many inventions may or may not reach the stage of diffusion. The diffusion processes in general follow an S curve (Figure 8). The curve generally comprises of three distinct phases: i) an initial slow growth ,
ii) a rapid take-off period and
iii) a flattening of growth, signifying a near completion of diffusion.
There are diverse examples for depicting this S shaped pattern in the natural growth of many phenomena including diffusion of Cistercian monasteries in Europe one thousand years ago and life expectancy of creative geniuses (such as Mozart) (Grubler,1996).
Figure 8. Diffusion curve - cumulative adoption vs time Diffusion modeling captures the diffusion process or behaviour in a mathematical form that allows
quantifying the diffusion parameters for further diffusion analysis. Models can be used to explain the diffusion rates and estimate parameters that measure the coefficients of diffusion in a given context. Different diffusion models have been used, particularly since the 1960s to capture this diffusion trend in the form of mathematical equations (Meade and Islam, 2006). These models have been applied to study various diffusion processes that include population of cars, television, computers, consumer goods, etc. as well as frequency of economic booms and busts, number of fatal car accidents, incidence of major nuclear accidents, technological change in the computer industry and number of deaths from AIDS (Fisher and Pry, 1971; Meade and Islam, 1998; Mahajan, Muller and Wind 2000). They correspond to different stages of consumers‘ adoption during market development classified as innovators/early adopters, early and late majority and laggards according to the time of adoption, since the technology is introduced in the market (Figure 9). The central line signifies t* (peak adopters or the Point of Inflection) at 32.1% of total adopters and according to Bass (1969), approximately 9.5 to 20% would be early adopters, 29.1 to 32.1 % belong to early majority, 29.1 to 32.1 % late majority and 21.4 to 23.5 % would be laggards.
Figure 9. Diffusion curve - adopters vs. time
A. Brief Review of Technology or Product Diffusion Models
diffusion equation referred to as the internal influence diffusion model.
( )( ( )) --- (1)
Where N(t) is the cumulative adoption at time t and is the ultimate potential; b is the coefficient of diffusion. Equation (1) is basically a logistic growth curve and is directly used in technology diffusion which assumes diffusion process is influenced by the previous adopters. If the influence on diffusion is external, the equation for the external influence model is given by equation (2) below as:
( ( ))] ---(2)
Where N(t) is the cumulative adoption at time t and N is the ultimate potential; a is the coefficient of diffusion.
A mixed influence model which combines the above Eqns. (1) and (2) was first presented by Bass to represent the first purchase growth of a new product durable in marketing (Bass, 1969). The Bass model is a mixed influence model with three parameters p, q and m (Nu); p represents the coefficient of innovation (a in the above equation) and q is the coefficient of imitation (b in equation(1)= q/ Nu) and m is the total potential. The Bass diffusion model is given by:
( ( )) ( ( ) ---(3)
Mahajan and Peterson (1985) classify diffusion models as follows
Fundamental diffusion models (internal, external and mixed influence): these models basically assume that the diffusion process is binary, there is a distinct and constant total potential, coefficients are constant over time, etc.
Flexible diffusion models: the assumptions remain similar to fundamental diffusion models but is relatively flexible with respect to the point of inflection.
Refinements and extensions: many of the assumptions were modified to develop improved or
revised diffusion models that are sub-categorized as under:
o Dynamic diffusion models: This considers the maximum technical potential as dynamic andnot static,
o Multi innovation diffusion models: the innovation is considered as not completely independent of all other innovations but independent in a functional sense and are complementary, contingent and substitutes for other innovations,
o Space and time diffusion models which assumed primarily that the growth in the number of adoptions in each region would vary and the relative number of adoptions would be greater in those regions closest to the regions of innovation origination,
o Multistage diffusion models which consider adoption as multi stage process and not binary,
o Multi adoption models which capture repeat purchases
o Diffusion models with influencing /change agents, which consider diffusion as not just a function of time but coefficients as a function of technology specific parameters.
Table 5provides examples of the above diffusion model categories and applications (Mahajan and Petersen, 1985). Meade and Islam (2006) classified diffusion models as:
a) models for cumulative adoption and b) non linear autoregressive models (Table 6). An attempt on rationalization of different diffusion models (Jain et al, 1991)
indicate that most diffusion equations are reduced to two parts. The first part represented in the form G (1-F) as a function of potential adopters and absorbing the remaining
covered. It is highlighted that Robinson and Lakhani (1975) introduced marketing variables in the parameterization of the models and examined optimal pricing policies associated with the diffusion of new products. As the diffusion processes are influenced by many decision variables, a generalized Bass model (GBM) was developed. The GBM was considered useful for managerial purposes when possibly the empirical support for cases where prices and advertising data are decision variables were used though the simple Bass model fits the data without including the decision variables, an explanation that is lacking in the other diffusion models that include decision variables. Norton and Bass (1987) attempted diffusion of successive generations of technology and Gatignon, Eliashaberg and Robertson (1989) generalized the models to consider innovations at different stages of diffusions in
different countries. In all the diffusion models, the estimation of parameters and its interpretation is central for assessment or quantification of the influence of the diffusion process. Several estimation procedures are also deliberated in the literature and in the diffusion model context, they are generally a non-linear problem. Therefore, most attempts of parameter estimation are linear transformations followed by ordinary least square (OLS) methods. Meade and Islam (2001, 2006) argue that the empirical comparisons have received least attention. The choice of diffusion models and parameter estimation methods are specific to their applications for specific situations and requirements. It is important that the selection of the model is guided by appropriate forms of parameters than relying on any mathematical expression which fits the data.
Table 5. Summary of diffusion model categories and their applications
Category
Diffusion rate equations represented as dF/dt or dN(t)/dt;
F- Fraction of adoptions (F=N(t)/Nu; N or N(t) cumulative adoption at any given time; Nu –
Ultimate potential; a, b, etc. – diffusion coefficients; t – time
Author Applications
Fundame ntal Diffusion Model
External Influence dF/dt = a(1-F)
Coleman et al (1966) Hamblin et
al, (1973)
Assumption that Mass media -newspapers, radio, and magazines is a
major influence; and members of the social systems do not interact and are
isolated.
New drug by physicians in four mid-western communities; Number of labour
strikes and political assassinations in 64 developing nationsover a 20 year period.
Logistic Internal Influence: dF/dt = bF(1-F)
Mansfield (1961)
Mansfield investigated several industrial innovations such as pallet loaders, diesel
locomotives, and continuous mining machines
Gompertz function ( )
( ) ( ))
Griliches (1957) Gray (1973)
Griliches studied diffusion of hybrid corn in 31 States and 132 crop reporting areas among farmers. Dixon applied Gompertz function to Griliches hybrid seed corn
data
Gray investigated diffusion of 12 public policy innovations among the 48
contagious United States. Mixed Influence:
dF/dt =a+ bF(1-F)
Dixon (1980) Bass (1969)
(1972) Lekvall and
Wahlbin (1973) Warren
(1980)
simulate effect of certain internal and external influences on diffusion patters,
forecast market potential of new solar technology and diffusion of educational
innovations
Flexible Diffusion Models
Non-Symmetric Responding Logistic (NSRL) bFδ(1-F)
NRSL (Eastingwoo
detal, 1981)
Diffusion of two medical innovations – CAT head scanners and CAT body
scanners
Non-Uniform Influence (NUI) (a+ bFδ) (1-F)
(
)
NUI (Eastingwoo
d et al, 1983)
Von Bertalanffy
(1957)
Extension and Refineme nts
Dynamic Diffusion Models
Mahajan and Peterson (1978) Chow (1967) Chow examined the
natural growth of computers internal influence
model)
Mahajan and Peterson applied their model to membership in UN during
the period 1945-1974 Chow examined the natural growth of computers (Gompertz internal influence
model) and included ―technological change price reduction‖ effect. Lackman studied growth of a new plastic
product in the automotive industry
Category
Diffusion rate equations represented as dF/dt or dN(t)/dt;
F- Fraction of adoptions (F=N(t)/Nu; N or N(t) cumulative adoption at any given time; Nu –
Ultimate potential; a, b, etc. – diffusion coefficients; t – time
Author Applications
Extension and Refinements
Multi-Innovation Diffusion Models
Peterson and Mahajan
(1978)
Used to hypothesize relationships between innovations.Mahajan and Peterson compared sales growth rate
of colour and black & white TV and found the sales growth of black and white complemented that of colour sets.. Space and Time Diffusion Models N=f(x,t);
( )
( ( ) ( ) ( ) (X)-N(x,t)
N(x,t)= (X)- ( )( ( ) ( )
( ) ( ) ( )
Mahajan and Peterson
(1979) Gatignon, Eliashaberg
and Robertson
(1989)
Mahajan and Peterson reanalyzed data documenting the tractors in 25 states in
the central agricultural production region of the US for the period
1920-1964
Multistage Diffusion Models
( )
Midgley(197 6)
( ) = ( )
( ) ( )
Dodson and Muller(1978
)
Sharif and Ramanathan
(1982) Mahajan,
Muller and Kerin
(1984)
into two groups, each based on positive or negative nature of communicated
information. Mahajan applied their model to forecast attendance for the
movie ―Gandhi‖ in the Dallas, Texas area..
Multi-adoption Diffusion Models
Wind et al (1981) Lilien et al
(1981)
Forecasting sales for product innovations
Lilien model to forecast sales of ethical drugs
Diffusion Models with Influencing /change
Agents
Robinson and Lakhani (1975)
Mahajan and Muller (1979) Dolan and Kalish (1983)
Horsky and Simon (1983)
Mahajan and Wind (1985)
Incorporating the influence of pricing, advertising, promotion and technological change into the model.
Table 6. Diffusion model categories
Category Model –Equation Equation
Models of Cumulative Adoption
1.1.Bass Model dF/dt =a+ bF(t)(1-F(t))
1.2. Cumulative lognormal
1.3. Cumulative Normal
1.4. Gompertz N(t) exp(-b(exp(-at))
1.5. Log Reciprocal
1.6. Logistic
1.7. Modified
Exponential N(t)= exp(-at)
1.8. Weibull
Non-Linearised Trend and
Non-Linear Autoregressive
Models
2.1. Harvey
2.2. Floyd
2.4. KKKI
SBB (Sharma, Basu, Bhargava(1993)
Table 7. Rationalized forms of various diffusion models
S.N Models A(F) G(1-F)
1 Coleman A (1-F)
2 Mansfield bF (1-F)
3 Bass A+bF (1-F)
4 Floyd bF (1-F)2
5 Sharif- Kabir bF/[1-F(1-e)] (1-F)2
6 Easingwood- Mahajan Muller (NSRL) Modified NSRL
bFd bF
(1-F) (1-F)d
7 Non Uniform Influence (NUI) (a+bF)d (1-F)
8 Jeuland (a+bF) (1-F)1+r
9 Nedler
Von Bertalanffy
bF [b/(1-e)]Fe
(1-F)e (1-F1-e)
10 a)Generalized Rational Model (GRM-I) b) Generalized Rational Model (GRM-II)
bF/(1-F+eF) bF/(e+F – eF)
(1-F) (1-F)
11 Other Possibilities
a+ bF+rF2 [a/(1+F)+bF] [a/(1+F)+bF]
(1-F) (1-F) (1-F)2
B.Diffusion Analysis of Ret
In the above analysis, it was evident that there is limited use of diffusion models in renewable energy technology (RET) analysis. RETs convert natural resources such as solar, biomass, wind, and hydro into useful forms of energy. Their adoptions have been mainly driven by impending environmental and energy security considerations arising from use of fossil fuel based energy (from coal, oil and gas) and the fact that fossil based energy sources are finite. Unlike other commercial products or technologies, RETs have been promoted with start-up support for demonstration projects, followed by significant financial and fiscal incentives from the government or public agencies. Despite direct policy efforts and inherent environmental and socio-economic advantages of renewable energy technologies, diffusion of these alternative forms of energy has been very limited. RETs are characterized by low load factor (wind, small hydro), need for energy storage (solar PV), small size (in kilo Watt range), high upfront costs and absence of level playing field (subsidies for conventional fuels). These factors have put RETs at a disadvantage,
and thus the need for special support for the increased diffusion of RETs. RET diffusion analysts have mainly focused on analytical frameworks based on policies or barriers to diffusion of RETs. The process of commercialization of RET occurs in stages. Lund (2006) describes the process as beginning with Research and Development, followed by demonstration and pilot production. This leads to early market introduction and finally, market diffusion. While different RETs are at different phases of market development, the research in diffusion analysis in renewable energy sector points towards the following approaches.
1. Economies of scale, experience and learning curve approaches to establish cost reductions
2. Economic analysis of RETs for its viability among the given Alternatives
3. Stakeholders‘ perspectives and barrier analysis frameworks and barriers mitigation approaches
Several articles discuss the influence of policies and institutional frameworks on the growth of RETs. It has been noted that not all policies impact favourably and due to regular changes in policies and the uncertainty of compliance period, the effectiveness of policy decreases. Many of the policy elements especially the case of subsidies for wind technologies, which were phased-in and phased-out, and for which not only the extent of support but also the criteria have been under continuous revision in many countries. Dinica (2006) proposed an investor-oriented perspective to analyze the diffusion potential of support systems for RETs, particularly, policies such as feed in tariffs and quota model. Though the RETs have huge potential to fulfill the global demand of electric power, the initial cost incurred in setup of such technology and difficulty in getting financial support is a major barrier for the technology diffusion. Ravindranath et al (2000) analyzed RET policies and point out to the continuing barriers to the large scale adoption of RETs in India. Bhatia (1990) noted that the incentives and subsidy programs for biogas engines in India were arbitrarily designed and were not profitable for adopters. This was based on an analytical conceptual framework that categorized various factors which influence the diffusion and adoption process as technology characteristics, microenvironment, government‘s role, types of users and market structure. It was further argued that lack of large scale success does not imply the inappropriateness of technology; rather efforts would be required to create an environment to promote the adoption of such technology. As the adoption process begins with the interaction of user, society and government in a complex manner, it is necessary to understand those interactions from areas where it has been successfully adopted and to create similar environments in areas where rate of adoption is less. Similarly, a review of dissemination of cooking energy alternatives in India by Pohekar et al (2005) points to low dissemination of biogas and solar cookers and highlights the need for government intervention in terms of favorable policy and incentives to promote their use in households. Theocharis et al (2005) and Lund (2006) point out environment pressures and Kyoto mechanisms driving the RET adoption and innovations. Based on Roger‘s theory, Theocharis et al (2005) recognized the interaction of technological, social and organizational elements require a policy that enhance supply and more demand. They state that the pattern of diffusion of the new paradigm, still escapes the attention of policy makers and analysts. They also indicate
barriers to the sustainable diffusion of RETs and identified the main problem to lie in the implicit assumption of policy makers that diffusion is simply a matter of substitution.Purohit and Michaelowa (2006) presented a diffusion analysis of solar PV pumps in India and estimated the CDM potential for SPV pumps. They argued that though the governmental subsidy is available to farmer, still other options (electric and diesel pumpsets) are more attractive. Theocharis et al argued that strategy and policy tend to focus on the performance of individual RETs. The project-based measures fail to take into consideration two dynamic elements 1) The need for technological choice and regulation to exploit the role and the experience of users; and 2) The multiple economic impact of the mass diffusion of RETs, initially in the construction and service sectors of the economy. Based on their analysis, they suggested that a successful renewable oriented policy should be the conceptualization of renewable as a radically different technological system from that of conventional sources (fuels and nuclear). Also, the development of RETs was connected with the parallel growth of innovation systems with national or regional character Purohit and Kandpal (2005) attempted to estimate projected levels of dissemination, energy delivery and investment requirements for RETs for irrigation water pumping in India using available diffusion models. Rao and Kishore (2009) attempted to apply theory of diffusion of innovation and new technologies for analyzing the growth of wind power technology in different states of India. Although the policies of the government of India encouraged growth of the wind power sectors, individual states had varying policy measures resulting in different rates of diffusion in wind energy in different states. The state level data of cumulative wind power installed capacity is used to obtain the diffusion parameters using a mixed influence diffusion model (Bass model). The diffusion parameters obtained, especially the point of time when an inflection occurs in the diffusion curve (t*) and the rate of diffusion at the point of inflection (RPI) is used to rank the different states.
D.Conceptual Framework
of different factors on diffusion of innovation or new technologies or products or applications including RETs. The parameters from a select diffusion model can provide insights to comparative analysis of diffusion under different socio economic and environmental conditions. The rate of diffusion of technologies, products and applications depending on various socio-economic, technical and institutional parameters can thus be assessed using mathematical modeling techniques. This theoretical approach involves the following steps:
Selection of RETs for diffusion analysis Selection of a Diffusion Model
Applying the selected diffusion model to selected RETs
Developing diffusion curves Obtaining diffusion coefficients Interpretation and analysis
Development of a Composite Policy Index
Examination of diffusion factors,
coefficients/parameters and diffusion rates Estimation of weights for different parameters Study the correlation between diffusion parameters
and policy parameters.
E. Selection of Rets for Diffusion Analysis
Many renewable energy technologies are promoted in India due to diverse presence of resources. Not all RETs have reached the stage of diffusion. In order to select RETs for in-depth analysis from a diffusion perspective, the RETs havebeen first classified as follows:
a)Decentralized and centralized RET applications b)Stages in technology development cycle (also with reference to indigenous or foreign) and status ofcommercialization
c) Potential and achievement
d) Target Markets – infrastructure, rural, urban etc. e) Broad Policy and stakeholders - subsidy or market driven and private or public sector driven
F.Applying the Selected Diffusion Model to Selected Rets
1)Developing diffusion curves
a) Data Sources: The data on year wise installations of RETs are collected from published sources. The Annual Reports of the MNRE and industry association books are key sources of this information. The details on policies
are collected from various sources – including research reports of government agencies, industry and research reports.
b) Draw diffusion curves : Once the data on installations is collected, they are plotted in a graph N(t) vs t. The shape and trend of the diffusion is observed. Then N(t+1) Vs N(t) is plottedand drawn.
2) Estimate values of diffusion coefficients – p, q, m:
The next step would be to fit the model equation to the diffusion curve.The Bass Model equation above has been rewritten in discrete form as equation (4)
( ) ( ) ( ) ( ) ---(4) = m;
= m+1; = ;
The values of and are obtained from the non- linear regression equation obtained through curve fitting of the observed N (t) and N (t+1). The potential m is
estimated by √
The coefficients ‗a‘ and ‗b‘ are obtained by substituting the values obtained above for of and . Further, substituting for p = a; q = m andm all the parameter values are determined.
The parameters obtained from the above numeric method are used as reference parameters and are then optimized for the given market potential by MNRE. The Error Sum of Squares (SSE), the sum of squares of the deviations of the fitted values from the observed values is computed for a range of values of p, q and m. The values are optimized for minimum SSE which are used for the final analysis.
3)Interpretation and Analysis:
technology are thus identified for the selected technology based on secondary sources. Both the push and pull factors would correspond to the parameter values from the selected Bass diffusion model that further enables to analyze the differential impacts of the diffusion factors on the diffusion rates of RETs.
G.Develop A Composite Policy Index
Since the model by itself does not have explanatory variables, an approach is developed to measure various policy interventions and impacts. To be able to compare different mix of policies , it would be necessary to have a single parameter which can then be analyzed with reference to diffusion variables or parameters. Thus a Composite Policy Index (CPI) is proposed. The estimation of CPI would involve the following steps:
Identification of diffusion factors; different diffusion factors would be identified based on literature survey, research and expert‘s opinion. The next step would be to assign weights for different policy elements; for every factor, a weight is assigned by mutual comparison. Each factor is compared with the other from the point of view of diffusion and the more important of the two is given a score. Score of 2 or 3 is given depending on whether the difference in the importance of the two factors is small or large. Basic score of 1 is given to the factor which does not earn any score in the above process. The weight is obtained by dividing the individual score for each factor by the total score for all the factors.
Once the weights for every diffusion factor are obtained, the score obtained for different diffusion factor is multiplied by weights to get the Composite Policy Index Value. A high value indicates most favourable condition.
The States policies are ranked according to their merit – most favourable to less favourable and compared with the diffusion parameter values. Table 9 briefly describes the process of quantifying the diffusion factors. There are several policy instruments which drive RET diffusion which are identified; Feed in tariff, capital subsidy, etc.
Correlating parameters obtained and CPI From the Bass equation, p, q, m and t* are correlated to CPI to analyze the diffusion trends. The following analysis is made:
1.t* vs. CPI
2.dN(t)/dt at t*
3. Normalized Growth Rate at the Time of Inflection (NGRTI) [(dN(t)/dt at t*/m)*100]
Table 8. Policy Index (P.I) = Sum of Y1 to Y6; Highestvalue corresponds to Rank 1 and lowest Rank 4.
Diffusion Factor
(1) Score (2)
W
-Weight* (3)
Total =(2*3)
X1
Capital Subsidy = The actual subsidy/Maximu m amount of subsidy allowed (cumulative for the years)
0 to
maximum value 1
W1
0.356 Y1
X2
Concessional loans =Interest
subsidy allowed Actual values
Actual values
W2
0.244 Y2
X3 land allotment Policy == Pvt land/ Public or govt. Lands
0.1
>70% public land
1.0
>70% private land
W3
0.178 Y3
X4 W4 Y4
X5 W5 Y5
X6 W6 Y6
Table 9. Estimation for Weights for Diffusion Factors
Weight
Diffusion factors 1 2 3 4 5 6 T o t a l
Weight
1.Capitalsubsidy 1 3 3 3 3 3 1
6 0.356 2.Concessionalloa
ns
1 3 3 2 2 1
1 0.244 3.landallotmentpol
icy
1 3 2 2 8 0.178
…… 1 2 2 5 0.111
…... 1 1
0.022
H.Wind & Biomass Power Diffusion Curves And Best Curve Fits
The diffusion model equation (4) in discrete form can be written as
( ) ( ) ( ) ( ) ; Where
= m; = m+1;
= are the coefficients of the nonlinear regression equation obtained through curve fitting of the observed N (t) and N (t+1). N (t) is the cumulative installation at time t in Megawatt and N(t+1) is the cumulative capacity after at t+1.
The values of p and q are then used as initial values/guesses to obtain the parameters for the ‗forced‘ S curve where m is taken as equal to the ultimate technical potential by using optimizing technique. fitted and actual values of N(t+1) vs.N(t). Diffusion curve based on the fitted values and projected for future is shown in Figure 10.Cumulative wind and Biomass diffusion curve is shown in figure 11& 12
Figure 11. Cumulative wind power installations (MW)
(Best Fit for p=0.001, q=0.196, m=1550)
Figure 12. Biogas plant diffusion curves Best Fit for p=0.011, q=0.12, m=680000
V.
RENEWABLE ENERGY TO CREATE A
SUSTAINABLE ENERGY FUTURE
TheStrategies that India can Implement, Beginning Today To reach the goal of 100% of renewable energy by 2050 the following steps are recommended.
1. Aggressively expand large-scale deployment of both centralized and distributed renewable energy including solar, wind, hydro, biomass, and geothermal to ease the strain on the present transmission and distribution system – and allow more off-grid populations to be reached. Facilitate growth in large scale deployment by installing 100 million solar roofs and large utility-scale solar generation, through both centralized and distributed energy within the next 20 years;
2. Enact a National Renewable Energy Standard/Policy of 20% by 2020 – to create demand, new industries and innovation, and a new wave of green jobs;
3. Develop favorable government policies to ease the permitting process, and to provide start-up capital to promote the exponential growth of renewable energy.Create and fund a national smart infrastructure bank for renewable energy;
4. Accelerate local demand for renewable energy by providing preferential Feed-in-Tariffs (FIT) and other incentives such as accelerated depreciation; tax holidays; renewable energy funds; initiatives for international partnerships/collaboration, incentives for new technologies; human resources development; zero import duty on capital equipment and raw materials; excise duty exemption; and low-interest rate loans.
5. Phase out all conventional energy subsidies. Force petroleum products to compete with other fuels like biomass and biogas, etc.;
companies, utility companies, and other stakeholders to accelerate this investment;
7. Initiate a move to electrify automotive transportation or develop Electric Vehicles – plug-in hybrids – such as the Nissan Leaf, Tesla Model S, or Chevy Volt, etc.Develop and implement time-of-day pricing to encourage charging of cars at night.Adopt nationwide charging of electric cars from solar panels on roofs, and solar-powered Electric Vehicle charging stations around the country. Thousands of these solar-powered recharging stations could spread across India just like the present public call office (PCO), giving birth to the ―Green Revolution.‖ These recharging connections could be deployed at highly-concentrated areas including shopping malls, restaurants, and public places where vehicles are usually parked for extended periods;
8. Aggressively invest in a smart, two-way grid (and micro-grid). Invest in smart meters, as well as reliable networks that can accommodate the two-way flow of electricity.Such networks need to be resilient enough to avoid blackouts and accommodate the advanced power generation technologies of the future;
9. Develop large-scale solar manufacturing in India (transforming India into a global solar manufacturing hub).Promote and establish utility-scale solar and wind generation parks and farms.Also, establish R&D facilities within academia, research institutions, industry, government and private entities to guide technology development.
10. Work towards a Hydrogen Economy development plan. Hydrogen can be fed into fuel cells for generating heat and electricity – as well as for powering fuel cell vehicles.Produce hydrogen from renewable energy sources such as solar and wind. If done successfully, hydrogen and electricity will eventually become society‘s primary energy carriers for the twenty-first century.
VI.
CONCLUSIONS AND SCOPE FOR
FURTHER WORK
The difference in diffusion parameter values correspond to not only different policy environments but different responses to the same set of policies in different environments. There are several RETs in India that are yet to realize their potential. Diffusion modeling can be an important tool to assess and design future programmes.
It is seen that the policy framework of a government is critical for promotion of RETs in a country. The following are the key recommendations emerging from this study for policy formulation, design and implementation of the future programmes in RETs: The policies can make use of diffusion analysis for setting targets
- Different RET diffusion curves can be constructed to review the resource requirements formeeting the stated goals/targets
reduced for effective diffusion strategies. Detailed resource assessments and technical potential estimation needs to be carried out on a continuous basis.
VII.
ACKNOWLEDGMENT
I express my thanks to the support given by management in completing my project. I also express my sincere gratitude & deep sense of respect to Dr. S.K Shrivastava, professor of the Electrical Department. I am thankful to the Research Head, teaching and non-teaching staff of Electrical department for their direct as well as indirect help in my project. I am elated to avail my selves to this opportunity to express my deep sense of gratitude to my parents.
VIII.
REFERENCES
[1] Bhatia R., 1990 Diffusion of renewable energy technologies in developing countries: a case study of biogas engines in India, Delhi World Development. Vol. 18.No. 3. pp. 575-590
[2] Bhatia R., 1990 Diffusion of renewable energy technologies in developing countries: a case study of biogas engines in India, Delhi World Development. Vol. 18.No. 3. pp. 575-590
[3] TERI, ―TERI Energy Data Directory and year book‘, The Energy Research Institute, New Delhi, 2000. pp. 118
[4] Planning Commission, Govt. of India—September 1995 & September 1996 Projections to 2020–2021 [5] Overview of Renewable Energy Potential of India,
Peter Meisen, President, Global Energy Network Institute (GENI ) available at http://www.geni.org [6] Lalwani M. and Singh M., Conventional and
renewable energy scenario of India: Present and Future, Can J Elect Electron Eng, 1,122-140 (2010) [7] Coleman J., Katz E., Menzel H., 1957 The diffusion
of an innovation among physicians Sociometry, 253-278
[8] Dinica V, 2006 Support Systems for the diffusion of renewable energy technologies – an investor‘s perspective Energy Policy (34) 461-480
[9] Ghosh D., Shukla P. R., Garg A, Ramana PV, 2001 Renewable energy strategies for Indian power sector CSH Occasional Paper, Publication of the French Research Institute in India
[10] acobsson S., Johnson A., 2000 The diffusion of renewable energy technology: an analytical
framework and key issues for research Energy Policy (28) 625-640.
[11] Lund H. ,2006 Kyoto mechanisms and technological innovations Energy, 2006, 31 (13) 1989-1996
[12] Mahajan V., Muller E., Bass F. M., 1993 New-product diffusion models, in Handbook in operations research and management science Chapter 8, Marketing, vol. 5. Amsterdam, Netherlands: North Holland
[13] Mahajan V., Muller E., Kerin R.A., 1984 Introduction strategy for new products with positive and negative word- ofmouth Management Science 30:1389-1404
[14] Norton, J. A., Bass F. M., 1987 A diffusion theory model of adoption and substitution for successive generations of high technology products. Management Sci. 33(9) 1069–1086
[15] Renewable Energy in India: Growth and Targets Ministry of New and Renewable Energy (MNRE), Government of India. 2015.
[16] A Review of Wind Energy Scenario in India‖ Singh Madhu1* and Singh Payal2 , International Research Journal of Environment Sciences, Vol. 3(4), 87- 92, April (2014)
[17] Mahajan V, E Muller, & Y Wind, 2000 New product diffusion models (pp. 3– 24) Kluwer Academic Publishers, London.
[18] Mahajan V., Muller E., Bass F. M. , 1990 New-product diffusion models: A review and directions for research Journal of Marketing, (54) 1– 26. [19] Mahajan V., Peterson R. A., 1978 Innovation
Diffusion in A Dynamic Potential Adapter Population Management Science, (24) 1589–1597 [20] Mahajan V., Peterson R. A., 1985 Models for