Electronic Journal of Science Education Vol. 17, No. 1 (2013)
© 2013 Electronic Journal of Science Education (Southwestern University) Retrieved from http://ejse.southwestern.edu
The Role of Disciplinary Core Ideas and Practices in the Complexity of Large-Scale Assessment Items
Amelia Wenk Gotwals Michigan State University
Hayat Hokayem
Texas Christian University
Tian Song
Pearson Assessment
Nancy Butler Songer University of Michigan
Correspondence concerning this manuscript should be addressed to Amelia Wenk Gotwals, College of Education, Michigan State University; 620 Farm Lane, East Lansing, MI 48843, USA, 517-355-8531, [email protected]
Abstract
The Framework for K-12 Science Education (NRC, 2011) outlines core disciplinary ideas, scientific practices and cross-cutting ideas as dimensions on which to base science education. This study outlines the use of core ecological ideas and two scientific practices as a way to examine the cognitive complexity of released large-scale assessment items in Ecology. We present results from analysis of 212 released items from state, national and international sources and compare the types of core ecological ideas and scientific practices required to successfully complete these assessment tasks. We administered a subset of items to students to examine how well our rubric was aligned with students’ interactions with the items. Our findings indicate that different sources of items have different proportions of item formats and have items designed to elicit different types of core ideas and practices from students. The analysis of students’ responses to items indicates that using a framework of core ecological ideas and scientific practices provide a good indication of item difficulty. However, this paper highlights several instances where the coding of items does not match students’ responses to items and we analyze possible reasons for the discrepancies – including both item design flaws and opportunity to learn.
Key Words: Assessment, ecology, practices
Introduction
Electronic Journal of Science Education ejse.southwestern.edu accountability. American students consistently perform worse than their peers in other countries on international standardized tests of science achievement (e.g. PISA; OECD, 2007). In particular, American students fall well behind students in other industrialized countries in areas such as ecology and environmental science, which are considered key disciplinary areas for being a scientifically literate citizen (OECD, 2009). In addition, large-scale state and national assessments consistently document the under performance of students from low-income families, students of color, and urban students (Lutkus, Lauko, & Brockway, 2006). With increased stakes such as teachers’ jobs and school funding resting on the outcomes of assessments, there has been more focus on the tests themselves with inferences drawn about what students can and cannot do.
In general, many agree that existing standardized tests are a better measure of declarative knowledge than complex thinking, especially in content areas like science (Popham, 2005). Despite the claim that these large-scale assessments tend to focus on simpler declarative knowledge, many students (especially those with lower socio-economic status: SES) struggle on these tests with dire consequences for themselves, their teachers, and schools (Lomax, et al., 1995). Many in the science education community are well aware that large-scale assessments often do not capture the nature of science knowledge promoted in reform documents (e.g., Lomax, et. al, 2005; Hyde, et. al, 2008; Authors, 2009). Given that the content on these assessments often drives curriculum in classrooms (Wang, 2001), it is important for these assessments to reflect the types of teaching we hope for in science classrooms. One effort to attend to this is the creation of the Next Generation Science Standards (NGSS) that were created over the past two years in partnership with the National Academies of Science’s National Research Council (NRC), National Science Teachers Association (NSTA) and the American Association for the Advancement of Science (AAAS). A main goal of the NGSS is to provide coherence for science education by guiding the development of curricula, assessments and professional development. The precursor document titled, A Framework for K-12 Science Education: Practices, Crosscutting Concepts and Core Ideas (NRC, 2012) includes three major dimensions: (1) Scientific and engineering practices; (2) Crosscutting concepts that unify the study of science and engineering through their common application across fields; and (3) Core ideas in four disciplinary areas: physical sciences; life sciences; earth and space sciences; and engineering, technology, and the applications of science (NRC, 2012; p. 3).
Disciplinary Core Ideas and Practices in Assessment 3
Electronic Journal of Science Education ejse.southwestern.edu complex for students. This paper describes the use of an existing learning progression framework (Authors, 2009; 2012) to examine the cognitive complexity of released standardized testing items that focus on core ecological ideas and the practices of “analyzing and interpreting data” and “constructing explanations” and uses this scheme to compare items from different sources. A disciplinary core idea must: (1) have broad importance across multiple science disciplines; (2) provide a key tool for understanding complex ideas; (3) relate to the interests and life experiences of students; and (4) be teachable and learnable at multiple grade levels (NRC, 2012, p. 31). Ecosystems are included as a disciplinary core idea in the NGSS by focusing on the interactions in organisms, energy transfer and dispersion, and the dynamics of matter flow.
In addition, we administered a subset of these assessment items to 6th grade urban students to determine how well our coding rubric predicted the difficulty of items for urban students for whom the results of high stakes tests hold extreme consequences. We use Milner’s (2012) definition of urban intensive as schools that are located in large, densely populated cities. As a result of this dense population, urban intensive schools suffer from limited resources and “the broader environments, outside of school factors such as housing, poverty, and transportation are directly connected to what happens inside of the school” (p. 559). These conditions influence the learning that happens in schools. Thus, we focus on urban students and ecology because many urban students struggle with ecological ideas because they do not have as many life experiences with examining ecosystems (Bixler, Carlisle, Hammltt, Floyd, 2010; Frick, Birkenholz, Gardner, Machtmes, 1995). The research questions that this paper addresses are:
• What core ecological ideas and scientific practices do large-scale assessment items elicit from students? and
• What about these items are difficult for a specific group of urban middle school students?
What the Tests are Testing and What We Want Them to Test
Few large-scale tests are able to capture the complex reasoning skills that are highly valued in today’s science classrooms (Authors, 2009; Hyde, et. al, 2008; Lomax, et. al, 2005). For example, Hyde, et al (2008) found that, in math, both state tests as well as the National Assessment of Educational Progress (NAEP) had a dearth of complex items. In fact, of the ten state assessments that the study examined, none of the state tests had items at the upper two levels of a DOK coding scheme. This is consistent with Lomax et al’s (1995) finding that, of the standardized science items they examined, about three quarters tested both low-level thinking skills and low-level conceptual knowledge, and over 90% of the items did not test procedural knowledge at all. Similarly, in an examination of the international assessment, Trends in Math and Science Study (TIMSS), the assessment was found to focus on “lower level learning outcomes” through the use of using mostly multiple choice items and a lack of short response and extended response items (Wang, 2001).
A Focus on Disciplinary Core Ideas and Science Practices
Electronic Journal of Science Education ejse.southwestern.edu evidence and theory are also essential features of science; scientists need to be able to examine, review, and evaluate their own knowledge and ideas and critique those of others” (NRC, 2012, p. 26-27). Thus, the Framework for Science Education Standards prioritizes learning goals that are a fusion of disciplinary core ideas with scientific practices (NRC, 2012). The NGSS provides performance expectations that are the “assessable” version of the fused knowledge. In this study, we examine whether we can use disciplinary core ideas and scientific practices to examine the difficulty and complexity of large-scale assessment items.
Validity and Implications
The quest for science assessments that test the disciplinary core ideas and scientific practices called for in standards documents and current research (e.g., NRC, 2012) highlights the need for studying the validity of tests to represent what students know and can do in science. Validity refers to the interpretation of the assessment score as it relates to the people interacting with the tasks, the context in which the people act, and any implications that this may hold (AERA, APA, & NCME, 1999; Cronbach, 1971; Kane, 2001; Messick, 1995). Validity has been argued to be the most important aspect to consider when using any kind of assessments (AERA et al., 1999; Kane, 2001). Messick (1995) states that, “Validity is an overall evaluative judgment of the degree to which empirical evidence and theoretical rationales support the adequacy and appropriateness of interpretations and actions on the basis of test scores or other modes of assessment” (p. 174). It is important to note that validity, then, is not just about a given assessment, but also refers to implications for the interpretations and uses of given assessments. A given task may be valid for making a claim about a certain population’s ability on a given construct, however, may not be valid for another population. In addition, a task may be valid for making claims about people having certain types of knowledge and skills, but not others. Thus, examining the validity of large-scale assessment items that hold high stakes for both teachers and students is important in order to substantiate any claims that are made by the results of these tests.
Examining the validity of assessment items that fuse core ecological ideas and scientific practices with urban students is particularly important as urban students often have fewer experiences with exploring ecological ideas out of school (Bixler, Carlisle, Hammltt, Floyd, 2010; Frick, Birkenholz, Gardner, Machtmes, 1995). Thus, examining the ways in which urban students interact with the assessment tasks can provide us with validity evidence for these items and can allow us to examine the nuances in students’ reasoning.
Methods
This study has two main parts: (1) an analysis of the items themselves based on the coding scheme and (2) an examination of how students responded to the items and a comparison of whether students interacted with the items in ways in which we would have predicted given how we coded the items. To do analysis, we used both quantitative and qualitative methods.
Coding Items
Disciplinary Core Ideas and Practices in Assessment 5
Electronic Journal of Science Education ejse.southwestern.edu difficulty along the test scale” (Schneider, Huff, Egan, Tully & Ferrara, 2010). Therefore, developing a coding framework that can better capture what about items is difficult may allow us to help move the field forward.
Sources
In this study we analyzed 212 assessment items that focused on ecology content in order to examine the ways in which our learning progression-based rubric could characterize assessment items. The assessment items were released items from the National Assessment of Educational Progress (NAEP; http://nces.ed.gov/nationsreportcard/), The Trends in International Mathematics and Science Study (TIMSS; http://nces.ed.gov/timss/), Michigan Educational Assessment Program (MEAP; http://www.michigan.gov/mde/0,1607,7-140-22709_31168---,00.html) and items from other state tests (Florida, Massachusetts, Oregon, New Hampshire, New York, and Texas). We chose all released items from these sources that targeted ecology. These items were released to the public and can be assumed to be representative of the types of items generally present in these tests.
Coding Scheme
For our coding scheme, we used a form of cognitive component analysis (Carroll, 1976; Pellegrino & Glaser, 1979) focusing on the complexity of items. Complexity of an item refers to the characteristics or components of the task that influence the processes and knowledge needed to solve it (Scheuneman, Gerritz, & Embretson, 1991). We consider complexity of assessment items mainly includes two components: (1) the nature of the disciplinary core ideas in the item and (2) the cognitive demand – or what the item asks the student to do (in this case, the scientific practices) (Emmerich, 1989). Therefore, we developed a rubric based on an existing learning progression (e.g., Authors, 2009; 2012) that could capture both core ecological ideas and scientific practice levels.
We agree with Corcoran, Mosher and Rogat (2009) that,
By treating the development of concepts and practices as analytically distinguishable, but intertwined, pathways … progressions can make this tension explicit and provide a basis for describing and assessing the empirically observable combinations of concepts and practices that actually show up in students’ understanding and in their work. (p. 21)
Electronic Journal of Science Education ejse.southwestern.edu Table 1.
Modified Core Disciplinary Ideas in Ecology Learning Progression (see Authors, 2009; 2012 for more details)
Classification Strand Ecology Strand Biodiversity Strand
6
th G
ra
d
e
Complex Ecological Idea:
A change in one species can affect different members of the food web…
. . .
Middle Ecological Idea:
Plants and animals of a habitat can be connected in a food chain
Complex Biodiversity Idea:
Humans and other factors affect biodiversity…
. . .
Middle Biodiversity Idea:
Biodiversity differs in different areas…
5
th G
ra
d
e
Complex Classification
Idea: Patterns of shared
characteristics reveal the evolutionary history…
. . .
Middle Classification Idea:
Organisms are grouped based on their structures…
Middle Biodiversity Idea:
An area has a high biodiversity if it has both high richness and abundance .
. .
Basic Biodiversity Idea:
A habitat is a place that provides food, water, shelter…
4
th G
ra
d
e
Middle Classification Idea:
Organisms have different features that allow them to survive
. . .
Basic Classification Idea:
There are observable features of living things
Middle Ecological Idea:
Only a small fraction of energy at one level … moves to the next level
. . .
Basic Ecological Idea:
Every organism needs energy to live…
Disciplinary Core Ideas and Practices in Assessment 7
Electronic Journal of Science Education ejse.southwestern.edu including items where students had to create a graph or make a picture. While item type can provide a certain amount of information, we wanted more nuanced understandings about the scientific practices required by each item. Thus we coded the scientific practice that students would have to use in order to solve the problem. The categories that we were: definition (identifying knowledge), application (using knowledge), reading comprehension, interpreting data, and explanation. Of these classifications, only the interpreting data and explanations categories explicitly fit with scientific practices identified in the Framework for the NGSS (NRC, 2011). However, so few items incorporated these practices, we chose to examine all item types to see the ways in which students engaged in the disciplinary core ideas.
In definitional questions, students are required to choose a definition of a given term; in application questions, students must apply content knowledge to a certain scenario; in reading comprehension items students find the answer to the question solely inside the reading passage; in interpreting data items students analyze information from an inscription, such as a table, graph, or picture to find the answer; and in explanation items students use disciplinary core ideas and other available information to create an explanation. While there is not an inherent complexity hierarchy in these processes, we considered questions that incorporated scientific practices mentioned in the NRC (2012) framework (i.e., interpreting data and constructing explanations) as more complex than other questions. Constructing explanations is one of the main practices in the Framework (NRC, 2011) and being able to explain a scientific situation illustrates an ability to fuse disciplinary core ideas and complex reasoning (Toth, Suthers, & Lesgold, 2002). Interpreting data includes fusing a key scientific practice with disciplinary core ideas and thus is more complex than knowing a definition or applying a definition since. In addition to the above categories, we examined the grade level targeted by the item, the type and complexity of representations in the items, the types of vocabulary in the items, and the wording of the items as a way to characterize the cognitive complexity of the items.
Using the coding scheme just described, the first two authors coded all items separately and then met and went over the codes for each item to check for consistency in coding. We had an inter-rater reliability of over 85% agreement and discussed any differences to settle on final codes for all items. After coding each item according to the scheme just described, we synthesized difficulty into a composite difficulty category with three hierarchical levels. To do this, we examined the codes for each item and, based on the average of all codes, assigned each item an overall difficulty code.
Item Categorizations
Electronic Journal of Science Education ejse.southwestern.edu computed correlations. Finally, we used Analysis of Variance (ANOVA), which is a method of comparing the means between two or more groups, to examine whether certain sources, grade levels, or types of items have more difficult content, representations, or processes.
Predicting item difficulty and cognitive validity
Cognitive validity has been identified by experts in measurement and cognitive psychology as a form of construct validity that provides evidence of the declarative knowledge (e.g, knowledge of disciplinary core ideas) and procedural knowledge (e.g., scientific practices) elicited by assessments designed to test concepts and skills (Baxter & Glaser, 1998; Messick, 1989). Cognitive analyses suggest that while a review of the prompts, rubrics, and even written work may suggest that items are tapping certain skills, examining students’ actual interactions with tasks is crucial in making any claims about the validity of items for specific students and for specific purposes (DeBarger et al, 2006).
To better understand how the complexity components of the items that we identified influence item difficulty, we administered a subset of these standardized test items (37 items, some with multiple parts) to a group of over 500 urban 6th grade students. While we did not gather demographic data, our sample of students are in schools characteristic of the district, which has 94% ethnic minorities with over 70% eligible for free or reduced lunch (information from http://www.cepi.state.mi.us/scm/). The items were split over two forms that had at least 20% overlapping or linking items and each student only took one form. We calibrated these items using an item response model and determined the empirical difficulty parameter of each item. The data were calibrated using the Rasch modeling software Winsteps (Linacre, 2011). Because the selected items consisted of both multiple-choice items and constructed-response questions, the partial credit model (Masters, 1982) was used. The mathematical expression for the model is:
∑
= − − ∑ ∑ = = = = i v u iu j k u iu j m v δ θ δ θ j ij e e θ k u P 0 ) ( ) ( 0 0 ) | (where k is the score on item i, θj is the ability level of examinee j, mi is the maximum score on
item I, and δiu is the threshold parameter for the uth score category for item i. The model fit the
data well, with all items and student fit statistics falling between 0.75 to 1.25 (Bond & Fox, 2001).
Once we had the difficulty parameter of each item, we ran a multiple regression analysis where we used the complexity components of the items as predictors for a dependent variable of empirical item difficulty (as calculated by Winsteps). In this study, the predictors included item type, content complexity, processes involved in the item, type of representation, the grade level the items was targeting, and the overall item difficulty.
Disciplinary Core Ideas and Practices in Assessment 9
Electronic Journal of Science Education ejse.southwestern.edu (which is the largest for all tested relationships and would need the largest sample size), we need a sample size of 160 for a power of 0.9. Thus our sample size (212 items) is sufficient to detect the statistical difference if the effect size is considered large. For our regression, even if we assume a small effect size (0.05), we need a sample size of 213 students. Thus, our sample of 507 students is more than sufficient to conduct our multiple regression analyses.
Qualitative Study
In addition to quantitative analyses, we also conducted interviews with 28 6th grade students using a subset of 13 items that had a range of item difficulties. The interviews had two parts, a think-aloud section where students were asked to solve the items while speaking out loud what they were thinking and an interview section with four questions asking students about which questions were the easiest (and why), the most challenging (and why), the most confusing (and why), and ways they could think to improve the questions.1 Common think-aloud procedures were used for the first part of the interview to gather information about in students’ thought processes as they worked on the assessment tasks (Ericsson & Simon, 1993). After being instructed about the thinking aloud procedure, the interviewer modeled how to think aloud on one practice problem. Students then practiced thinking aloud on a second practice problem. Following the practice, students thought aloud as they completed the assessment. The interviewer did not interact with the student as he or she completed the assessment except to remind the student to keep talking or to speak louder. After the student completed the assessment, the interviewer went back over the assessment with the student asking the student to clarify responses on items, to explain how they reasoned about an item, and to ask the four follow up questions about the difficulty of the items.
Following standard procedures (DeBarger, Quellmalz, Fried, & Fujii, 2006; Ericsson & Simon, 1993), we transcribed the interviews, segmented the transcripts by item, and coded the responses for evidence of cognitive complexity. We used four codes for complexity that corresponded to the codes that we developed for the rubric: disciplinary core idea; representation; scientific practice; and vocabulary, wording or phrasing. Once we finished coding students’ responses, we synthesized the information from each item to include how the students interacted with each item. In addition to think-alouds with items, we also organized the interview questions about which questions students found the easiest, which they found difficult and why and how they would make the questions better. We used this information to better understand the difficulty students faced from those questions and used that to help explain the findings from the qualitative and quantitative analyses.
Results
Comparison Across Sources
Table 2 illustrates the item type and the component processes involved in items by the source of the item. Overall, most items on standardized tests are verbal restricted items (mainly multiple choice). However, when comparing the item types by the source of the items, MEAP
1
Electronic Journal of Science Education ejse.southwestern.edu and other state tests had more verbal restricted items and NAEP and TIMSS had more verbal extended items (χ2
(6) = 32.43; p<0.001).
In addition, for each source, most of the items were coded as application items, where students had to apply their content knowledge to answer a certain question. However, different sources had different proportions of processes in their items (χ2
(18) = 41.13; p<0.001). TIMSS, MEAP and other state assessments had more application items than NAEP. NAEP had more definitional items than the other sources and also had more explanation items than other sources. State assessments (other than the MEAP) had more interpreting data items than other sources.
Table 2.
Percentages of Components of Items by Item Source
Verbal Restricted
Verbal Extended
Definition Application Reading Comp
Int. Data
Explanation
MEAP (N= 104)
82.5 17.5 7.7 59 6 4.3 9.4
NAEP (N= 31)
54.8 35.5 18.8 37.5 0 6.3 28.1
Other state tests
(N= 39)
92.3 5.1 12.8 56.4 0 15.4 2.6
TIMSS
(N=38)
63 37 2.2 65.2 0 10.9 17.4
Comparison Across Grade Levels
Regardless of item source, certain grade bands (identified as lower (4th and 5th grades), middle (8th grade) and upper (above 8th grade)) had different proportions of practices than each other (χ2
(48) = 89.31; p<0.001). Overall, items at the lower grade bands tend to have more verbal restricted items than the middle or upper grades and the upper grade bands tend to have more verbal extended items.
In addition, when examining the practices involved at each grade level in the MEAP, the lower grade band had a higher percentage of definitional items, the middle grade band had a higher percentage of application items, and the upper grade band had a higher percentage of explanation items (χ2
(20) = 32.39; p<0.05). On the TIMSS, the lower grade band had a higher percentage of application items and the middle grade band has a higher percentage of interpreting data items (χ2
(8) = 21.92; p<0.01).
Comparison Across Core Disciplinary Ideas
Regardless of item source, items that assess certain types of content knowledge tend to be associated with certain types of practices (χ2
Disciplinary Core Ideas and Practices in Assessment 11
Electronic Journal of Science Education ejse.southwestern.edu Plant classification questions tend to be more definitional in nature, while animal classification questions tend to require students to utilize application skills more than other types of items. Finally, biodiversity items that target energy and human impact items have a higher percentage of explanation questions.
Empirical Difficulty
We used findings from the IRT analysis in order to examine what item characteristics influenced item difficulty. Item difficulty parameters are measured in logits (i.e., log odds); Winsteps sets the average item difficulty at 0 logits. Items with difficulty parameters above 0 have above average difficulty (harder items), and items with difficulty parameters below 0 have below average difficulty (easier items). In Tables 3-6 below, we examine the patterns in how students responded to items (using the empirical item difficulty parameter) based on the coding of items. These tables show that items targeted for lower grade levels tend to be easier than those targeted at higher grade levels (Table 3).
Table 3.
Empirical Difficulty by Grade Band (N=507 students)
Grade Band Empirical Difficulty (logits)
K-5 (N=17) -0.657 6-8 (N=15) 0.203 9-12 (N=5) 0.458
In terms of disciplinary core ideas, items that mapped to core ideas at the lower levels of our progression tended to be easier and items targeted at levels above our learning progression (level 4) were much more difficult than others (Table 4).
Table 4.
Empirical Difficulty by Core Idea Difficulty (N=507 students)
Difficulty of Core Idea Empirical Difficulty (logits)
Level 1 (N=7) -0.417 Level 2 (N=2) -0.375 Level 3 (N=26) -0.099 Level 4 (N=2) 1.00
In terms of item format, verbal restricted items tended to be easier than verbal extended item (Table 5).
Table 5.
Empirical Difficulty by Item Format* (N=507 students)
Item format Empirical Difficulty (logits)
Verbal Restricted (N=30)
-0.283
Verbal Extended (N=11)
1.13
Electronic Journal of Science Education ejse.southwestern.edu Finally, in terms of our overall difficulty coding, the Level 1 items, those with a low amount of complexity, tended to be the least difficult and the Level 3 items, with the most amount of complexity, tended to be the most difficult (Table 6). Overall, the empirical results confirm that the methods that we used to characterize the cognitive complexity of the items tended to correspond to how students responded to the items, providing validity evidence for the categories that we used to classify item complexity.
Table 6.
Empirical Difficulty compared with predicted difficulty based on the rubric (N=507 students)
Overall Difficulty Empirical Difficulty (logits)
Level 1 (N=5) -1.05 Level 2 (N=24) -0.119 Level 3 (N=8) 0.792
Regression Analysis
While we found patterns in how students responded to the items and the cognitive complexity codes we assigned items, we were also interested in whether the compilation of item characteristics that we used in the coding can be considered good predictors of item difficulty. Thus, our next step was to run a multiple regression analysis where we used the complexity components of the items as predictors for a dependent variable of empirical item difficulty. Examining predictors of item difficulty will allow us to better understand how items function and what aspects of items influence how difficult they are.
Table 7 presents the results of the regression. Overall, the learning progression level (levels 1-4) that the item was targeted was a good predictor of how difficult students found the item (p<.05), with items targeted for higher learning progression levels having higher difficulties. In addition, our overall difficulty parameter (which included a composite of item format, representational difficulty and the vocabulary included in the item) was also a good predictor of the difficulty of the item (p<.05) where items with higher difficulty codes based on our rubric also had higher empirical difficulties. However, none of the other individual variables alone were good predictors of difficulty.
Table 7.
Regression Model of Empirical Difficulty (N=507)
Independent Variable Effect Size
(b/SDOutcome)
LP level 0.619*
Overall Difficulty 0.731* * Significant at the .05 level
R2 =0.462
Comparison of Think-Alouds and Interviews
Disciplinary Core Ideas and Practices in Assessment 13
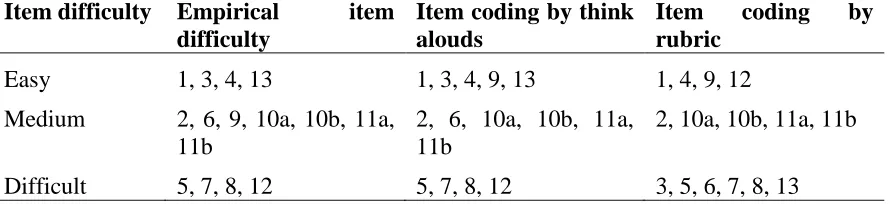
Electronic Journal of Science Education ejse.southwestern.edu difficulty < -0.5); Medium (item difficulty between -0.5 0.5); or Difficult (item difficulty > 0.5); for the classification of think-alouds and interviews, we used results from students’ responses to the think-alouds, but also examined students’ responses to the question about whether the items were easy or difficult, and for the classification based on the coding rubric, we used the overall difficulty parameter and level of core disciplinary idea (based on the learning progression).
Table 8.
Classifying each question based on empirical difficulty, coding by the rubric, and think-aloud evidence
Item difficulty Empirical item difficulty
Item coding by think alouds
Item coding by rubric
Easy 1, 3, 4, 13 1, 3, 4, 9, 13 1, 4, 9, 12
Medium 2, 6, 9, 10a, 10b, 11a, 11b
2, 6, 10a, 10b, 11a, 11b
2, 10a, 10b, 11a, 11b
Difficult 5, 7, 8, 12 5, 7, 8, 12 3, 5, 6, 7, 8, 13
When comparing the empirical difficulty of the items and how the students thought aloud about the questions, 10 out the 15 items2 matched our coding based on our rubric (questions 1, 2, 4, 5, 7, 8, 10a, 10b, 11a, 11b). In the following discussion we concentrate on items where the validity of the interpretation of the item or the accuracy of our coding rubric are in question and we explore some features about those items.
Discrepancies between coding and empirical data
Five items (items 3, 6, 9, 12, and 13) showed discrepancies in how students reasoned about the questions and how these items were coded based on our rubric. We coded item 6 as being difficult, but the empirical difficulty and students’ think-aloud responses put item 6 in the medium category. Similarly, we coded item 9 as being easy and the think-alouds gave evidence that it was easy, but the item response modeling showed that it was about average difficulty. The other items, however, showed larger discrepancies between how we coded them and the evidence that we gathered from students. We will discuss each of these items.
Items coded as difficult, but empirically easy. Items 3 and 13 were coded at the highest level of difficulty, however based on both the empirical difficulty and students’ think-aloud responses these items were easy for students. Item 3 is a MEAP 5th grade item that provides students with a graph and asks them, based on the data, which fish is most likely to survive in large variations in temperature (see Figure 1). Using the rubric, this item was classified as a difficult item, given the need for students to interpret data based on a graph and the disciplinary core idea of the item, which deals with an understanding of tolerance of different species to different temperatures, which fell at a complex level in our learning progression. However, based on the item response model, the item had a well below average difficulty level, with the majority of students getting the item correct. The think-alouds allowed us to gather more
2
Electronic Journal of Science Education ejse.southwestern.edu information about the types of reasoning that students used when they interacted with this item. While the item is asking about complex content of tolerance to different temperature conditions, almost all students chose the correct response by choosing the “longest line.” For example, student 7 said, “…oh I choose species 3 because it has longer temperature tolerance and is most likely to survive more then anyone else”. Student 16 said, “Species three? Cause it has the longer line.” And student 17 said, “…I’m going to go with C. Because the temperature is long.” These students were speaking about temperature, but said that temperature was long, showing that they were likely just examining the graph without considering the content associated with the question. Some students did show some signs of reasoning. For example, student 9 said, “Umm species three. Yeah species three. I chose species three because it has a lot, it can survive in low temperature and it can survive in high temperature.” This student illustrates understanding of what the graph means when she said that it can survive in low and high temperatures (rather than talking about long temperatures).
When asked about whether this question was hard or easy and why, students generally said that it was easy. For example, student 16 said, “’cause you only have to figure out how long the thing is.” However, some students indicated that they were initially confused by the question and that some of the vocabulary was difficult. For example, student 18 identified this item as difficult, “because of the words, tolerance was hard.” Student 26 said that she was not familiar with this type of graph and that the question “should have bar graphs.” Despite these confusions, all students who participated in the think-alouds chose the correct response for this item, illustrating that despite some more complicated vocabulary and a potentially unfamiliar format of graph, the item did not pose many challenges for students.
Question # & Source
Question content
3
MEAP 5th Grade
13
NAEP 12th Grade
Disciplinary Core Ideas and Practices in Assessment 15
Electronic Journal of Science Education ejse.southwestern.edu NUMBER OF PARAMECIA IN POND WATER SAMPLE
Day Species S Species T
1 60 50
2 60 80
3 100 90
4 150 60
5 160 50
6 160 30
7 160 20
Which of the following can be correctly concluded from the data: A. Species S is the food for Species T
B. Species T is more common than Species S
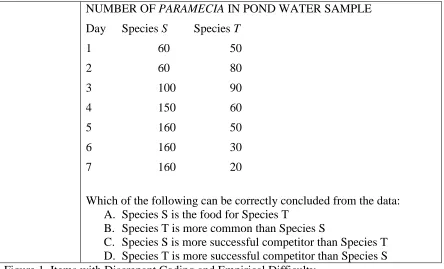
C. Species S is more successful competitor than Species T D. Species T is more successful competitor than Species S Figure 1. Items with Discrepant Coding and Empirical Difficulty
Item 13 is a NAEP 12th grade item that provides students with 4 sentences to read and a table with information about the number of two different species over the course of one week. The item then asks students what can be concluded from the data (see Figure 1). Using the rubric, this item was classified as a difficult item because of the need to interpret data from the table, the disciplinary core idea of competition between species (a level 3 on our learning progression), the difficult vocabulary, and short reading associated with the item. However, the item had a below average difficulty based on the item response modeling, and while most students struggled with several vocabulary words such as protozoans and Paramecium, many did a good job reasoning through this item in the think-alouds. For example, student 4 said, “… Well … C, species s is a more successful competitor then species t. That could be right because the population is higher here. That means that if they did compete mostly species s won and species t didn’t so species t lost so that’s why they have a lower population.” Many students, though, were able to answer this item correctly without illustrating how they were connecting the content and the graph. For example, student 1 said, “Umm I think it’s c because first it has more bigger numbers then species t.” and student 20 said, “… I think it’s C because umm is because it has more numbers then species t has.”
Electronic Journal of Science Education ejse.southwestern.edu indicated that it was difficult because of the vocabulary. For example, student 25 said, “protozoas and paramecia are hard words” and student 26 said, “the words were confusing.”
These two items were similar in that they both required student to interpret data from representations (a graph or table). In both cases, though, students were able to extract the correct information in order to respond to the question. In item 3, we have evidence that students were able to extract the information that they needed from the graph without engaging with the disciplinary core ideas targeted in the item. In item 13, some students did seem to take the information from the table and use it, along with their knowledge of what competition is, in order to get the correct response. However, not all students gave evidence that they used disciplinary core ideas to answer item 13. In addition, while we anticipated that the difficult vocabulary in item 13 would make it more difficult for students, many students just skipped these words when reading aloud and moved on with the item. Another hypothesis of our coding rubric was that representations such as tables or graphs would introduce more complexity into the item since they add the additional step of interpreting data into the process of responding to the item. However, many students indicated that for these items, the graphs and tables organized the information for them and this made the items easier.
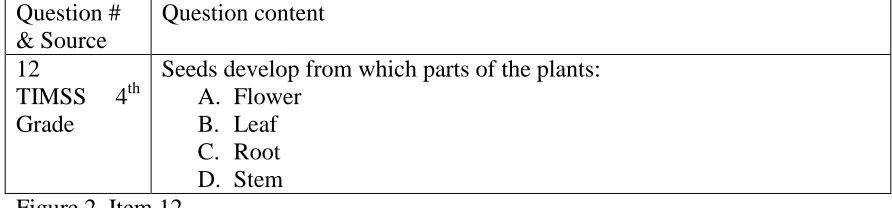
Item 12: coded as easy, but empirically difficult. Item 12 is a 4th grade multiple-choice item from TIMSS that asks students from which part of the plant seeds develop (Figure 2). We coded item 12 as easy since it was a lower level (level 1) disciplinary core idea and there were no representations or difficult text. However, in both the think-alouds and in the item response analysis, we discovered that students found this item difficult. Of the incorrect responses, almost all of them indicated that seeds develop from the root. In the think-alouds, many students shared their reasoning that since they knew that seeds are planted in the ground and that roots are found in the ground, the seeds must come from the roots (rather than realizing it is the other way around). For example, student 2 said, “They usually develop from a root or a stem. Hmm I think it’s the root because it’s down in the bottom where they usually plant them and grow.” Similarly, student 4 said, “Seeds usually develop under the dirt which is not by the flower so I can cross out that one. A leaf is usually above the dirt also so I can cross that one out. A root is usually a little bit under but and the stem is usually over so I would say C root” and student 21 said, “It doesn’t develop from the flower, that’s the top. It doesn’t develop from the leaf. It doesn’t develop from the stem, it develops from a root because it don’t grow from like the stem or develops from the flower, it grows from the root.”
Disciplinary Core Ideas and Practices in Assessment 17
Electronic Journal of Science Education ejse.southwestern.edu Question #
& Source
Question content
12
TIMSS 4th Grade
Seeds develop from which parts of the plants: A. Flower
B. Leaf C. Root D. Stem Figure 2. Item 12
Discussion
What Items Seem to Measure
Our findings indicate that items from different sources have different proportions of item types as well as items designed to elicit different types of processes from students. Thus the inferences drawn from these different assessments should take this into account. In particular, the NAEP and TIMSS assessments give students more opportunities for extended responses such as short answers and essays than state tests. In addition, NAEP had the highest proportion of explanation items and states had the lowest proportion, showing that state assessments may not be the best sources of information about students’ complex reasoning abilities. With the increased public awareness about the importance of complex thinking in science for a skilled workforce (e.g., National Research Council, 2007), the results from this study show that using information from state tests (specifically the MEAP) as indicators of students’ complex reasoning abilities may not be entirely appropriate.
Higher grade-band items generally allowed students more opportunities for extended response and scientific practices such as explanations and interpreting data. While, at surface level, this seems appropriate, not giving younger students adequate opportunities to demonstrate complex knowledge limits their ability to show us what they know and can do. In addition, not having a full range of item types for all content areas does not allow us to see the full range of students’ abilities. Giving students more opportunities to demonstrate their knowledge at all levels is important, especially as we know that with proper support, younger students are very capable of complex reasoning in science (Metz, 1997).
Electronic Journal of Science Education ejse.southwestern.edu classroom practices. However, when used in combination with open-ended tasks, this combination provides a fuller picture of what students understand.
Open-ended items that require written responses provide particularly useful insights to students’ level of conceptual understanding…. The use of multiple-choice items should be considered carefully because they are often overused to test low-level recall. Balanced with other items types, however, multiple-choice items are worthwhile for measuring knowledge of important facts and concepts as well as deductive reasoning skills.” (National Assessment Governing Board, 2004, p. 38-39)
Thus, multiple-choice items are not necessarily bad and in fact, there are many benefits to using multiple-choice items in combination with other types of items (Lukhele, Thissen & Wainer, 1994). In addition, having extended response items does not, necessarily, ensure that students will be allowed to demonstrate more complex types of knowledge or abilities. Just providing students the opportunities to give written responses does not guarantee that the information that they provide will be used to gather information of their deep conceptual understanding. For example, for the short response and extended response items that were on the most recent TIMSS, the grading rubric focused on giving credit for one correct answer, which limited the types of thinking that were given credit for and can be reported on (Wang, 2001). In addition, many extended response items only assess low-level skills such as asking students to recall basic facts or declarative knowledge (Metzenberg, 2004).
Students’ Interpretation of Items
Disciplinary Core Ideas and Practices in Assessment 19
Electronic Journal of Science Education ejse.southwestern.edu
Coded Cognitive Complexity
Simple Complex
O
b
serv
ed
I
tem
D
iffi
cu
lty
Easy “Good” item (good
design) AND/OR
Opportunity to learn (OTL)
Item design flaw AND/OR
Exceptionally effective instruction
AND/OR
Flawed assumptions
Hard Item design flaw
AND/OR No OTL
“Good” item AND/OR No OTL
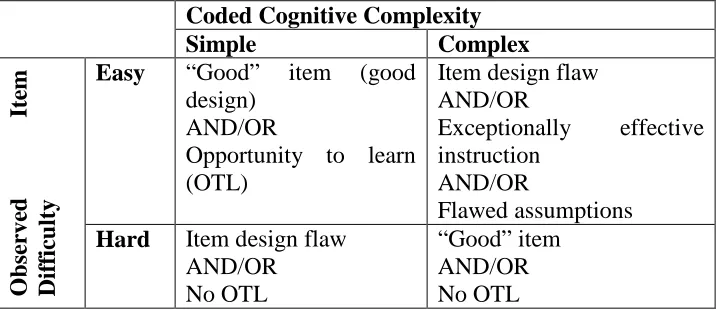
Figure 3: Coded versus observed item difficulty (Adapted from Huff & Ferrara, 2010).
Fusing Core Ecological Ideas with Scientific Practices
Electronic Journal of Science Education ejse.southwestern.edu of representations does not necessarily promote higher cognitive reasoning and engagement with scientific practices.
Many items in this sample tended to elicit either content (of a disciplinary core idea) or a scientific practice (e.g., analyzing or interpreting a table or graph) but not both. These findings suggest that as we develop new assessment items based on the NGSS, exploring ways to fuse core disciplinary ideas better with scientific practices (especially that of analyzing and interpreting data) – such that students need to incorporate both dimensions of their knowledge base to respond to an item – will be important (see Authors, 2013 for more some design criteria).
Opportunities to Learn
Item 12, which fell in the lower left quadrant, could either have a design flaw or students did not have the opportunity to learn this information. Students’ interactions with this item and the simplicity of this item do not point to a design flaw. Thus it is likely that students did not have the opportunity to learn information about plant parts and this is why students did not get it correct. Interestingly, students often reported having learned this content in school. However, if students’ lived experiences and prior knowledge is not taken into account when learning new material, they will not make these connections (NRC, 2000). While we do not have enough information to further explore this hypothesis, this finding is congruent with others who found that many urban students struggle with learning about plants (Bixler, Carlisle, Hammltt, Floyd, 2010; Frick, Birkenholz, Gardner, Machtmes, 1995). However, many students who thought-aloud about this item utilized solid reasoning strategies (plants start as a seed and grow from under the ground, therefore seeds must come from roots) even if they came to the incorrect conclusion. This is important information that could be given back to teachers to help them as they study plants and complex reasoning strategies in future units or grades.
Conclusions
With the addition of science to the NCLB testing cycle, more teachers are focusing on preparing students for the state science assessments. For example, in a survey within the Detroit Public Schools, the site of this study, middle school science teachers estimated that 40% of their academic year is devoted to related activities including taking, test windows and test-preparation activities (Author, 2005). Most of the education and educational measurement community is doubtful that high-stakes testing will confer an overall positive effect on the quality of student learning (Linn, 2000). However, the introduction of the NGSS provides the opportunity for assessment developers to examine their assessment items and ensure that they are adequately fusing disciplinary core knowledge (rather than discrete facts) with key scientific practices.
Disciplinary Core Ideas and Practices in Assessment 21
Electronic Journal of Science Education ejse.southwestern.edu know and can do. Tests that have items that are designed based on a solid theory of cognition allow us to make better and more valid inferences about how students’ performance on the items relates to what they know and can do more generally.
This material is based in part upon research supported by the National Science Foundation under grants REC-0089283 and REC-0129331. Any opinions, findings, and conclusion or recommendations expressed in this publication are those of the authors and do not necessarily reflect the views of the National Science Foundation.
References
AERA, APA, & NCME. (1999). Standards for educational and psychological testing. Washington DC: AERA.
Au, W. (2007). High stakes testing and curricular control: A qualitative metasynthesis. Educational Researcher 36: 258-267.
Berg, C. A., & Phillips, D. G. (1994). An Investigation of the Relationships between Logical Thinking Structures and the Ability to Construct and Interpret Line Graphs. Journal of Research in Science Teaching, 31(4), 323-344.
Bixler, R.D., Carlisle, C.L, Hammltt, W.E., Floyd, M.F. (1994). Observed fears and discomforts among urban students on field trips to wildland areas. The Journal of Environmental Education.26: 24-33.
Black, P. (2003). The importance of everyday assessment. In J. M. Atkin & J. E. Coffey (Eds.), Everyday assessment in the science classroom (pp. 1-11). Arlington, VA: NSTA Press. Bond, T.G. & Fox, C.M. (2001). Applying the Rasch model: Fundamental measurement in
human sciences. Mahwah, N.J.: Erlbaum.
Carroll, J. B. (1976). Psychometric tests as cognitive tasks: A new 'structure of intellect'. In L. B. Resnick (Ed.), The nature of intelligence. Hillsdale, N.J.: Erlbaum.
Cronbach, L. J. (1971). Test Validation. In R. L. Thorndike (Ed.), Educational Measurement (2nd Ed.). Washington, DC: American Council on Education.
Cronbach, L. J. (1988). Five perspectives on validity argument. In H. Wainer & H. I. Braun (Eds.), Test Validity (pp. 3-17). Hillsdale, NJ: Lawrence Erlbaum.
DeBarger, A. H., Quellmalz, E., Fried, R. & Fujii, R. (2006). Examining validities of science inquiry assessments with cognitive analyses. Paper presented at the Annual meeting of the American Educational Research Association (AERA), San Francisco, CA.
Delandshere, G., & Petrosky, A. R. (1998). Assessment of complex performances: Limitations of key measurement assumptions. Educational Researcher, 27, 14-24.
Emmerich, W. (1989). Appraising the cognitive features of subject tests (Research Report No. ETS-RR-89-53). Princeton, NJ: Educational Testing Service.
Electronic Journal of Science Education ejse.southwestern.edu Frick, M.J., Birkenholz, R.J., Gardner, H. & Machtmes, K. (1994). Rural and urban inner-city
high school student knoweldge and perception of agriculture. Journal of Agricultural Education. 36: 1-9.
Frederiksen, N. (1984). The real test bias: Influence of testing on teaching and learning. American Psychologist, 39, 193-202.
Gotwals, A. W. & Songer, N. B. (2013). Validity evidence for learning progression assessment items that fuse core disciplinary ideas and science practices. Journal of Research in Science Teaching. 50, 597-626.
Hamilton, L. S., Nussbaum, E. M., & Snow, R. E. (1997). Interview Procedures for Validating Science Assessments. Applied Measurement in Education, 10(2), 181-200.
Hyde, J.S., Lindberg, S.M., Linn, M.C., Ellis, A.B., & Williams, C.C. (2008). Gender similarities characterize math performance. Science (321): 494-495.
Huff, K & Ferrara, S. (2010, June). Frameworks for considering item response demands and item difficulty. In theory and research on item response demands: What makes items difficult? Construct-relevant? Symposium conducted at the meeting of the Council for the Chief State School Officers (CCSSO). Detroit, MI.
Jacob, B.A. (2005). Accountability, incentives and behavior: The impact of high-stakes testing in the Chicago public schools. Journal of Public Economics. 761-796.
Kane, M. T. (2001). Current concerns in validity theory. Journal of Educational Measurement, 38(4), 319-342.
Kennedy, M. M. (1999). Approximations to indicators of student outcomes. Educational Evaluation and Policy Analysis, 21(4), 345-363.
Krajcik, J., McNeill, K. L. & Reiser, B. (2008). Learning-goals-driven design model: Curriculum materials that align with national standards and incorporate project-based pedagogy. ScienceEducation, 92(1), 1-32.
Lane, S. (2004). Validity of high-stakes assessment: Are students engaged in complex thinking? Educational Measurement: Issues and Practice, 23(3), 6-14.
Lange, J. D. (1997). Looking through the TIMSS mirror from a teaching angle. [On line] Available: http://www.enc.org/topics/timss/additional/documents/0,1341,CDS-000158-cd158,00.shtm (August 4, 2009).
Lee. H, & Liu, O.L. (2009). Assessing Learning Progression of Energy Concepts Across Middle School Grades: The Knowledge Integration Perspective. Science Education, 94(4), 665-688.
Linn, M. C., Layman, J., & Nachmias, R. (1987). Cognitive consequences of microcomputer-based laboratories: Graphing skills development. Journal of Contemporary Educational Psychology, 12, 244-253.
Linn, R. L. (2000). Assessments and accountability. Educational Researcher 29(2), 4-16.
Lomax, R. G., West, M. M., Harmon, M. C., Viator, K. A., & Madaus, G. F. (1995). The impact of mandated standardized testing on minority students. Journal of Negro Education, 64(2), 171–185.
Lukhele, R., Thissen, D. & Wainer, H. (1994). On the relative value of multiple-choice, constructed-response, and examinee-selected items on two achievement tests. Journal of Educational Measurement. 31(3): 234-250.
Disciplinary Core Ideas and Practices in Assessment 23
Electronic Journal of Science Education ejse.southwestern.edu Martin, M. O., & Kelly, D. L. (1997). Technical report volume II: Implementation and analysis.
Chestnut Hill, MA: TIMSS International Study Center.
Masters, G.N. (1982). A Rasch model for partial credit scoring. Psychometrika, 47, 149-174. McMurrer, J. (2008) Instructional Time in Elementary Schools: a closer look at changes for
specific subjects. Center on Education Policy Washington, D.C.
Mergendoller, J. R., Marchman, V. A., Mitman, A. L., & Packer, M. J. (1988). Task demands and accountability in middle-grade science. Elementary School Journal, 88(3), 251-265. Messick, S. (1995). Validity of Psychological Assessment: Validation of inferences from
persons' responses and performances as scientific inquiry into score meaning. American Psychologist, 50(9), 741-749.
Metz, K. E. (1991). Development of explanation: Incremental and fundamental change in children's physics knowledge. Journal of Research in Science Teaching, 28(9), 785-797. Metz, K. E. (1997). On the complex relation between cognitive developmental research and
children's science curricula. Review of Educational Research, 67(1), 151-163.
Metzenberg, S. (2004). Science and mathematics testing: What’s right and wrong with the NAEP and the TIMSS? In W.M. Evers and H.J. Walberg (Eds.). Testing student learning, evaluating teacher effectiveness. Stanford, CA: Hoover Institution Press.
Milner, H. R. (2012) But what is urban eduation? Urban Education, 47(3), 556-561.
Mislevy, R. J., Steinberg, L.S., & Almond, R.G. (2003). On the structure of educational assessments. Measurement: Interdisciplinary research and perspectives. 1(1): 3-62.
Mokros, J. R., & Tinker, R. F. (1987). The impact of microcomputer-based science labs on children's ability to interpret graphs. Journal of Research in Science Teaching, 24, 369-383.
Mosher, F. & Young, L. J. (2009). Preface. In P. A. Moss, D.C. Pullin, J. G. Gee, E.H. Haertel, & L. J. Young (Eds.), Assessment, equity, and opportunity to learn. Nyew York, N.Y.: Cambridge University Press.
National Research Council. (2000). Inquiry and the National Science Education Standards: A Guide for Teaching and Learning. Washington, D.C.: National Research Council.
National Research Council (2000). How People Learn: Brain, Mind, Experience, and School. Washington D.C.: National Academy Press.
National Research Council. (2001). Knowing what students Know: The science and design of educational assessment. Washington D. C.: National Academy Press.
National Research Council. (2001a). Classroom Assessment and the National Science Education Standards. Washington D.C.: National Research Council.
National Research Council. (2007). Rising above the gathering storm: Energizing and employing American for a brighter economic future. Washington D.C.: The National Academies Press.
National Research Council. (2012). A Framework for K-12 science education: Practices, crosscutting concepts, and core ideas. Washington, DC: The National Academies Press. OECD. (2007). Green at fifteen? How 15-year-olds perform in environmental science and
geoscience in PISA 2006. Paris, France: Organisation for Economic Co-operation and Development.
Electronic Journal of Science Education ejse.southwestern.edu Pellegrino, J. W., & Glaser, R. (1979). Cognitive correlates and components in the analysis of
individual differences. In R. J. Sternberg & D. K. Detterman (Eds.), Human intelligence: Perspectives on its theory and measurement. Norwood, N.J. : Ablex.
Pellegrino, J. W. (2001). Rethinking and redesigning education assessment: Preschool through postsecondary. Denver, CO: Education Commission of the States.
Popham, W. J. (2005). F for assessment. Edutopia, 1(4), 38-41.
Rasch, G. (1960). Probabalistic models for some intelligence and attainment tests. Chicago: University of Chicago Press.
Roth, K. & Garnier, H. (2006). What science teaching looks like: An international perspective. Educational Leadership. 64(4): 16-23.
Schafer, W. (2002, August). Describing assessment for teaching and learning. Paper presented at the Optimizing State and Classroom Tests: Implications of Cognitive Research for Assessment of Higher Order Reasoning in Subject-Matter Domains, University of Maryland, College Park.
Scheuneman, J., Gerritz, K., & Embretson, S. E. (1991). Effects of prose complexity on achievement test item difficulty (Research Report). Princeton, NJ: Educational Testing Service.
Schneider, M. C., Huff, K.L., Egan, K.L., Tully, M. & Ferrara, S. (2010, June). Aligning achievement level descriptors to mapped item demands to enhance valid interpretations of scale scores and inform item development. In Theory and research on item response demands: What makes items difficult? Construct-relevant? Symposium conducted at the meeting of the Council for the Chief State School Officers (CCSSO). Detroit, MI.
Shepard, L. A. (2000). The role of assessment in a learning culture. Educational Researcher, 29(7), 4-14.
Songer, N.B. & Gotwals, A.W. (2012). Guiding explanation construction by children at the entry points of learning progressions. Journal for Research in Science Teaching, 49, 141-165. Songer, N. B., Kelcey, B. & Gotwals, A.W. (2009). How and when does complex reasoning
occur? Empirically driven development of a learning progression focused on complex reasoning in biodiversity. Journal of Research in Science Teaching. 46(6): 610-631. Songer, N.B. (2005) Congressional Testimony: Challenges to American Competitiveness in
Math and Science. Committee on Education and the Workforce, Subcommittee on 21st Century Competitiveness. United States House of Representatives. http://edworkforce.house.gov/hearings/109th/21st/mathscience051905/songer.htm
Swatton, P. (1995). Pupil performance in data manipulation and its relationship to the skill of interpretation. Educational Review, 47(1), 43-57.
Toth, E. E., Suthers, D. D., & Lesgold, A. M. (2002). Mapping to know: The effects of representation on guidance and reflective assessment on science inquiry. Science Education, 86(2), 264-286.
Vause, J., & Coates, D. (1999). What does it tell us? Developing skills to interpret evidence. Primary Science Review, 58, 18-21.
Wang, J. (2001). TIMSS primary and middle school data: Some technical concerns. Educational Researcher 30(6): 17-21.
Disciplinary Core Ideas and Practices in Assessment 25