Predictors of quality of life of patients
with type 2 diabetes
Ruth Kalda1 Anneli Rätsep1 Margus Lember2
1Department of Family Medicine,
University of Tartu, 2Department of
Internal Medicine, University of Tartu
Correspondence: Ruth Kalda Department of Family Medicine, University of Tartu, Puusepa 1a, Tartu 50406, Estonia
Tel +37 27 319 212 Fax +37 27 319 213 Email ruth.kalda@ut.ee
Background: Researchers have shown that patients with type 2 diabetes have a lower quality of life than the general population and also somewhat lower than patients with other chronic diseases. Thus one of the most important outcomes of treatment is optimizing the quality of life of the patient. This study examines the factors that most strongly infl uence the quality of life of patients with type 2 diabetes.
Methods: 200 patients with type 2 diabetes were studied in Estonia in 2004–2005. A patient blood sample, taken during a visit to the family doctor, was collected. The family doctor also provided data on each patient’s body mass index (BMI), blood pressure, and medications for treatment of type 2 diabetes. Patients completed a SF-36 during a doctor visit, and also a special questionnaire which we provided to study their awareness about diabetes type 2.
Results: The mean age of the respondents was 64.7 (±11.1) years and the mean duration of the diabetes was 7.5 (±1.8) years. Logistic regression analysis showed that quality of life was most signifi cantly affected by awareness of the complications and risk-factors of diabetes, and by the age, duration of the disease, and BMI of the patient. Patients who were less aware had a signifi cantly higher quality of life score (p 0.001 in all cases). The age and BMI of the patients as well as the duration of the diabetes all lowered the score of the quality of life.
Conclusions: The results suggest that the main challenges for physicians in management of diabetes type 2 are modifying patient BMI and patient awareness.
Keywords: diabetes type 2, quality of life, SF-36, awareness of patients, body mass index
Introduction
ratings of patient health do not necessarily correspond to patient ratings (Nerenz et al 1992). Patients may feel that severe dietary restriction and daily self-administration of oral medication or insulin also negatively affect their quality of life (Redekop et al 2002). Optimizing patient quality of life is a signifi cant treatment outcome. Therefore examining how patients with type 2 diabetes understand the factors that determine their quality of life is important.
The aim of the study was to examine which factors most strongly infl uence the quality of life of patients with type 2 diabetes.
Methods
The study was conducted in 2004–2005 in Estonia. A random sample of 40 doctors was constituted from the list of 163 family doctors of the Estonian Society of Family Doctors who had participated in our previous study (Rätsep 2006). Twenty-seven of the selected doctors agreed to participate in this study and 21 provided patient data. Every doctor sent a coded list of their patients with type 2 diabetes. From this list, 10 randomly selected patients were allocated to this study. All patients with type 2 diabetes were considered eligible, irrespective of age, duration of diabetes, and treatment. The family doctors were asked to recruit those patients who had been selected for the study. If one patient did not agree, the next patient on the list was selected. During a visit to the family doctor, the patients signed an informed consent document, to confi rm their participation in the study. The family doctors then took a blood sample from each patient to measure HbA1c, measured each patient’s height, weight, and blood pressure, and listed each patient’s medications for treating type 2 diabetes.
During the family doctor visit, patients completed the Rand 36-item short form health survey (SF-36), and gave the completed form to the doctor, who returned it to the investigators. The SF-36 data were scored according to the methods suggested in the SF-36 Health Survey: Manual and Interpretation Guide (Ware et al 1993). The eight domains used to assess patient health status in this analysis were: Physical Functioning, Role-Physical, Bodily Pain, General Health, Vitality, Role-Emotional, Social Functioning, and Mental Health. Raw scale scores were transformed to 0–100 scales, in which higher scores consistently represent better health status in all the dimen-sions measured.
A special questionnaire for the patients was developed by the research team, which included questions about their personal characteristics, duration of type 2 diabetes, and
other potential determinants of quality of life, for example, smoking status, knowledge about the disease and its risk factors and complications, as well as information sources concerning diabetes. The questionnaire was piloted before being used in the main study, and improved according to the results gained. Patients were asked about their knowledge of risk factors and complications of diabetes. The questions were very simple and had multiple choices, for example, “Do you know which kind of complications diabetes type 2 has?” If the patient had at least 75% of the answers right, he/she was coded as being “aware” of the nature of the disease.
The study was approved by the Ethics Review Committee on Human Research of the Tartu University.
Statistics
The Statistical Package for the Social Sciences (SPSS 10.0) for Windows was used in the analysis. Associations between patient characteristics and the self-reported quality of life of the patients were analyzed using nonparametric tests (Mann-Whitney U test or Kruskal-Wallis test). Nonparametric tests were used because the subscales of SF-36 were not normally distributed. Factors infl uencing the health of patients with type 2 diabetes were analyzed using logistic regression analysis. Factors used in the logistic regression model were 1) patient related factors: age, gender, body mass index (BMI), smoking status, awareness of disease, and 2) disease related factors: duration of diabetes, treatment regimen (diet, oral medica-tion, or insulin), HbA1c level, and blood pressure level. Any p-values lower than 0.05 were considered signifi cant.
Results
Altogether 200 patients with type 2 diabetes were studied; 69% of them were females and 31% were males (Table 1). The mean age of the respondents was 64.7 years (±11.1) and the mean duration of the diabetes was 7.5 (±1.8) years. Most of the patients (70%) were receiving only oral treatment; 16% were receiving insulin treatment for diabetes (Table 1). Only one-fourth (24%) of the patients were classifi ed as “being aware” of the complications and the risk factors of their disease.
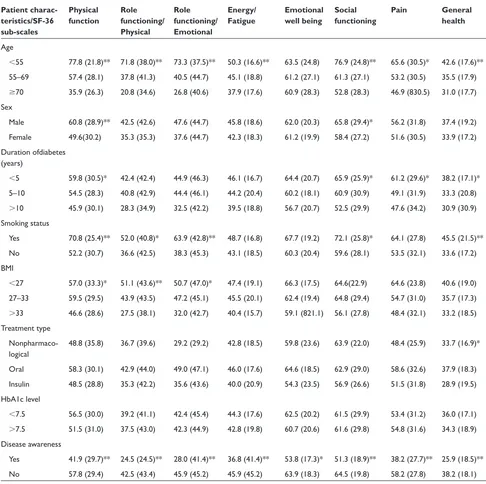
of quality of life (p 0.001 in all cases) (Table 2). The sex of the patient, duration of diabetes, smoking status, and body mass index also had an important infl uence on most of the sub-scales of quality of life. The type of treatment received for type 2 diabetes had only a minor effect, and the level of glycosylated hemoglobin had no effect, on the quality of life of patients with type 2 diabetes (Table 2).
When accounting for all the variables listed in Table 1, logistic regression analysis showed that quality of life was most signifi cantly affected by the extent of the patient’s awareness of the complications and risk factors of diabetes, and by age, duration of disease, and BMI (Table 3). Patients who were not well informed had a signifi cantly higher quality of life score. Patients’ age, BMI, and duration of diabetes all lowered the quality of life score (Table 3).
Discussion
This Estonian study aimed to establish the most signifi cant factors that infl uence the quality of life of patients with
type 2 diabetes. So far this is the fi rst study on the quality of health of diabetes patients in Estonia.
Patient-perceived health status was measured using the SF-36 health survey instrument, which is approved as appropriate for examining relationships between patient experience with diabetes, quality of life and other chronic diseases, and is reliable and valid in assessing of diabetic health status (Jacobson et al 1994; Woodcock 2001). The average values of SF-36 in different domains demonstrated, as expected, lower values when compared with population averages (Lai et al 2001).
Several studies are being and have been conducted to fi nd out which factors infl uence the quality of life of patients with type 2 diabetes. The results have been contradictory, however, especially concerning the effect of the metabolic control of diabetes on quality of life (Weinberger et al 1994; Larsson et al 1999), the treatment regimen (Ware et al 1993; U.K. Prospective Diabetes Study Group 1999; Redekop et al 2002; Saito et al 2006), and the duration of the disease (Aalto et al 1997; Redekop et al 2002; Saito et al 2006). Although by using univariate analysis we found that the sex of the patient, smoking status, and treatment type had some effect on the health-related quality of life, these factors were not signifi cant after adjustment for other variables. Only the age and body mass index of the patient, as well as the duration of diabetes and whether the patient was aware of the complications and risk factors of the disease, had an independent effect on the quality of health and life. Older patients with type 2 diabetes assessed their quality of life as being signifi cantly lower than younger patients, especially concerning physical function-ing, role limitations due to physical functionfunction-ing, emotional functioning, and social functioning. These findings are consistent with other studies conducted on diabetes patients (Caruso et al 2000; Redekop et al 2002) and also with studies on the general population (McHorney et al 1994). The effect of obesity in lowering the health-related quality of life of patients with type 2 diabetes, and the general population, was found to be similar in all studies (Redekop et al 2002; Jia and Lubetkin 2005; Huang et al 2006). In our study obese patients had especially low ratings in the emotional and physical role scales. It seems that the main challenge for doctors, and patients with type 2 diabetes, is promoting regular exercise and weight loss, which are shown to improve the functional as well as emotional status of patients (Glasgow et al 1997; Caruso et al 2000; Maddigan et al 2005). Moreover, research-ers have found that the level of self-reported exercise was the only signifi cant self-management behavior to predict quality of life and body mass index (Glasgow et al 1997; Maddigan
Table 1 Characteristics of respondents and distribution of SF-36 scales
Patient characteristics (N = 200)
Mean (SD) age (years) 64.7 (±11.1)
Mean duration of type 2 diabetes (years) 7.5 (±1.8)
Mean BMI index 33.0 (±6.0)
Mean HbA1c level 7.5 (±6.7)
Treatment type
Nonpharmacological 14%
Only oral 70%
Insulin 16%
Smoking status
Yes 16%
No 84%
Mean blood pressure level (mmHg)
Systolic 149.3 (±18.3)
Diastolic 86.2 (±11.9)
Gender
Female 61%
Male 39%
Awareness of the disease and its complications
Yes 24%
No 76%
Mean (SD) SF-36 scores
Physical functioning 54.0 (±30.1) Role functioning/physical 38.1 (±42.2) Role functioning/emotional 41.6 (±44.8)
Energy/fatigue 43.7 (±18.4)
Emotional well being 61.5 (±20.0)
Social functioning 61.3 (±28.2)
Pain 53.4 (±30.9)
General health 35.3 (±18.1)
et al 2005). However, the level of exercise should be optimal, because beyond that, the effect of exercise on quality of life becomes more negative (Watkins et al 2000).
Previous studies have shown controversial results on the effect of the duration of diabetes on quality of life. Most stud-ies have found no effect (Aalto et al 1997; Rubin and Peyrot 1999; Redekop et al 2002), but some have shown a negative effect (Wubben and Porterfi eld 2005; Saito et al 2006). Our study confi rms the negative effect of duration of diabetes on
the energy and general health of the patient, as well as on emotional well-being and social functioning. There could be different reasons for this fi nding. Development of complica-tions in the later stage of the disease, decreases quality of life. In the years of its duration, diabetes clearly has a tendency to worsen. As complications develop, new symptoms emerge and the treatment regimen tends to become more complex.
The key question is how patients manage their disease. A positive connection has been found between active,
Table 2 Patient and disease-related characteristics and SF-36 sub-scales (mean scores of the sub-scales and SD)
Patient charac-teristics/SF-36 sub-scales
Physical function
Role functioning/ Physical
Role functioning/ Emotional
Energy/ Fatigue
Emotional well being
Social functioning
Pain General
health
Age
55 77.8 (21.8)** 71.8 (38.0)** 73.3 (37.5)** 50.3 (16.6)** 63.5 (24.8) 76.9 (24.8)** 65.6 (30.5)* 42.6 (17.6)** 55–69 57.4 (28.1) 37.8 (41.3) 40.5 (44.7) 45.1 (18.8) 61.2 (27.1) 61.3 (27.1) 53.2 (30.5) 35.5 (17.9)
70 35.9 (26.3) 20.8 (34.6) 26.8 (40.6) 37.9 (17.6) 60.9 (28.3) 52.8 (28.3) 46.9 (830.5) 31.0 (17.7) Sex
Male 60.8 (28.9)** 42.5 (42.6) 47.6 (44.7) 45.8 (18.6) 62.0 (20.3) 65.8 (29.4)* 56.2 (31.8) 37.4 (19.2) Female 49.6(30.2) 35.3 (35.3) 37.6 (44.7) 42.3 (18.3) 61.2 (19.9) 58.4 (27.2) 51.6 (30.5) 33.9 (17.2) Duration ofdiabetes
(years)
5 59.8 (30.5)* 42.4 (42.4) 44.9 (46.3) 46.1 (16.7) 64.4 (20.7) 65.9 (25.9)* 61.2 (29.6)* 38.2 (17.1)* 5–10 54.5 (28.3) 40.8 (42.9) 44.4 (46.1) 44.2 (20.4) 60.2 (18.1) 60.9 (30.9) 49.1 (31.9) 33.3 (20.8)
10 45.9 (30.1) 28.3 (34.9) 32.5 (42.2) 39.5 (18.8) 56.7 (20.7) 52.5 (29.9) 47.6 (34.2) 30.9 (30.9) Smoking status
Yes 70.8 (25.4)** 52.0 (40.8)* 63.9 (42.8)** 48.7 (16.8) 67.7 (19.2) 72.1 (25.8)* 64.1 (27.8) 45.5 (21.5)** No 52.2 (30.7) 36.6 (42.5) 38.3 (45.3) 43.1 (18.5) 60.3 (20.4) 59.6 (28.1) 53.5 (32.1) 33.6 (17.2) BMI
27 57.0 (33.3)* 51.1 (43.6)** 50.7 (47.0)* 47.4 (19.1) 66.3 (17.5) 64.6(22.9) 64.6 (23.8) 40.6 (19.0) 27–33 59.5 (29.5) 43.9 (43.5) 47.2 (45.1) 45.5 (20.1) 62.4 (19.4) 64.8 (29.4) 54.7 (31.0) 35.7 (17.3)
33 46.6 (28.6) 27.5 (38.1) 32.0 (42.7) 40.4 (15.7) 59.1 (821.1) 56.1 (27.8) 48.4 (32.1) 33.2 (18.5) Treatment type
Nonpharmaco-logical
48.8 (35.8) 36.7 (39.6) 29.2 (29.2) 42.8 (18.5) 59.8 (23.6) 63.9 (22.0) 48.4 (25.9) 33.7 (16.9)*
Oral 58.3 (30.1) 42.9 (44.0) 49.0 (47.1) 46.0 (17.6) 64.6 (18.5) 62.9 (29.0) 58.6 (32.6) 37.9 (18.3) Insulin 48.5 (28.8) 35.3 (42.2) 35.6 (43.6) 40.0 (20.9) 54.3 (23.5) 56.9 (26.6) 51.5 (31.8) 28.9 (19.5) HbA1c level
7.5 56.5 (30.0) 39.2 (41.1) 42.4 (45.4) 44.3 (17.6) 62.5 (20.2) 61.5 (29.9) 53.4 (31.2) 36.0 (17.1)
7.5 51.5 (31.0) 37.5 (43.0) 42.3 (44.9) 42.8 (19.8) 60.7 (20.6) 61.6 (29.8) 54.8 (31.6) 34.3 (18.9) Disease awareness
Yes 41.9 (29.7)** 24.5 (24.5)** 28.0 (41.4)** 36.8 (41.4)** 53.8 (17.3)* 51.3 (18.9)** 38.2 (27.7)** 25.9 (18.5)** No 57.8 (29.4) 42.5 (43.4) 45.9 (45.2) 45.9 (45.2) 63.9 (18.3) 64.5 (19.8) 58.2 (27.8) 38.2 (18.1)
Notes: * p 0.05; **p 0.01.
problem-oriented management behavior and an improved quality of life (Anderson et al 2000). If patients believe they are able to perform disease-specifi c behavior, which will be relevant to the outcome of the disease, they can positively infl uence health-related quality of life (Aalto et al 1997). But if the patient persists with emotion-oriented manage-ment, this may have a negative impact on psychosocial well being, causing an increased sense of burden which in turn will affect interactions with others (Watkins et al 2000). The longer patients have the illness, the worse they feel. They may lose energy, feel fatigue, and their social functioning may sharply decrease, as demonstrated in our study. Furthermore, we found that being aware of the disease and its possible complications negatively affects the patient’s quality of life. Our results confl ict with studies on the psychosocial aspects of diabetes, which found that those with extensive knowledge and understanding of their disease have a more positive qual-ity of life (Anderson et al 2000; Watkins et al 2000). How-ever, similar results to our study were demonstrated among
patients with hypertension (Li et al 2005). Researchers found that subjects aware of having high blood pressure had a lower health-related quality of life score than subjects with high blood pressure, who were unaware of the diagnosis (Li et al 2005). The barriers most frequently reported by patients in previous studies were helplessness and frustration as a result of lack of glycemic control, and continued progres-sion of the disease despite adherence (Nagelkerk et al 2006). Therefore knowledge about the disease is not enough to guarantee improved quality of life. However, the results of a US study demonstrated that well-informed and motivated patients were more successful in obtaining and maintaining good control of their risk factors (Rachmani et al 2005). The negative effect on patients’ quality of life as a result of their greater awareness of the disease, might be infl uenced by differences in information delivery. Whilst patients can be educated toward greater autonomy, not all health profes-sionals are ready to work in partnership with them. The study highlighted the importance of clinical staff not only gaining a better understanding of diabetes management, but also of the theoretical principles underlying patient empowerment (Cooper et al 2003).
Conclusions
Our study demonstrated that the most important factors affecting the quality of life of patients with type 2 diabetes are age, duration of diabetes, BMI, and the extent of their understanding and awareness of their disease. BMI and patient awareness and understanding of disease are modifi -able risk factors, but are extremely challenging issues for physicians. Family doctors should work in closer partnership with patients in order to enhance their abilities to be more autonomous in controlling their own risk factors, and learning and maintaining problem-oriented behavior.
Acknowledgment
The data referred to in the current report have been gathered with support of the Estonian Science Foundation grant No 6452. The authors report no confl ict of interest.
References
Aalto AM, Uutela A, Aro AR. 1997. Health-related quality of life among insulin-dependent diabetics: Disease-related and psychosocial cor-relates. Patient Educ Coun, 30:215–25.
Anderson RM, Funell MM, Fitzgerald JT, et al. 2000. The Diabetes Empow-erment Scale. A measure of psychosocial self-effi cacy. Diabetes Care 2000, 23:739–43.
Bagne CA, Luscombe FA, Damiano A. 1995. Relationships between glycemic control, diabetes-related symptoms and SF-36 scale scores of patients with non-insulin dependent diabetes mellitus. Qual Life Res, 4:392–93.
Table 3 Patient characteristics and patient health (multivariate regression analysis)**
Subscales of patient health/ B-coeffi cient p-value Patient characteristics
Physical functioning
Age −0.538 0.000
BMI −0.286 0.000
Awareness* 0.182 0.000
Role functioning/Physical
Age −0.416 0.000
BMI −0.286 0.000
Awareness* 0.195 0.008
Role functioning/Emotional
Age −0.395 0.000
BMI −0.211 0.004
Awareness* 0.217 0.005
Energy/Fatigue Duration of diabetes −0.190 0.021
Awareness* 0.190 0.021
Emotional well being
Duration of diabetes −0.203 0.012
Awareness* 0.244 0.003
Social functioning
Age −0.252 0.002
Duration of diabetes −0.223 0.005
Awareness* 0.180 0.02
Pain
Age −0.229 0.000
Awareness* 0.259 0.004
General health
Duration of diabetes −0.185 0.000
Awareness* 0.300 0.020
Barr RG, Nathan DM, Meigs JB, et al. 2002. Tests of glycemia for the diagnosis of type 2 diabetes mellitus. Ann Intern Med, 137:263–72. Caruso LB, Silliman RA, Demissie S, et al. 2000. What can we do to improve
physical function in older persons with type 2 diabetes? J Gerontol A Biol Sci Med Sci, 55:M372–7.
Cooper HC, Booth K, Gill G. 2003. Patients’ perspectives on diabetes healthcare education. Health Educ Res 2003, 18:191–206.
Glasgow RE, Ruggiero L, Eakin EG, et al. 1997. Quality of life and associ-ated characteristics in a large national sample of adults with diabetes.
Diabetes Care, 20:562–67.
Huang IC, Frangakis C, Wu AW. 2006. The relationship of excess body-weight and health-related quality of life: evidence from a population study in Taiwan. Int J Obes (Lond), 30:1250–9.
Jacobson AM, De Groot M, Samson JA. 1994. The evaluation of two measures of quality of life of patients with type 1 and type 2 diabetes.
Diabetes Care, 17:267–74.
Jia H, Lubetkin EI. 2005. The impact of obesity on health-related quality-of-life in the general adult US population. J Public Health, 27:156–64. Lai T, Kallikorm R, Salupere R, et al. 2001. Health related quality of life in
chronic diseases in Estonia (in Estonian). Eesti Arst, 80:450–55. Larsson D, Larger I, Nilsson PM. 1999. Socio-economic characteristics and
quality of life in diabetes mellitus: relation to metabolic control. Scand J Public Health, 27:101–5.
Lau CY, Qureshi AK, Scott SG. 2004. Association between glycemic control and quality of life in diabetes mellitus. J Postgrad Med, 3:189–94. Li W, Liu L, Prunte JG, et al. 2005. Hypertension and health-related quality
of life: an epidemiological study of patients attending hospital clinics in China. J Hypertens, 23:1635–36.
Maddigan SL, Majumdar SR, Johnson JA. 2005. Understanding the complex association between patient-provider relationships, self-care behaviors, and health-related quality of life in type 2 diabetes: a structural equation modeling approach. Qual Life Res, 14:1489–1500.
McHorney CA, Ware JE, Lu JF, et al. 1994. The MOS 36-item Short Form Health Survey (SF-36) III. Med Care, 32:40–66.
Nagelkerk J, Reick K, Meengs L. 2006. Perceived barriers and effective strategies to diabetes self-management. J Adv Nurs, 54:151–8. Nerenz DR, Repasky DP, Whitehouse FW et al. 1992. Ongoing
assess-ment of health status of patients with diabetes mellitus. Med Care, 30:MS112–23.
Rachmani R, Slavacheski I, Berla M, et al. 2005. Treatment of high-risk patients with diabetes: motivation and teaching intervention: a ran-domized, prospective 8-year follow-up study. J Am Soc Nephrol, 16: S22–6.
Redekop WK, Koopmanschap MA, Stolk RP, et al. 2002. Health-related quality of life and treatment satisfaction in Dutch patients with type 2 diabetes. Diabetes Care, 25:458–63.
Rubin RR, Peyrot M. 1999. Quality of life and diabetes. Diabetes Metab Res, 9; 15:205–18.
Ratsep A, Kalda R, Oja I, et al. 2006. Family doctors’ knowledge and self-reported care of type 2 diabetes patients in comparison to the clinical practice guideline: cross-sectional study. BMC Fam Pract, 16:36. Saito I, Inami F, Ikebe T, et al. 2006. Impact of diabetes on health-related
quality of life in a population study in Japan. Diabetes Res Clin Pract, 73:51–7.
Testa MA, Simonson DC. 1998. Health economic benefi ts and quality of life during improved glycemic control of patients with type 2 dia-betes mellitus: A randomized, controlled, double-blind trial. JAMA, 80:1490–96.
Turner R, Millns H, Neil H, et al. 1998. Risk factors for coronary artery disease in non-insulin-dependent diabetes mellitus: United Kingdom prospective diabetes study. BMJ, 316:823–28.
U.K. Prospective diabetes Study Group. 1999. Quality of life in type 2 diabetic patients is affected by complications but not by intensive policies to improve blood glucose or blood pressure control. Diabetes Care, 7:1125–36.
Ware JE, Snow KK, Kosinski M, et al. 1993. SF-36 Health Survey Manual and Interpretation Guide. The Health Institute, New England Medical Center, Boston, Massachusetts.
Watkins KW, Connell CM, Fitzgerald JT, et al. 2000. Effect of adults’ self-regulation of diabetes on quality-of-life outcomes. Diabetes Care, 23:1511–15.
Weinberger M, Kirkman MS, Samsa GP, et al. 1994. The relation-ship between glycemic control and health-related quality of life of patients with non-insulin dependent diabetes mellitus. Diabetes Care, 32:1173–82.
Woodcock AJ, Julious SA, Kinmouth AL, et al. 2001. Problems with the performance of SF-36 among people with type 2 diabetes in general practice. Qual Life Res, 10:661–70.