OncoTargets and Therapy
Dove
press
O r i g i n a l r e s e a r c h
open access to scientific and medical research
Open access Full Text article
Identification of differentially expressed genes and
signaling pathways in ovarian cancer by integrated
bioinformatics analysis
Xiao Yang1
shaoming Zhu2
li li3
li Zhang1
shu Xian1
Yanqing Wang1
Yanxiang cheng1
1Department of Obstetrics and
gynecology, 2Department of Urology,
Renmin Hospital of Wuhan University,
3Department of Pharmacology,
Wuhan University Health science center, Wuhan, hubei, People’s Republic of China
Background: The mortality rate associated with ovarian cancer ranks the highest among gynecological malignancies. However, the cause and underlying molecular events of ovarian cancer are not clear. Here, we applied integrated bioinformatics to identify key pathogenic genes involved in ovarian cancer and reveal potential molecular mechanisms.
Results: The expression profiles of GDS3592, GSE54388, and GSE66957 were downloaded from the Gene Expression Omnibus (GEO) database, which contained 115 samples, including 85 cases of ovarian cancer samples and 30 cases of normal ovarian samples. The three microar-ray datasets were integrated to obtain differentially expressed genes (DEGs) and were deeply analyzed by bioinformatics methods. The gene ontology (GO) and Kyoto Encyclopedia of Genes and Genomes (KEGG) pathway enrichments of DEGs were performed by DAVID and KOBAS online analyses, respectively. The protein–protein interaction (PPI) networks of the DEGs were constructed from the STRING database. A total of 190 DEGs were identified in the three GEO datasets, of which 99 genes were upregulated and 91 genes were downregulated. GO analysis showed that the biological functions of DEGs focused primarily on regulating cell proliferation, adhesion, and differentiation and intracellular signal cascades. The main cellular components include cell membranes, exosomes, the cytoskeleton, and the extracellular matrix. The molecular functions include growth factor activity, protein kinase regulation, DNA binding, and oxygen transport activity. KEGG pathway analysis showed that these DEGs were mainly involved in the Wnt signaling pathway, amino acid metabolism, and the tumor signaling pathway. The 17 most closely related genes among DEGs were identified from the PPI network.
Conclusion: This study indicates that screening for DEGs and pathways in ovarian cancer using integrated bioinformatics analyses could help us understand the molecular mechanism underlying the development of ovarian cancer, be of clinical significance for the early diagnosis and preven-tion of ovarian cancer, and provide effective targets for the treatment of ovarian cancer.
Keywords: ovarian cancer, GEO data, integrated bioinformatics, differentially expressed genes
Introduction
The mortality rate of ovarian cancer ranks the first among the malignant tumors that occur in female reproductive organs, and the incidence of this cancer is increasing each year. More than 200,000 new cases of ovarian cancer occur each year in the world, resulting in .140,000 deaths.1 The incidence of ovarian cancer is occult, early
diagnosis is difficult, and invasion and metastasis occur easily. When ovarian cancer is detected, the patient is usually at an advanced stage of the disease. The 5-year survival rate of patients with advanced ovarian cancer is only ~20%, but for patients in the early stage, it can reach 85%–90%.2 At present, the commonly used methods correspondence: Yanxiang cheng
Department of Obstetrics and Gynecology, Renmin Hospital of Wuhan University, 99 Zhang Zhidong road, Wuhan, hubei 430060, People’s Republic of China Tel +86 189 711 1 6435 email dryx5200@sina.com
Journal name: OncoTargets and Therapy Article Designation: Original Research Year: 2018
Volume: 11
Running head verso: Yang et al
Running head recto: DEGs and signaling pathways in ovarian cancer DOI: 152238
OncoTargets and Therapy downloaded from https://www.dovepress.com/ by 118.70.13.36 on 25-Aug-2020
For personal use only.
Dovepress Yang et al
for the early diagnosis and monitoring of ovarian cancer are ultrasonography combined with serum tumor marker assays, but there are some limitations, and the specificity is not high. Computed tomography (CT) and positron emission tomogra-phy (PET) can only detect lesions with a volume of $1 cm, and they cannot detect early tumor metastasis. At present, the treatment of ovarian cancer includes surgical staging, sur-gery, reoperation, staging sursur-gery, cytoreductive sursur-gery, postoperative combined chemotherapy, radiotherapy, and biological treatment. In recent years, the clinical diagnosis and treatment of ovarian cancer have improved, but the 5-year survival rate of patients is still 30%.3 The reasons that
lead to a failure of treatment, tumor recurrence, and the low survival rate include its insidious onset, the fact that ovarian cancer is not usually detected at an early stage and cannot be removed effectively by surgery, and the fact that tumor cells have a primary or secondary tolerance to radiotherapy and chemotherapy.4 Therefore, it is important to study the
underlying molecular mechanisms of the malignant biologi-cal behavior of ovarian cancer cells and therefore identify more effective early diagnostic techniques and more reliable molecular markers for monitoring recurrence and evaluat-ing prognosis, as well as to explore a more effective way to block and control tumor cell proliferation, metastasis, and the reversal of drug resistance in cancer cells. As an efficient and large-scale technique for acquiring genetic data, gene expression microarrays have been widely used to collect gene chip expression profiling data and to study gene expres-sion profiles in many human cancers. These microarrays provide a new method for studying tumor-related genes and offer promising prospects for molecular prediction, drug-based molecular targeting, and molecular therapy.5,6 With
the widespread application of gene expression microarray technology, a large amount of data have been published on public database platforms, and integrating these databases can allow a deeper study of molecular mechanisms.
At present, a large number of studies have been performed on ovarian gene expression profiles, and these studies have screened thousands of differentially expressed genes (DEGs) that may be involved in the development and progression of ovarian cancer.7 However, the results for the
identifica-tion of significantly expressed mRNAs are inconsistent or discrepant among different studies due to tissue or sample heterogeneity among each independent experiment, different technological detection platforms, different data processing methods, and the fact that the samples come from differ-ent backgrounds. Thus, there are still some limitations in a single-cohort study, and we should integrate their results using an unbiased approach. The integration and analysis of
microarray data from several gene expression profiles may resolve these problems and enable the discovery of effective and reliable molecular markers. The RobustRankAggreg (RRA) approach has been specifically designed for the comparison of several ranked gene lists.8 The RRA method
uses a probabilistic model for aggregation that is robust to noise and facilitates the calculation of significance prob-abilities for all the elements in the final ranking. The RRA method is able to view the ranking of each item in each list, and it compares this ranking with the baseline case where all the preference lists are randomly ordered. The P-value can represent the rank location and significance of a gene. The higher the gene ranks, the smaller the P-value is. RRA is a suitable and effective integrative analysis solution for the identification of statistically significant genes. In addition, it is useful when different kinds of genes are obtained by different technology platforms and full rankings of mRNAs are not available.
In this study, we have downloaded three original microar-ray datasets, GDS3592,9 GSE54388,10 and GSE66957 (Cheng
et al, unpublished data, 2015), from the NCBI-Gene Expres-sion Omnibus (GEO) database (https://www.ncbi.nlm.nih. gov/geo/), which contained a total of 115 samples, with 85 cases of ovarian cancer samples and 30 cases of normal ovarian samples. DEGs in ovarian cancer and normal ovarian samples were screened using the R software, and the gene ontology (GO) pathway enrichment analysis of DEGs was performed on DAVID (https://david.ncifcrf.gov/) and KOBAS-Kyoto Encyclopedia of Genes and Genomes (KEGG) pathways (http://kobas.cbi.pku.edu.cn/). Then, the STRING online database protein–protein interaction (PPI) network was used to analyze the association of DEGs and discover the molecu-lar interactions involved in tumorigenesis. In conclusion, the DEGs associated with the carcinogenesis and development of ovarian cancer were screened through the GEO database of ovarian cancer and an integrated analysis was conducted. The biological functions and key signaling pathways of these DEGs are discussed, and the encoding protein interaction network was analyzed. Our study provides reliable molecu-lar markers for early detection and prognosis, as well as effective drug targets for treating ovarian cancer.
Materials and methods
Microarray data
DNA microarray is a new technique that can analyze genome and characteristic map of gene expression. A variety of DNA microarray and DNA chip devices and systems have now been developed and commercialized. DNA microarray analysis includes an oligonucleotide chip, cDNA chip, and
OncoTargets and Therapy downloaded from https://www.dovepress.com/ by 118.70.13.36 on 25-Aug-2020
Dovepress Degs and signaling pathways in ovarian cancer
genomic chip, and is divided into the following two modes: one is to fix the target DNA on the support, which is suitable for the analysis of a large number of different target DNAs, and another involves fixing a large number of probes on the support material, which is suitable for the analysis of different probe sequences of the same target DNA.11 There
are various platforms available (http://arrayconsortium.tgen. org/np2/home.do; http://www1.amershambiosciences.com/ APTR1X/upp01077.nsf/Contentand/codelink_bioarray_sys-tem; http://www.affymetrix.com; http://www.illumina.com/ prod_expression.htm; and http://www.nimblegen.com; http:// www.xeotron.com).12
Using the keywords “ovarian cancer geo accession” to search on the GEO DataSets database (https://www.ncbi.nlm. nih.gov/geo/), the gene expression profiles of GDS3592,9
GSE54388,10 and GSE66957 (Cheng et al, unpublished
data, 2015) were downloaded. The platform for GDS3592 is GPL570, [HG-U133_Plus_2] Affymetrix Human Genome U133 Plus 2 Array, which includes 12 normal ovarian surface epithelial samples and 12 serous papillary ovarian adenocar-cinomas specimens. The platform for GSE54388 is GPL570, [HG-U133_Plus_2] Affymetrix Human Genome U133 Plus 2 Array, which consists of six ovarian surface epithelium sam-ples and 16 high-grade serous ovarian cancer samsam-ples. The platform for GSE66957 is GPL15048 Rosetta/Merck Human RSTA Custom Affymetrix 2 microarray [HuRSTA_2a520709. CDF], which includes 12 normal ovarian surface epithelium samples and 57 high-grade serous ovarian cancer samples. Platform and series matrix file(s) were downloaded as TXT files. The dataset information is shown in Table 1. The R software package was used to process the downloaded files and to convert and reject the unqualified data. The data were calibrated, standardized, and log2 transformed.
Screening for DEGs
The downloaded platform and series of matrix file(s) were converted using the R language software and annotation pack-age. The ID corresponding to the probe name was converted into an international standard name for genes (gene symbol) and saved in a TXT file. Gene differential expression analysis was performed using the limma package in the Bioconductor package (available online: http://www.bioconductor.org/).
The related operating instruction codes were put into R, and the DEGs in ovarian cancer and normal ovarian samples of the three microarray datasets were analyzed by the limma software package. Samples with a corrected P-value of ,0.05 and log fold change (FC) .2 were considered DEGs. The TXT results were preserved for subsequent analysis.
Integration of microarray data
The list of DEGs from the three microarray datasets obtained by limma packet analysis was saved as a TXT file. The RRA software package was downloaded, and R was used to run the instruction code. A list of genes that were up- or downregu-lated in the three chips were used for subsequent analysis. The RRA approach is openly available in the Comprehensive R Network (http://cran.r-project.org/).
gO and Kegg pathway enrichment
analyses of DEGs
The DAVID database (https://david.ncifcrf.gov/) is an essen-tial foundation for the success of any high-throughput gene function analysis. The functional and pathway enrichment of the proteins encoded by candidate genes were analyzed, and these genes were annotated using the DAVID database.13
GO annotations were performed using a DAVID online tool on the screened DEGs. KEGG pathway analysis of DEGs was performed using the KOBAS online analysis database (available online: http://kobas.cbi.pku.edu.cn/). In this study, we analyzed the DEGs that were significantly up- and downregulated as determined from integrated microarray ovarian cancer data, and a P-value of ,0.05 was considered statistically significant.
PPI network integration
The STRING database (http://string-db.org/) is a software system that is commonly used to identify the interactions between known proteins and predicted proteins. The results in this database are obtained from experimental data, data-bases, text mining, and predictive bioinformatics data.14
In addition, the core of the Cytoscape software is a network. Each node is a gene, protein, or molecule, and the connections between nodes represent the interaction of these biological molecules, which can be used to identify interactions and
Table 1 Details for GEO ovarian cancer data
Reference Sample GEO Platform Normal Tumor
Bowen et al (2009)9 Ovarian GDS3592 GPL570 12 12
Yeung et al (2017)10 Ovarian gse54388 GPL570 6 16
Cheng et al (unpublished data, 2015) Ovarian GSE66957 GPL15048 12 57
OncoTargets and Therapy downloaded from https://www.dovepress.com/ by 118.70.13.36 on 25-Aug-2020
Dovepress Yang et al
pathway relationships between the proteins encoded by DEGs in ovarian cancer. The corresponding proteins in the central node may be core proteins or key candidate genes with important physiological regulatory functions.
Results
Microarray data information and
identification of DEGs in ovarian cancer
The ovarian cancer expression microarray datasets GDS3592, GSE54388, and GSE66957 were standardized, and the results are shown in Figure 1. When the GDS3592 dataset wasscreened by the limma package (corrected P-value ,0.05, logFC .2), 839 DEGs were obtained. Among them, 289 down-regulated genes and 550 updown-regulated genes were identified. Overall, 255 DEGs were screened from the GSE54388 data-set, including 96 upregulated genes and 159 downregulated genes. Additionally, 1,498 DEGs were screened from the GSE66957 dataset, including 709 upregulated genes and 789 downregulated genes. The differential expression of multiple genes from the two sets of sample data included in each of the three microarrays is shown in Figure 2. The cluster heatmaps of the top 200 DEGs are shown in Figure 3.
Figure 1 Standardization of gene expression.
Notes: (A) The standardization of GDS3592 data, (B) the standardization of GSE54388 data, and (C) the standardization of GSE66957 data. The blue bar represents the data before normalization, and the red bar represents the normalized data.
([SUHVVLRQYDOXH
%HIRUHQRUPDOL]DWLRQ
6DPSOHOLVW
$
([SUHVVLRQYDOXH
1RUPDOL]DWLRQ
6DPSOHOLVW
± ±
±
([SUHVVLRQYDOXH
%HIRUHQRUPDOL]DWLRQ
6DPSOHOLVW
%
± ±
([SUHVVLRQYDOXH
1RUPDOL]DWLRQ
6DPSOHOLVW
([SUHVVLRQYDOXH
%HIRUHQRUPDOL]DWLRQ
6DPSOHOLVW
&
([SUHVVLRQYDOXH
1RUPDOL]DWLRQ
6DPSOHOLVW
OncoTargets and Therapy downloaded from https://www.dovepress.com/ by 118.70.13.36 on 25-Aug-2020
Dovepress Degs and signaling pathways in ovarian cancer
Identification of DEGs in ovarian cancer
using integrated bioinformatics
The three ovarian cancer gene expression microarray datasets were analyzed by the limma package and sorted according to logfold-change value and then analyzed by RRA (corrected P-value ,0.05). The RRA method is based on the hypothesis that each gene is randomly ordered in each experiment. If a gene ranked high in all experiments, then the smaller its P-value is, the greater the likelihood of differential gene expression. Through rank analysis, we identified 190 DEGs, with 99 upregulated genes and 91 downregulated genes; the DEGs are shown in Table 2. R-heatmap software was used to draw a heatmap of the top 20 up- and downregulated genes, as shown in Figure 4.
GO term enrichment analysis of DEGs
Biological annotation of the DEGs in ovarian cancer identified from an integrated analysis of microarray data was performed using the DAVID online analysis tool, and GO functional enrichments of up- and downregulated genes with a P-value of ,0.05 were obtained. GO analysis of DEGs was divided into three functional groups, including molecular function, bio-logical processes, and cell composition. The results are shown in Figures 5 and 6. Significant results of the GO enrichment analysis of DEGs in ovarian cancer are shown in Tables 3 and 4. In the biological process group, the upregulated genes were mainly enriched in cell proliferation, regulation of transcrip-tion, proteolysis, and epithelial cell differentiation. The down-regulated genes were mainly concentrated in ethanol oxidation,Figure 2 Differential expression of data between two sets of samples.
Notes: (A) GDS3592 data, (B) GSE54388 data, and (C) GSE66957 data. The red points represent upregulated genes screened on the basis of |fold change| .2.0 and a corrected P-value of ,0.05. The green points represent downregulation of the expression of genes screened on the basis of |fold change| .2.0 and a corrected P-value of ,0.05. The black points represent genes with no significant difference. FC is the fold change.
9ROFDQR
/RJ)&
±
±
±
±/RJ3YDOXH
$
9ROFDQR
/RJ)&
±
±
±
±/RJ3YDOXH
%
9ROFDQR
/RJ)&
±
±
±
±/RJ3YDOXH
&
OncoTargets and Therapy downloaded from https://www.dovepress.com/ by 118.70.13.36 on 25-Aug-2020
Dovepress Yang et al
7\SH 08& 62; =:,17 6321 &.6 550 9(*)$ 186$3 ./. 25& 6$ %2/$% %( 6$ '7/ /2& .,)$ &'&$ &(13) (63/ %8%% 1&$3* 6/&$$ /2& 6/&$ /2& ')1$ &3( 8%/ &/,3 $5+*$3 0(77/$ 7;1,3 /,3$ 8*3 ,7/1 +%% 1(// /2& ()(03 /2& *35$63 6(0$& &$9 &&'&$ &&1'%3 '3<' &(/) 330. 0786 303 &RUI $: $43 3'*)' 080/ )*) 1%($ *+5 (0% )5< 0$*$6 &)$3 3/&/ $%&$ 5((3 5*6 5(5* $2; &6*$/1$&7 $/'+$ 70(0$ &RUI :17% $5)*() 6<1( '/* 3'=' (3% %03 3(;/ 702' *$'/ 35* 3'(% $'+& 51$6( $1.5' 6/&$ +/)$ 003 3'(% 3/(.++ $$ 67. %1& /*$/6 $'+% $, 2*1 *60 *60 *60 *60 *60 *60 *60 *60 *60 *60 *60 *60 *60 *60 *60 *60 *60 *60 *60 *60 *60 *60 *60 *60 7\SH 1RU 7XP
$
*60 *60 *60 *60 *60 *60 *60 *60 *60 *60 *60 *60 *60 *60 *60 *60 *60 *60 *60 *60 *60 *60
7\SH &' &(3 0(/. 18) 75,3 )$0' .,) %8%% '/*$3 &(13. =:,17 &&1% )2;0 (/) &.6 .,)$ (3&$0 &5$%3 0&0 &+03& &RUI (653 ,7/1 7&($/ 080/ /2& /2& 3566 /2& +/) 3&'+ $%&$% 763$1 $'+& &/'1 &RUI %&2 '$3.,7 1'1) /+; 3'(% $5; 7&) 0,5& 1371,7 0,5 *1* 3/33 $73' 571 3$366 $5+*$3 /*$/6 67$5 *)37 $1.5' 7+%' /2& &15,3 5((3 0*& /2& +$1'$6 /2& :17% /551 $'+% $2; 7&($/ &+*% *35$63 $1;$/ /,1& &$/% 6<7 +6'% &&'& *30$ .'5 01'$ %1& 352&5 ')1$ 6)53 2/)0/ 13<5 35* 2*1 6+/6$ +%$ +%% *$'/ $$'$&/ 0*$53 ',5$6 &/(&0 632&. $/'+$ ,*)%3 1(// ± ± 7\SH 1RU 7XP
%
Figure 3 (Continued)
OncoTargets and Therapy downloaded from https://www.dovepress.com/ by 118.70.13.36 on 25-Aug-2020
Dovepress Degs and signaling pathways in ovarian cancer
Figure 3 Hierarchical clustering heatmap of DEGs screened on the basis of |fold change| .2.0 and a corrected P-value ,0.05.
Notes: (A) GDS3592 data, (B) GSE54388 data, and (C) GSE66957 data. Red indicates that the expression of genes is relatively upregulated, green indicates that the expression of genes is relatively downregulated, and black indicates no significant changes in gene expression; gray indicates that the signal strength of genes was not high enough to be detected.
Abbreviation: DEGs, differentially expressed genes.
7\SH 7\SH 1RU 7XP 96; 6125' /2& /2& /2& '()%% /2& /2& &RUI 6125$ /2& /2& /2& '()%$ &RUI /2& 581'&& )/-/,1& &RUI 05*35; )'36/$ )/-,4&) /2& 7%; /2& .57 /2& /,1& /,1& /2& .57$3 &RUI /2& /2& &RUI$6 /2& /2& /2& /2& /2& /2& .,$$ +*6 0),$6 /2& *$%3$ $36 )87 .57$3 .57$3 *3 &RUI /2& $',* /&($ $$7.$6 *1* 736* /2& &RUI '8; 53/$3 $6% 6125$ 536$3 /2& 3$%31/ .57$3 $'$' /2& /2& /2& *15+ /2& /2& /2& /2& /2& 6/&* *2/*$/ :)'& 7$&67' 37*6 &3 33/ /65 70& /2& +2;% 3335$ 703566 5$3*$3 5(71 $;,1 .57$3 '103 43&7/ &RUI *60 *60 *60 *60 *60 *60 *60 *60 *60 *60 *60 *60 *60 *60 *60 *60 *60 *60 *60 *60 *60 *60 *60 *60 *60 *60 *60 *60 *60 *60 *60 *60 *60 *60 *60 *60 *60 *60 *60 *60 *60 *60 *60 *60 *60 *60 *60 *60 *60 *60 *60 *60 *60 *60 *60 *60 *60 *60 *60 *60 *60 *60 *60 *60 *60 *60 *60 *60 *60
&
mesenchymal–epithelial cell signaling, and the Wnt signaling pathway. In the molecular function group, the upregulated genes were mainly enriched in DNA binding, transcriptional activator activity, and endopeptidase activity. The downregulated genes were mainly enriched in binding, including oxygen binding, iron ion binding, and calcium ion binding, as well as peptidase activator activity and growth factor activity. In the cell composition group, the upregulated genes were mainly enriched in plasma membranes, extracellular space, extracellular exosomes,
and vesicles. The downregulated genes were mainly enriched in the extracellular matrix, extracellular exosomes, and the hemoglobin complex. These results indicate that most DEGs are significantly enriched in cell proliferation, binding, cell cycle regulation, and transcriptional activity.
KEGG pathway analysis of DEGs
Using the KOBAS online analysis database (http://kobas. cbi.pku.edu.cn/) to analyze the DEGs identified from ovarian
OncoTargets and Therapy downloaded from https://www.dovepress.com/ by 118.70.13.36 on 25-Aug-2020
Dovepress Yang et al
Table 2 screening Degs in ovarian cancer by integrated microarray
DEGs Gene names
Upregulated CP CD24 KLK7 ST6GALNAC1 MMP7 EPCAM SCGB2A1 PTH2R PRAME SPON1 MEOX1 ESRP1 MPZL2 TMPRSS4 SOX17 TNNT1 ELF3 SCGB1D2 SST LCN2 RGS1 LYPD1 KLK6 ESM1 CDH6 BCL11A FOXQ1 MUC16 UCP2 TMTC1 DCDC2 LGR6 TLCD1 KLK8 MAL SLC4A11 EHF WFDC2 ST6GALNAC2 FZD10 TSPAN12 SLC39A4 KRT23 CXXC5 DEFB1 C12orf56 LOC100129098 NPTX2 TMC4 CLDN3 LAMP3 EPHX4 TPX2 PSAT1 ZWINT MELK SLC2A1 LPAR3 DAPL1 SCRIB C2orf88 RASSF10 VTCN1 MUC1 FJX1 C1orf106 METTL7B LOC101928554 TMEM139 CKS2 SPP1 HOXB2 MAL2 MECOM TMEM125 CTCFL E2F8 IFI27 TTK CLDN7 ASS1 GLDC TMPRSS3 PTX3 FOXM1 EYA2 SULT1C2 RAD51AP1 GGT6 CEP55 NUF2 TACSTD2 LOC100509445 ZIC1 PPL MXRA5 ERP27 ZBED2 ATP6V1B1
Downregulated ITLN1 GADL1 PRG4 BCHE SYT4 OGN REEP1 GIPC2 MGARP HOXA5 HBB CHRDL1 SPOCK1 FABP4 MUM1L1 BNC1 VGLL3 SERTM1 TCEAL2 ANXA8L1 TCEAL7 LOC101930363 TMEM255A STK31 LINC01105 NELL2 AADACL2 EFEMP1 LOC100996760 AOX1 RNASE4 MGC24103 HSD17B2 ARHGAP18 LOC100506718 LRRN4 HAND2-AS1 FGF13 ADH1B SFRP1 NPY1R ADGRD1 LHX2 HBA2 RNF128 ADH1C CALB2 LGALS2 CRNDE NDNF CAV1 MNDA KCNT2 WNT2B GFPT2 GHR CSGALNACT1 OMD C21orf62 DFNA5 PCDH17 CHGB LOC101928635 ABCA8 ARX PCDH9 PRSS35 PEX5L PDE8B FGF9 NEFH PDGFD PEG3 CLEC4M PROCR NAP1L3 SGCG TSPAN8 HBG2 MEIS2 PDZD3 EPB42 CELF2 PCOLCE2 BAMBI ALDH1A1 SHISA3 PDE7B DIRAS3 HAS1 HSPB3 Abbreviation: DEGs, differentially expressed genes.
cancer-integrated gene microarrays, the most significantly enriched pathways of the DEGs were submitted to KEGG analysis. The results are shown in Table 5. The signaling pathways of DEGs were mainly enriched in the Wnt signal-ing pathways, metabolic pathways, and pathways in cancer. The data were imported into Cytoscape to calculate the topological characteristics of the network and determine each node. The genes and pathway nodes are represented by semiellipses. The results are shown in Figure 7.
analyzing Degs in ovarian cancer using a
PPI network
The DEG expression products in ovarian cancer were con-structed using the STRING database (http://string-db.org) to construct PPI networks, with a total of 190 DEGs, includ-ing 99 upregulated genes and 91 downregulated genes. After removing the isolated and partially connected nodes, a complex network of DEGs was constructed, as shown in Figure 8. The 17 most significant genes showing significant interaction were HBB, ZWINT, WNT2B, SPP1, HBA2, NUF2,
ALDH1A1, FZD10, MMP7, MUC16, MUC1, OMD, OGN, AOX1, ADH1B, HBG2, and TTK.
Discussion
Ovarian cancer is one of the most common tumors in the female reproductive system. The incidence of ovarian can-cer is the second highest among gynecologic malignancies, but the mortality rate is the highest among gynecologic tumors.15 The early onset of ovarian cancer is difficult to
identify, and tumors are often found in the late stages of the disease. Its occurrence and development are complex
biological processes that can occur at any age, and the disease has a poor prognosis. Therefore, it is important to study the molecular mechanisms of the carcinogenesis and development of ovarian cancer.
Microarray and high-throughput sequencing technologies that detect the expression levels of tens of millions of genes in humans have been widely used to predict potential tar-gets for ovarian cancer treatment. In recent decades, there have been many basic research reports on the mechanisms underlying the occurrence of ovarian cancer, but the 5-year survival rate of ovarian cancer is still relatively low, and there are no clear and effective treatment measures because most studies focus on a single genetic event or the results are generated from a single-cohort study.16 This study integrated
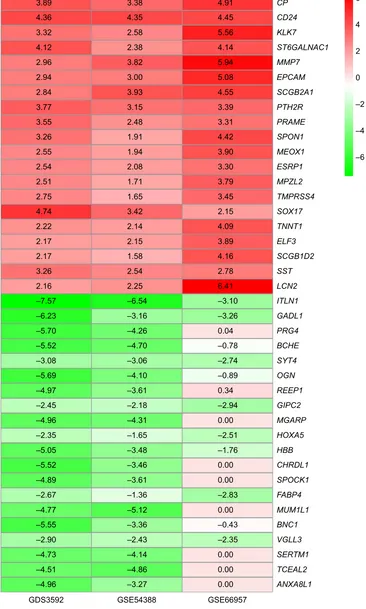
three gene expression profile datasets from different groups and used R software and bioinformatics to deeply analyze these datasets. The results identified 255 DEGs using the RRA analysis method, including 96 upregulated genes and 159 downregulated genes. The top 20 most significantly upregulated genes were CP, CD24, KLK7, ST6GALNAC1,
MMP7, EPCAM, SCGB2A1, PTH2R, PRAME, SPON1, MEOX1, ESRP1, MPZL2, TMPRSS4, SOX17, TNNT1, ELF3, SCGB1D2, SST, and LCN2. The top 20 most significantly
downregulated genes were ITLN1, GADL1, PRG4, BCHE,
SYT4, OGN, REEP1, GIPC2, MGARP, HOXA5, HBB, CHRDL1, SPOCK1, FABP4, MUM1L1, BNC1, VGLL3, SERTM1, TCEAL2, and ANXABL1. In addition, 255 DEGs
were divided into groups by GO functional annotation, including molecular function, biological process, and cel-lular component groups. DEG enrichment was determined by KEGG signal pathway analysis to construct a PPI of
OncoTargets and Therapy downloaded from https://www.dovepress.com/ by 118.70.13.36 on 25-Aug-2020
Dovepress Degs and signaling pathways in ovarian cancer
Figure 4 LogFC heatmap of the image data of each expression microarray.
Notes: The abscissa is the geO iD, and the ordinate is the gene name. red represents logFc .0, green represents logFc ,0, and the values in the box represent the logFc values.
Abbreviations: FC, fold change; GEO, Gene Expression Omnibus.
*'6 *6( *6(
$1;$/ 7&($/ 6(570 9*// %1& 080/ 632&. &+5'/ 0*$53 )$%3 +%% +2;$ *,3& 6<7 %&+( *$'/ ,7/1 /&1 667 6&*%' (/) 7117 62; 703566 03=/ (653 0(2; 35$0( 6321 37+5 6&*%$ (3&$0 003 67*$/1$& ./. &' &3 35* 2*1 5((3 ± ± ± ± ± ± ± ± ± ± ± ± ± ± ± ± ± ± ± ± ± ± ± ± ± ± ± ± ± ± ± ± ± ± ± ± ± ± ± ± ± ± ± ± ± ± ± ± ± ± ± ± ± ±
OncoTargets and Therapy downloaded from https://www.dovepress.com/ by 118.70.13.36 on 25-Aug-2020
Dovepress Yang et al
Figure 5 GO enrichment analysis of DEGs in ovarian cancer.
Notes: (A) GO analysis divided DEGs into three functional groups: molecular function, biological processes, and cell composition. (B) GO enrichment significance items of DEGs in different functional groups.
Abbreviations: DEGs, differentially expressed genes; GO, gene ontology.
*2±UHJXODWLRQRIFDUGLDFPXVFOHFHOODFWLRQSRWHQWLDOLQYROYHGLQUHJXODWLRQRIFRQWUDFWLRQ *2±SRVLWLYHUHJXODWLRQRIFDQRQLFDO:QWVLJQDOLQJSDWKZD\ *2±EORRGPLFURSDUWLFOH *2±FHOOXODUUHVSRQVHWRWUDQVIRUPLQJJURZWKIDFWRUEHWDVWLPXOXV *2±FHOOXODUUHVSRQVHWRWXPRUQHFURVLVIDFWRU *2±H[WUDFHOOXODUH[RVRPH *2±PHVHQFK\PDO±HSLWKHOLDOFHOOVLJQDOLQJ *2±OXQJDVVRFLDWHGPHVHQFK\PHGHYHORSPHQW *2±FDQRQLFDO:QWVLJQDOLQJSDWKZD\ *2±PDPPDU\JODQGLQYROXWLRQ *2±QHJDWLYHUHJXODWLRQRIV\QDSWLFWUDQVPLVVLRQ *2±SRVLWLYHUHJXODWLRQRIFROODWHUDOVSURXWLQJ *2±QHJDWLYHUHJXODWLRQRIFROODWHUDOVSURXWLQJ *2±YLULRQELQGLQJ *2±SRVLWLYHUHJXODWLRQRIWUDQVFULSWLRQ'1$WHPSODWHG *2±SRVLWLYHUHJXODWLRQRIVPRRWKHQHGVLJQDOLQJSDWKZD\ *2±SRVLWLYHUHJXODWLRQRIQLWULFR[LGHELRV\QWKHWLFSURFHVV *2±VHTXHQFHVSHFLILF'1$ELQGLQJ *2±[HQRELRWLFWUDQVSRUW *2±P\HOLQDWLRQ *2±KDSWRJORELQELQGLQJ *2±LQQHUHDUPRUSKRJHQHVLV *2±:QWDFWLYDWHGUHFHSWRUDFWLYLW\ *2±QHJDWLYHUHJXODWLRQRISURWHLQKRPRROLJRPHUL]DWLRQ *2±KDSWRJORELQ±KHPRJORELQFRPSOH[ *2±QHJDWLYHUHJXODWLRQRI%03VLJQDOLQJSDWKZD\ *2±VWUXFWXUDOFRQVWLWXHQWRIP\HOLQVKHDWK *2±R[\JHQELQGLQJ *2±SHSWLGDVHDFWLYDWRUDFWLYLW\ *2±ODWHUDOSODVPDPHPEUDQH *2±DSLFDOSODVPDPHPEUDQH *2±EDVRODWHUDOSODVPDPHPEUDQH *2±SURWRQWUDQVSRUW *2±ELFDUERQDWHWUDQVSRUW *2±R[\JHQWUDQVSRUW *2±SRVLWLYHUHJXODWLRQRIFHOOGHDWK *2±UHVSRQVHWRP\FRWR[LQ *2±FHOOXODUUHVSRQHVWRVWDUYDWLRQ *2±SRVLWLYHUHJXODWLRQRIFHOOSUROLIHUDWLRQ *2±FHOOSUROLIHUDWLRQ *2±KHSDULQELQGLQJ *2±JURZWKIDFWRUDFWLYLW\ *2±EORRGFRDJXODWLRQ *2±FHOODGKHVLRQ *2±KHPRJORELQFRPSOH[ *2±*ROJLOXPHQ *2±H[WUDFHOOXODUVSDFH *2±SURWHLQDFHRXVH[WUDFHOOXODUPDWUL[ *2±H[WUDFHOOXODUUHJLRQ *2±LURQLRQELQGLQJ *2±R[\JHQWUDQVSRUWHUDFWLYLW\ *2±IUL]]OHGELQGLQJ *2±VFDYHQJHUUHFHSWRUDFWLYLW\ *2±VHULQHW\SHHQGRSHSWLGDVHDFWLYLW\ *2±DOFRKROGHK\GURJHQDVHDFWLYLW\]LQFGHSHQGHQW *2±FHOODFWLYDWLRQ *2±PHPEUDQHUDIWSRODUL]DWLRQ *2±QHXURQPLJUDWLRQ *2±H\HGHYHORSPHQW *2±DQJLRJHQHVLV *2±51$SRO\PHUDVH,,FRUHSURPRWHUSUR[LPDOUHJLRQVHTXHQFHVSHFLILF'1$ELQGLQJ*2±51$SRO\WPHUDVH,,WUDQVFULSWLRQIDFWRUDFWLYLW\VHTXHQFHVSHFLILF'1$ELQGLQJ *2±WUDQVFULSWLRQDODFWLYDWRUDFWLYLW\51$SRO\PHUDVH,,FRUHSURPRWHUSUR[LPDOUHJLRQVHTXHQFHVSHFLILFELQGLQJ *2±UHVSRQVHWRK\SR[LD *2±DOSKD1DFHW\OJDODFWRVDPLQLGHDOSKDVLDO\OWUDQVIHUDVHDFWLYLW\ *2±HWKDQROR[LGDWLRQ *2±LQWHJUDOFRPSRQHQWRISODVPDPHPEUDQH *2±PXOWLFHOOXODURUJDQLVPGHYHORSPHQW *2±FHOOVXUIDFHUHFHSWRUVLJQDOLQJSDWKZD\
±/RJ3YDOXH
%
$
7DUJHWJHQHV
%LRORJLFDOSURFHVV &HOOXODUFRPSRQHQW 0ROHFXODUIXQFWLRQ
*2 *2 *2 *2 *2 *2 *2 *2 *2 *2 *2 *2 *2 *2 *2 *2 *2 *2 *2 *2 *2 *2 *2 *2 *2 *2 *2 *2 *2 *2 *2 *2 *2 *2 *2 *2 *2 *2 *2 *2 *2 *2 *2 *2 *2 *2 *2 *2 *2 *2 *2 *2 *2 *2 *2 *2 *2 *2 *2 *2 *2 *2 *2 *2 *2 *2 *2 *2 *2
OncoTargets and Therapy downloaded from https://www.dovepress.com/ by 118.70.13.36 on 25-Aug-2020
Dovepress Degs and signaling pathways in ovarian cancer
3URWHLQDFHRXVH[WUDFHOOXODUPDWUL[
51$SRO\PHUDVH,,FRUHSURPRWHUSUR[LPDOUHJLRQ VHTXHQFHVSHFLILF'1$ELQGLQJ
([WUDFHOOXODUUHJLRQ
2[\JHQWUDQVSRUWHUDFWLYLW\ /DWHUDOSODVPDPHPEUDQH (WKDQROR[LGDWLRQ
([WUDFHOOXODUVSDFH +HPRJORELQFRPSOH[
([WUDFHOOXODUH[RVRPH 3RVLWLYHUHJXODWLRQRIFDQRQLFDO :QWVLJQDOLQJSDWKZD\
Figure 6 Distribution of DEGs in ovarian cancer for different GO-enriched functions. Abbreviations: DEGs, differentially expressed genes; GO, gene ontology.
DEG-encoding proteins and to screen the 17 most closely related genes. The DEGs in ovarian cancer were analyzed by GO functional annotation and showed that the upregu-lated DEGs were mainly involved in the regulation of cell proliferation and gene differentiation in ovarian cancer, transcription, different membranes, membrane raft polariza-tion, proteolysis, and extracellular exosomes, and that the downregulated genes were mainly involved in the positive regulation of the canonical Wnt signaling pathway, oxygen transport, and mesenchymal–epithelial cell signaling, and in the negative regulation of the bone morphogenetic protein signaling pathway, and the cellular response to starvation and transforming growth factor β (TGF-β) stimulus. This finding is consistent with the knowledge that cell proliferation and
differentiation, mesenchymal–epithelial cell signaling, and the cellular response to starvation and TGF-β play important roles in the tumor development and progression and that ion transport can contribute to cancer-related processes that differ substantially from processed in normal cells.17
The TGF-β signaling pathway is an important intracel-lular signal transduction pathway involved in the embryonic development, tumorigenesis, wound healing, inflamma-tory response, and physiological and pathophysiological processes.18 TGF-β can improve the adhesion and motility
of tumor cells by promoting the epithelial-to-mesenchymal transition (EMT) and can inhibit the expression of E-cadherin, damaging the connection between the epithelium and weak-ening the adhesion of cancer cells. Through the expression of
OncoTargets and Therapy downloaded from https://www.dovepress.com/ by 118.70.13.36 on 25-Aug-2020
Dovepress Yang et al
Table 3 GO analysis of upregulated genes associated with ovarian cancer
Term Description Count P-value
Upregulated
gO:0016328 lateral plasma membrane 5 1.47e–04
gO:0005615 extracellular space 18 3.70e–04
GO:0000978 rna polymerase ii core promoter proximal region sequence-specific DNA binding
8 0.001939897
gO:0016323 Basolateral plasma membrane 6 0.002186397
gO:0016324 apical plasma membrane 7 0.003563039
gO:0043565 Sequence-specific DNA binding 9 0.004212667
gO:0004252 serine-type endopeptidase activity 6 0.008867111
gO:0008283 Cell proliferation 7 0.010058246
gO:0070062 extracellular exosome 24 0.011258185
GO:0045893 Positive regulation of transcription, DNA-templated 8 0.014565685
gO:0010046 response to mycotoxin 2 0.014933085
gO:0042552 Myelination 3 0.022197031
GO:0015992 Proton transport 3 0.024979514
GO:0031982 Vesicle 4 0.0270288
gO:0001665 alpha-N-acetylgalactosaminide alpha-2,6-sialyltransferase activity 2 0.02949141
gO:0032463 Negative regulation of protein homooligomerization 2 0.029645788
gO:0001077 Transcriptional activator activity, rna polymerase ii core promoter proximal region sequence-specific binding
5 0.030142085
gO:0016266 O-glycan processing 3 0.036297156
gO:0006508 Proteolysis 7 0.039180152
gO:0048672 Positive regulation of collateral sprouting 2 0.039333412
gO:0001766 Membrane raft polarization 2 0.039333412
gO:0030855 Epithelial cell differentiation 3 0.047971693
GO:0019911 Structural constituent of myelin sheaths 2 0.0486732
Abbreviation: gO, gene ontology.
Table 4 GO analysis of downregulated genes associated with ovarian cancer
Term Description Count P-value
Downregulated
gO:0005576 extracellular region 23 1.01e–06
gO:0005578 Proteinaceous extracellular matrix 7 0.001157176
gO:0005833 hemoglobin complex 3 0.001220686
GO:0006069 ethanol oxidation 3 0.001228863
gO:0005344 Oxygen transporter activity 3 0.001536131
gO:0015671 Oxygen transport 3 0.001938348
GO:0090263 Positive regulation of the canonical Wnt signaling pathway 5 0.001941189
gO:0008201 heparin binding 5 0.00461454
gO:0008083 Growth factor activity 5 0.004821586
gO:0001654 eye development 3 0.00769484
GO:0007596 Blood coagulation 5 0.008846893
GO:0016491 Oxidoreductase activity 5 0.010016724
GO:0005109 Frizzled binding 3 0.01001912
gO:0031720 haptoglobin binding 2 0.012565482
gO:0060638 Mesenchymal–epithelial cell signaling 2 0.013163186
GO:0019825 Oxygen binding 3 0.016689042
gO:0030514 Negative regulation of the BMP signaling pathway 3 0.016784306
gO:0070062 extracellular exosome 21 0.017300221
gO:0031838 haptoglobin–hemoglobin complex 2 0.017445404
GO:0009267 cellular response to starvation 3 0.01822392
gO:0071560 Cellular response to transforming growth factor β stimulus 3 0.019713919
gO:0004024 alcohol dehydrogenase activity, zinc-dependent activity 2 0.02497527
gO:0005506 iron ion binding 4 0.026650964
gO:0072562 Blood microparticle 4 0.029308832
gO:0050805 Negative regulation of synaptic transmission 2 0.030448545
GO:0005509 calcium ion binding 8 0.030726722
GO:0098909 Regulation of cardiac muscle cell action potentials involved in regulation of contraction
2 0.034723005
gO:0016504 Peptidase activator activity 2 0.041282745
gO:0060484 lung-associated mesenchyme development 2 0.04321623
gO:0030246 carbohydrate binding 4 0.049593778
OncoTargets and Therapy downloaded from https://www.dovepress.com/ by 118.70.13.36 on 25-Aug-2020
Dovepress Degs and signaling pathways in ovarian cancer
Table 5 KEGG pathway analysis of DEGs associated with ovarian cancer
Pathway ID Database Gene count P-value Corrected P-value Genes Wnt signaling
pathway
hsa04310 Kegg pathway
6 7.43e–05 0.00765726 SFRP1 MMP7 SOX17 FZD10 WNT2B BAMBI
retinol metabolism
hsa00830 Kegg pathway
4 0.000310631 0.015310434 ALDH1A1 AOX1 ADH1C ADH1B
Vitamin B6 metabolism
hsa00750 Kegg pathway
2 0.000592789 0.015310434 PSAT1 AOX1
Pathways in cancer
hsa05200 Kegg pathway
8 0.000664116 0.015310434 CKS2 WNT2B MECOM SLC2A1 FGF9 FZD10
FGF13 LPAR3
Tyrosine metabolism
hsa00350 Kegg pathway
3 0.000743225 0.015310434 AOX1 ADH1C ADH1B
Taurine and hypotaurine metabolism
hsa00430 Kegg pathway
2 0.001626212 0.027916645 GADL1 GGT6
Metabolic pathways
hsa01100 Kegg pathway
14 0.002393892 0.035224406 ALDH1A1 PSAT1 GLDC GADL1 AOX1 ASS1
ATP6V1B1 CSGALNACT1 ADH1B ADH1C GFPT2 HSD17B2 GGT6 ST6GALNAC1
Abbreviations: DEGs, differentially expressed genes; KEGG, Kyoto Encyclopedia of Genes and Genomes.
Figure 7 Significant pathway enrichment of DEGs.
Note: red represents the signaling pathway, green represents downregulated genes, blue represents signaling pathway, and red represents upregulated genes.
+6'%
67*$/1$&
*)37
&6*$/1$&7
$739%
**7 *$'/
KVD
$/'+$ $'+%
KVD KVD
KVD 62;
6)53 KVD
003
)=' %$0%,
:17%
/3$5
6/&$
KVD
)*)
&.6
0(&20 )*)
36$7 $66 */'&
KVD
$'+& $2;
N-cadherin, interstitial characteristics can develop, and the invasion and metastasis of tumor cells from the primary site is facilitated.19 Therefore, the abnormal expression of TGF-β
is closely related to tumorigenesis and cancer progression. Furthermore, the enriched KEGG pathways of DEGs included the Wnt signaling pathway, metabolic pathways, and pathways in cancer. Recent study has shown that the Wnt/β-catenin signaling pathway can promote ovarian cancer resistance by promoting the EMT in ovarian cancer.20 Bodnar
et al21 found that the activation of the Wnt/β-catenin signaling
pathway could promote the proliferation and differentiation of ovarian cancer cells, inhibit apoptosis, and promote the
growth of ovarian cancer. Multiple levels of negative modu-lators are involved in the Wnt/β-catenin signaling pathway. The DEGs that are closely associated with the Wnt/β-catenin signaling pathway in ovarian cancer were determined using the Cytoscape method, with SFRP1, MMP7, SOX17, FZD10, WNT2B, BAMBI, SOX17, FZD10, and MMP7 expressions upregulated and SFRP1, BAMBI, and WNT2B downregulated. Matrix metalloproteinases (MMPs) are closely related to tumor invasion and metastasis. The overex-pression of MMPs can significantly promote the invasion and metastasis of tumor cells.22 MMP7 is an important member
of the MMP family that can degrade the extracellular matrix,
OncoTargets and Therapy downloaded from https://www.dovepress.com/ by 118.70.13.36 on 25-Aug-2020
Dovepress Yang et al
Figure 8 PPI network.
Notes: Circles represent genes, lines represent the interaction of proteins between genes, and the results within the circle represent the structure of proteins. Line color represents evidence of the interaction between the proteins.
Abbreviation: PPI, protein–protein interaction.
including the basement membrane, and inhibit the defense against tumor invasion and metastasis, thus increasing the invasive capacity of the tumor.23 The FZD10 gene is a
mem-ber of the Frizzled gene family, which encodes the receptor protein of the Wnt pathway and plays an important role in the pathway. A study has found that BRMS1L mediates FZD10 silencing by promoting the recruitment of HDAC1 in the FZD10 promoter region and the acetylation of his-tone H3K9, thereby inhibiting the migration, invasion, and
adhesion of breast cancer cell lines.24 Another study found that
silencing the expression of FZD10 in ovarian cancer cells could significantly increase the sensitivity to chemotherapy drugs, but the specific mechanism was not clear.25 Our study
suggests that FZD10 is closely related to Wnt and tumor-related pathways, which can provide a theoretical basis for further studies. SFRP1 is a Wnt antagonist that competes with the Frizzled protein receptor for Wnt ligands and can block Wnt signal transduction.26 Therefore, when SFRP1 is
OncoTargets and Therapy downloaded from https://www.dovepress.com/ by 118.70.13.36 on 25-Aug-2020
Dovepress Degs and signaling pathways in ovarian cancer
downregulated, it can promote the activation of the Wnt signaling pathway and the proliferation of tumor cells and accelerate the occurrence and development of tumors. The downregulation of BAMBI can promote tumor invasion and metastasis. Overexpression of BAMBI can reduce the TGF-β-induced EMT, and the invasion and migration of tumor cells and can slow tumor growth.27 A large number of
studies have reported that WNT2B is upregulated in a variety of tumor tissues and is capable of activating the β -catenin-dependent Wnt signaling pathway.28,29 However, in our study,
we found that the expression of WNT2B was downregulated in ovarian cancer, suggesting that it requires further detec-tion in tissue samples to identify its expression patterns and explore the molecular mechanism underlying its role in ovarian cancer. Detecting these pathways and the expression of related molecules can help predict the occurrence and development of tumors.
We constructed a PPI network of protein encoded by DEGs and identified the following 17 closely related genes: HBB, ZWINT, WNT2B, SPP1, HBA2, NUF2, ALDH1A1, FZD10, MMP7, MUC16, MUC1, OMD, OGN, AOX1, ADH1B, HBG2, and TTK. The proteins encoded by these genes are key nodes in the PPI network. Pathway enrichment analysis revealed that the genes were mainly involved in the Wnt signaling pathway, retinol metabolism, pathways in cancer, and metabolic pathways. Endo et al found that ZWINT was overexpressed in breast cancer cell lines and could promote tumor cell growth, and that the degradation of ZWINT negatively regulated cell proliferation. Increasing evidence shows that SPP1 is closely related to the tumori-genesis and metastasis of tumors.30 A high expression of
SPP1 was detected in tumor tissues, such as colon cancer, gastric cancer, prostate cancer, and breast cancer.31–33 NUF2
is expressed in a variety of malignancies and plays an impor-tant role in tumorigenesis and progression.34 NUF2 is highly
expressed in epithelial ovarian cancer and is involved in many characteristics, such as the metastasis, invasion, division, and proliferation of cancer cells.35 However, the specific
molecu-lar mechanisms underlying the abnormal expression of NUF2 in tumorigenesis and progression remain to be studied.
In recent years, acetaldehyde dehydrogenases (ALDHs) have been found to play an important role in tumor cell metabolism and tumorigenesis. Among them, ALDH1 is closely related to tumor cell stemness. Among the numerous ALDH1 families, aldehyde dehydrogenase 1A1 (ALDH1A1) is one of the important members of the superfamily. The physiological function of ALDH1A1 is to participate in the metabolism of retinoic acid and promote the activation
of the metabolic pathway of retinoic acid. In recent years, the role and function of this molecule in malignant tumors have attracted research attention. Studies have reported that ALDH1A1 is highly expressed in ovarian cancer cells and is involved in the resistance to chemoradiotherapy in ovarian cancer, resulting in recurrence and metastasis.36
Another study reported that ALDH1A1 is the target mol-ecule of β-catenin and β-catenin knockdown can disrupt ovarian cancer spheroid formation, cell viability, and tumor growth and metastasis.37 Therefore, developing more specific
ALDH1A1 inhibitors could increase chemotherapy effective-ness in ovarian cancer.
MUC16 is an important tumor marker for the early diag-nosis of epithelial ovarian cancer. It is widely used in clinical practice. A study found that 80% of patients with ovarian cancer had elevated serum MUC16 levels.38 In addition,
The Cancer Genome Atlas (TCGA) effort aimed at ovarian cancer found that both the amplification of the gene encoding MUC16 and the expression of MUC16 mRNA are closely related to the poor prognosis of patients with ovarian cancer,39
suggesting that the abnormal increase of tumor marker MUC16 in ovarian cancer plays an important role in the development and progression of ovarian cancer.
The Wnt signaling pathway is an important signaling path-way in biological development and tumorigenesis. β-Catenin is the major effector of the Wnt signaling pathway. After silencing MUC1, the levels of E-cadherin and E-cadherin/ β-catenin complexes were elevated, and the expression levels of nuclear β-catenin, cyclin D1 (cyclinD1), and c-myc were decreased.40 In renal cell carcinoma, MUC1-C and β-catenin
interact with the promoter region of SNAIL and increase SNAIL transcription, thereby facilitating the EMT of tumor cells.41 In recent years, MUC1-N monoclonal antibodies,
MUC1-C peptides, and MUC1 vaccines have been extensively studied in preclinical, experimental, and clinical trials.
Osteomodulin (OMD) plays an important role in the extracellular matrix in tooth and cartilage tissue and is report-edly involved in bone mineralization.42 Osteoglycin (OGN)
is a member of proteoglycans (PGs) called small leucine-rich PGs (SLRPs), which are a group of extracellular matrix molecules related in structure and function that are involved in matrix assembly, the regulation of cellular growth, and migration.43 OGN, also known as osteoinductive factor, plays
an important role in maintaining normal bone tissue.44 As an
extracellular matrix molecule, OGN is involved in the forma-tion and regulaforma-tion of extracellular matrix and has a potential impact on tumor cell metastasis. In vivo experiments have shown that OGN is involved in the regulation of collagen
OncoTargets and Therapy downloaded from https://www.dovepress.com/ by 118.70.13.36 on 25-Aug-2020
Dovepress Yang et al
fiber formation associated with tumor metastasis, suggesting that OGN may inhibit tumor metastasis by a number of mech-anisms.45 MMPs are important regulators of extracellular
matrix metabolism and are closely related to tumor metasta-sis.46 Future studies should focus on the relationship between
OGN expression and MMPs secreted by tumor cells. Many studies have shown that the protein expression of the ADH1B gene is downregulated in many tumors.47,48
Compared with levels in normal tissues, the mRNA levels of ADH1B in colorectal cancer tissues were low.49 The risk
of residual lesions in patients with high-grade ovarian cancer after cytoreductive surgery is closely related to the high expression of ADH1B.50 HBB is one of the globin strands of
hemoglobin, whose basic function is to transport oxygen.51
A study found that the expression of HBB proteins in a rat model of ovarian cancer was significantly lower, which sug-gests that it can be used for early diagnosis and disease detec-tion, and as a treatment target.52 Thus, ADH1B and HBB are
negatively correlated with patient outcome. This conclusion is also consistent with previous studies reporting that HBB and ADH1B are biomarkers for early detection and found in other microarrays retrieved from oncomine.53
The important role of protein kinases in cellular activity has received increased attention. Protein kinases can phos-phorylate target proteins deliver and amplify signals, and then regulate the activities of normal epithelial cells, inflam-matory cells, tumor cells, and other cells, such as prolifera-tion, migraprolifera-tion, apoptosis, and metastasis.54 TTK kinase is a
dual-specificity kinase that can phosphorylate tyrosine and serine/threonine residues and is critical for the recruitment of SAC proteins to unattached kinetochores, mitotic checkpoint complex (MCC) formation, and mitotic arrest.55 Studies
have reported that TTK is overexpressed in many cancers, such as breast cancer, lung cancer, prostate cancer, and liver cancer.56–59 Another report showed that TTK is a favorable
prognostic biomarker associated with triple negative breast cancer (TNBC) survival, and a high level of TTK expres-sion predicts good survival and may safely spare the patient from adjuvant chemotherapy. A low level of TTK activates B-Raf/ERK signaling, which contributes to the invasiveness of cancer cells and poor survival of patients with TNBC.60
Conclusion
We downloaded multiple microarray datasets from the NCBI GEO database and integrated three microarray datasets. Then, we used R software and bioinformatics analysis to further investigate these datasets. We have identified 190 candidate DEGs, which may be involved in the progression of
ovarian cancer. Among them, 99 genes were upregulated and 91 genes were downregulated. Using R software, we identi-fied the top 20 most significantly up- and downregulated genes that could be the most related to the occurrence and development of ovarian cancer. By analyzing the GO and KEGG pathways, we found that DEGs were mainly enriched in the Wnt signaling pathway, metabolic pathways, and pathways in cancer, which provide a theoretical basis for studying the biological processes of ovarian cancer. We suc-cessfully constructed a PPI network of DEGs in epithelial ovarian cancer and screened several key genes encoding proteins in the network that are involved in the process of ovarian cancer in the form of molecular populations. Further study of this network would be beneficial for understanding the interaction between DEGs. These findings improve our understanding of the pathogenesis of ovarian cancer and the occurrence and development of the underlying molecular mechanisms. Our study has important clinical significance for the early diagnosis and treatment, as well as the preven-tion, of ovarian cancer and provides effective targets for the treatment of ovarian cancer. However, further molecular biological experiments are required to confirm the function of the identified genes associated with ovarian cancer.
Acknowledgments
This work was supported by the Independent Research Project of Wuhan University (grant no 413000117) and the National Natural Science Foundation of China (grant no 81302273).
Disclosure
The authors report no conflicts of interest in this work.
References
1. Alipour S, Zoghi S, Khalili N, Hirbod-Mobarakeh A, Emens LA, Rezaei N. Specific immunotherapy in ovarian cancer: a systematic review. Immunotherapy. 2016;8(10):1193–1204.
2. Siegel RL, Miller KD, Jemal A. Cancer statistics, 2017. CA Cancer J Clin. 2017;67(1):7–30.
3. Siegel R, Ma J, Zou Z, Jemal A. Cancer statistics, 2014. CA Cancer J Clin. 2014;64(1):9–29.
4. Bookman MA. Optimal primary therapy of ovarian cancer. Ann Oncol. 2016;27(Suppl 1):i58–i62.
5. Petryszak R, Burdett T, Fiorelli B, et al. Expression Atlas update – a database of gene and transcript expression from microarray- and sequencing-based functional genomics experiments. Nucleic Acids Res. 2014;42(Database issue):D926–D932.
6. Nannini M, Pantaleo MA, Maleddu A, Astolfi A, Formica S, Biasco G. Gene expression profiling in colorectal cancer using microarray technolo-gies: results and perspectives. Cancer Treat Rev. 2009;35(3):201–209. 7. Bitler BG, Aird KM, Garipov A, et al. Synthetic lethality by targeting
EZH2 methyltransferase activity in ARID1A-mutated cancers. Nat Med. 2015;21(3):231–238.
OncoTargets and Therapy downloaded from https://www.dovepress.com/ by 118.70.13.36 on 25-Aug-2020
Dovepress Degs and signaling pathways in ovarian cancer
8. Vosa U, Kolde R, Vilo J, Metspalu A, Annilo T. Comprehensive meta-analysis of microRNA expression using a robust rank aggregation approach. Methods Mol Biol. 2014;1182:361–373.
9. Bowen NJ, Walker LD, Matyunina LV, et al. Gene expression profil-ing supports the hypothesis that human ovarian surface epithelia are multipotent and capable of serving as ovarian cancer initiating cells. BMC Med Genomics. 2009;2:71.
10. Yeung TL, Leung CS, Wong KK, et al. ELF3 is a negative regulator of epithelial–mesenchymal transition in ovarian cancer cells. Oncotarget. 2017;8(10):16951–16963.
11. Marzancola MG, Sedighi A, Li PC. DNA microarray-based diagnostics. Methods Mol Biol. 2016;1368:161–178.
12. Hollingshead D, Lewis DA, Mirnics K. Platform influence on DNA microarray data in postmortem brain research. Neurobiol Dis. 2005; 18(3):649–655.
13. Sherman BT, Huang da W, Tan Q, et al. DAVID knowledgebase: a gene-centered database integrating heterogeneous gene annotation resources to facilitate high-throughput gene functional analysis. BMC Bioinformatics. 2007;8:426.
14. von Mering C, Huynen M, Jaeggi D, Schmidt S, Bork P, Snel B. STRING: a database of predicted functional associations between proteins. Nucleic Acids Res. 2003;31(1):258–261.
15. Jemal A, Siegel R, Ward E, Hao Y, Xu J, Thun MJ. Cancer statistics, 2009. CA Cancer J Clin. 2009;59(4):225–249.
16. Duffy MJ. Use of biomarkers in screening for cancer. Adv Exp Med Biol. 2015;867:27–39.
17. Djamgoz MB, Coombes RC, Schwab A. Ion transport and cancer: from initiation to metastasis. Philos Trans R Soc Lond B Biol Sci. 2014; 369(1638):20130092.
18. Akhurst RJ, Hata A. Targeting the TGFbeta signalling pathway in disease. Nat Rev Drug Discov. 2012;11(10):790–811.
19. Kim AN, Jeon WK, Lim KH, Lee HY, Kim WJ, Kim BC. Fyn mediates transforming growth factor-beta1-induced down-regulation of E-cadherin in human A549 lung cancer cells. Biochem Biophys Res Commun. 2011; 407(1):181–184.
20. Zhang C, Zhang Z, Zhang S, Wang W, Hu P. Targeting of Wnt/beta-catenin by anthelmintic drug pyrvinium enhances sensitivity of ovarian cancer cells to chemotherapy. Med Sci Monit. 2017;23:266–275. 21. Bodnar L, Stanczak A, Cierniak S, et al. Wnt/beta-catenin pathway as
a potential prognostic and predictive marker in patients with advanced ovarian cancer. J Ovarian Res. 2014;7:16.
22. Malemud CJ. Matrix metalloproteinases (MMPs) in health and disease: an overview. Front Biosci. 2006;11:1696–1701.
23. Li K, Ying M, Feng D, et al. Fructose-1,6-bisphosphatase is a novel regulator of Wnt/beta-catenin pathway in breast cancer. Biomed Pharmacother. 2016;84:1144–1149.
24. Gong C, Qu S, Lv XB, et al. BRMS1L suppresses breast cancer metas-tasis by inducing epigenetic silence of FZD10. Nat Commun. 2014; 5:5406.
25. Tomar T, Alkema NG, Schreuder L, et al. Methylome analysis of extreme chemoresponsive patients identifies novel markers of plati-num sensitivity in high-grade serous ovarian cancer. BMC Med. 2017; 15(1):116.
26. Malinauskas T, Jones EY. Extracellular modulators of Wnt signalling. Curr Opin Struct Biol. 2014;29:77–84.
27. Marwitz S, Depner S, Dvornikov D, et al. Downregulation of the TGFbeta pseudoreceptor BAMBI in non-small cell lung cancer enhances TGFbeta signaling and invasion. Cancer Res. 2016;76(13):3785–3801. 28. Jiang H, Li F, He C, Wang X, Li Q, Gao H. Expression of Gli1 and
Wnt2B correlates with progression and clinical outcome of pancreatic cancer. Int J Clin Exp Pathol. 2014;7(7):4531–4538.
29. Schwab RHM, Amin N, Flanagan DJ, Johanson TM, Phesse TJ, Vincan E. Wnt is necessary for mesenchymal to epithelial transition in colorectal cancer cells. Dev Dyn. Epub 2017 May 30:doi:10.1002/dvdy.24527. 30. Endo H, Ikeda K, Urano T, Horie-Inoue K, Inoue S. Terf/TRIM17
stimulates degradation of kinetochore protein ZWINT and regulates cell proliferation. J Biochem. 2012;151(2):139–144.
31. Xu C, Sun L, Jiang C, et al. SPP1, analyzed by bioinformatics meth-ods, promotes the metastasis in colorectal cancer by activating EMT pathway. Biomed Pharmacother. 2017;91:1167–1177.
32. Zhuo C, Li X, Zhuang H, et al. Elevated THBS2, COL1A2, and SPP1 expression levels as predictors of gastric cancer prognosis. Cell Physiol Biochem. 2016;40(6):1316–1324.
33. Fedarko NS, Jain A, Karadag A, Van Eman MR, Fisher LW. Elevated serum bone sialoprotein and osteopontin in colon, breast, prostate, and lung cancer. Clin Cancer Res. 2001;7(12):4060–4066.
34. Hu P, Chen X, Sun J, Bie P, Zhang LD. siRNA-mediated knockdown against NUF2 suppresses pancreatic cancer proliferation in vitro and in vivo. Biosci Rep. 2015;35(1):e00170.
35. Sethi G, Pathak HB, Zhang H, et al. An RNA interference lethality screen of the human druggable genome to identify molecular vulner-abilities in epithelial ovarian cancer. PLoS One. 2012;7(10):e47086. 36. Januchowski R, Wojtowicz K, Sterzynska K, et al. Inhibition of
ALDH1A1 activity decreases expression of drug transporters and reduces chemotherapy resistance in ovarian cancer cell lines. Int J Biochem Cell Biol. 2016;78:248–259.
37. Condello S, Morgan CA, Nagdas S, et al. Beta-Catenin-regulated ALDH1A1 is a target in ovarian cancer spheroids. Oncogene. 2015; 34(18):2297–2308.
38. Burki TK. CA-125 blood test in early detection of ovarian cancer. Lancet Oncol. 2015;16(6):e269.
39. Rao TD, Tian H, Ma X, et al. Expression of the carboxy-terminal portion of MUC16/CA125 induces transformation and tumor invasion. PLoS One. 2015;10(5):e0126633.
40. Xu H, Inagaki Y, Seyama Y, et al. Expression of KL-6/MUC1 in pan-creatic ductal carcinoma and its potential relationship with beta-catenin in tumor progression. Life Sci. 2011;88(23–24):1063–1069.
41. Gnemmi V, Bouillez A, Gaudelot K, et al. MUC1 drives epithelial– mesenchymal transition in renal carcinoma through Wnt/beta-catenin pathway and interaction with SNAIL promoter. Cancer Lett. 2014; 346(2):225–236.
42. Rehn AP, Cerny R, Sugars RV, Kaukua N, Wendel M. Osteoadherin is upregulated by mature osteoblasts and enhances their in vitro differ-entiation and mineralization. Calcif Tissue Int. 2008;82(6):454–464. 43. Williamson RE, Darrow KN, Giersch AB, et al. Expression studies of
osteoglycin/mimecan (OGN) in the cochlea and auditory phenotype of Ogn-deficient mice. Hear Res. 2008;237(1–2):57–65.
44. Tanaka K, Matsumoto E, Higashimaki Y, et al. Role of osteoglycin in the linkage between muscle and bone. J Biol Chem. 2012;287(15): 11616–11628.
45. Pollard JW. Macrophages define the invasive microenvironment in breast cancer. J Leukoc Biol. 2008;84(3):623–630.
46. Deryugina EI, Quigley JP. Matrix metalloproteinases and tumor metas-tasis. Cancer Metastasis Rev. 2006;25(1):9–34.
47. Hansel DE, Zhang Z, Petillo D, Teh BT. Gene profiling suggests a common evolution of bladder cancer subtypes. BMC Med Genomics. 2013;6:42.
48. Han SS, Kim WJ, Hong Y, et al. RNA sequencing identifies novel markers of non-small cell lung cancer. Lung Cancer. 2014;84(3): 229–235.
49. Chiang CP, Jao SW, Lee SP, et al. Expression pattern, ethanol- metabolizing activities, and cellular localization of alcohol and aldehyde dehydrogenases in human large bowel: association of the functional polymorphisms of ADH and ALDH genes with hemorrhoids and col-orectal cancer. Alcohol. 2012;46(1):37–49.
50. Tucker SL, Gharpure K, Herbrich SM, et al. Molecular biomarkers of residual disease after surgical debulking of high-grade serous ovarian cancer. Clin Cancer Res. 2014;20(12):3280–3288.
51. Giardina B, Messana I, Scatena R, Castagnola M. The multiple functions of hemoglobin. Crit Rev Biochem Mol Biol. 1995;30(3):165–196. 52. Huang Y, Zhang X, Jiang W, et al. Discovery of serum biomarkers
implicated in the onset and progression of serous ovarian cancer in a rat model using iTRAQ technique. Eur J Obstet Gynecol Reprod Biol. 2012; 165(1):96–103.
OncoTargets and Therapy downloaded from https://www.dovepress.com/ by 118.70.13.36 on 25-Aug-2020
OncoTargets and Therapy
Publish your work in this journal
Submit your manuscript here: http://www.dovepress.com/oncotargets-and-therapy-journal
OncoTargets and Therapy is an international, peer-reviewed, open access journal focusing on the pathological basis of all cancers, potential targets for therapy and treatment protocols employed to improve the management of cancer patients. The journal also focuses on the impact of management programs and new therapeutic agents and protocols on
patient perspectives such as quality of life, adherence and satisfaction. The manuscript management system is completely online and includes a very quick and fair peer-review system, which is all easy to use. Visit http://www.dovepress.com/testimonials.php to read real quotes from published authors.
Dovepress
Dove
press
Yang et al
53. Liu X, Gao Y, Zhao B, et al. Discovery of microarray-identified genes associated with ovarian cancer progression. Int J Oncol. 2015;46(6): 2467–2478.
54. Lavoie H, Li JJ, Thevakumaran N, Therrien M, Sicheri F. Dimerization-induced allostery in protein kinase regulation. Trends Biochem Sci. 2014;39(10):475–486.
55. Xu Q, Zhu S, Wang W, et al. Regulation of kinetochore recruitment of two essential mitotic spindle checkpoint proteins by Mps1 phosphoryla-tion. Mol Biol Cell. 2009;20(1):10–20.
56. Daniel J, Coulter J, Woo JH, Wilsbach K, Gabrielson E. High levels of the Mps1 checkpoint protein are protective of aneuploidy in breast cancer cells. Proc Natl Acad Sci U S A. 2011;108(13):5384–5389.
57. Landi MT, Dracheva T, Rotunno M, et al. Gene expression signature of cigarette smoking and its role in lung adenocarcinoma development and survival. PLoS One. 2008;3(2):e1651.
58. Shiraishi T, Terada N, Zeng Y, et al. Cancer/testis antigens as potential predictors of biochemical recurrence of prostate cancer following radical prostatectomy. J Transl Med. 2011;9:153.
59. Liang XD, Dai YC, Li ZY, et al. Expression and function analysis of mitotic checkpoint genes identifies TTK as a potential therapeutic target for human hepatocellular carcinoma. PLoS One. 2014;9(6):e97739. 60. Xu Q, Xu Y, Pan B, et al. TTK is a favorable prognostic biomarker
for triple-negative breast cancer survival. Oncotarget. 2016;7(49): 81815–81829.
OncoTargets and Therapy downloaded from https://www.dovepress.com/ by 118.70.13.36 on 25-Aug-2020