An Integrated Effectiveness Framework of Mobile In-App
Advertising
Vinh Truong
RMIT University Vietnam
Mathews Nkhoma
RMIT University Vietnam
Wanniwat Pansuwong
RMIT University Vietnam
Abstract
Advertising in mobile apps has recently become one of the most popular advertising channels for businesses when its annual revenue has rapidly increased year over year. On this kind of advertising, the app publishers do not only play a critical role in the ad serving process but also receive a significant portion of the advertising revenue. Their goal of maximizing the revenue sometimes contradict with those of the advertisers. This research conceptualises the role of publishers and proposes an integrated effectiveness framework to further improve the effectiveness of mobile in-app advertising not for one but all participants involved. In specific, this research explores the factors being controlled by publishers and evaluates their impact on the common outcome metric of mobile in-app advertising. An application of the proposed effectiveness framework might help to increase the global mobile in-app advertising revenue significantly higher by balancing the benefits of all participants.
Keywords: Mobile advertising; Mobile apps; Effectiveness
1
Introduction
are two main parties that are involved in an ad serving process: the advertiser who provides the ads and the publisher who offers the ad spaces in their mobile applications. Between the advertiser and the publisher, there are two service parties: the bidding service and the auction service (see Appendix A). When a consumer visits the website, an auction takes place in milliseconds and the winner can make the impression (Perlich et al. 2012). The bids are highly automated and informed by data and models – that is the reason why RTB-based advertising is sometimes called programmatic advertising. The intermediaries got paid from the advertisers per the numbers of impressions and click supplied and pay back the publishers by the numbers of impressions and clicks delivered (Kumar, Sa 2016). In 2017, more than 62% of the total display advertising revenues were priced on the basis of the number of clicks (IAB 2017). A better ad click performance, therefore, brings the benefits not only to the advertisers but also to the publishers.
With the help of ad networks like Google Ads, Facebook Audience Network, and Twitter MoPub, the advertisers nowadays have many options to improve the effectiveness of their advertising campaigns by using contextual and personalized targeting (Andrews 2017; Broder et al. 2007; Yan et al. 2009), needless to mention the traditional use of ad designs as controlled by the advertisers themselves. Basically, in practice, there are three types of targeting related to ad characteristics, personal information and context (Chen, P-T & Hsieh 2011; De Pelsmacker, Geuens & Anckaert 2002). On the theoretical side, the Interactive Advertising Model (IAM) proposed by Rodgers and Thorson (2000) categorized all the factors affecting the interactive advertising effectiveness into either advertiser or consumer-controlled (see Appendix B). The Online Behavioral Advertising (OBA) framework recently proposed by Boerman, Kruikemeier and Zuiderveen Borgesius (2017) extended the IAM to include more factors but basically are controlled by advertiser or consumer only (see Appendix C). The Mobile Advertising Effective Framework (MAEF) by Grewal, Bart, Spann and Zubcsek (2016) is built around the advertiser goals and categorize factors affecting the outcome metric into ad elements, context, consumer, market, and firm (see Appendix D), extending more factors that are controlled by ad networks.
with practitioners who can provide greater access to relevant data, such as earned traffic via apps (Grewal, Bart, Spann & Zubcsek 2016).
There is a need to determine the factors controlled by the publishers in specific and the necessity of building an integrated effectiveness framework for all participants involved in the mobile in-app advertising in general. That framework must be built around a common goal of all participants and included publishers-controlled factors which are missed out in previous frameworks.
The present study will address the following research questions:
• What factors are controlled by app publishers and their impacts?
• What is the common goal of all participants involved in mobile in-app advertising and what is the outcome metric to measure that goal? What framework can combine all the participants’ factors in the process to enhance that outcome metric? What are the main and interactive impacts of those factors on the common outcome metric of mobile in-app advertising?
The purpose of the present study was to fill the gap in mobile in-app advertising studies in relation to an integrated effectiveness framework and the publishers-controlled factors, particularly their relationship with consumer, advertiser, and network-controlled ones. Empirically, the present study attempted to evaluate their main and interactive impacts on a common outcome metric first before testing the proposed integrated effectiveness framework on a larger scale.
Four main independent variables were studied in the present research:
• Ad Space Duration: refers to the duration of ad spaces supplied by publishers • Ad Space Size: refers to the size of ad spaces supplied by publishers
• Ad Space Position: refers to the position of ad spaces delivered by the publishers • Ad Space Timing: refers to the timing of ad spaces delivered by the publishers
The dependent variable of the present study is the click-through rate, which was found in this study as the common metric which can measure the common goal of direct response interactively.
Besides the four publishers-controlled variables, the present study also examines these following non-publisher-controlled ones:
• Location: refers to the receiver contextual location where the ads are served and controlled by the ad networks (Grewal, Bart, Spann & Zubcsek 2016)
• Time: refers to the receiver contextual time when the ads are served and controlled by the ad networks (Grewal, Bart, Spann & Zubcsek 2016)
• Ad Type: refers to the media type on which the ads are served and controlled by the advertisers (Rodgers & Thorson 2000)
• Ad Medium: refers to the medium/app on which of ads are served and controlled by the consumers (Boerman, Kruikemeier & Zuiderveen Borgesius 2017)
advertising, mobile display advertising and then web advertising in general. The factors when found will be grouped by their participants. For the first research question, the present study attempted to investigate the descriptive and explanatory relationships between publisher-controlled factors and the effectiveness of mobile in-app advertising. Thus, it was found suitable to pursue the hypothetical-quantitative approach. It started by testing hypotheses deduced from theoretical issues subject to empirical scrutiny via the use of data collected from mobile applications. In specific, the identified publishers-controlled factors will be individually evaluated using the A/B testing – the most popular testing methodology on the Internet (Kohavi et al. 2009).
To answer the second research question, academic literature relating to the mobile in-app advertising goals and outcome metrics will be systematically reviewed to determine what the common goal is and what metric to measure that common goal. Any discussion of advertising effectiveness necessarily must involve the role of objectives in advertising management contexts (Li, H & Leckenby 2004). With reference to the previous effective frameworks, the present study will propose an integrated effectiveness framework based on that common goal. To test the framework, a fractional 28xn experimental design is used. Multivariate tests via Statistical Packages for Social Sciences (SPSS), RStudio and Excel Data Analysis ToolPak, were employed for further data analyses. The multi-factorial experimental design is common in the statistical literature (Cox & Reid 2000), where each parameter (factor) can be experimented on independently and when each experimental value for a parameter overlaps with every other experiment value for all of the other parameters.
The contributions of the present study can be presented from three perspectives, i.e. theoretical, empirical and practical, which are described below. Theoretically, the present study proposed a newly integrated effectiveness framework which extends previous effectiveness framework to include new constructs and relationships. Empirically, the present study set up a new way of designing multiple ad spaces in a single app. By doing so, multiple factors can be tested interactively and concurrently. That helps to save the time of doing multiple nested A/B tests. Practically, the present study suggests newly integrated advertising strategies associated with publishers to further enhance the ad click performance of mobile in-app advertising. By which, newly integrated advertising strategies could be recommended to be applied in practice and could help increasing mobile in-app advertising revenue significantly higher by balancing the benefits of all participants involved.
2
Background
The present study is grounded in web advertising, mobile advertising and mobile display advertising.
2.1
Web Advertising
There are various definitions of advertising. Richards and Curran (2002) suggested that advertising is defined as a communication designed to entice an audience to take some action, either instantly or in the near future. The advertisement is usually paid from an identifiable source and can be conveyed through print, TV, web and other methods.
households had computers, and fewer than half of those machines had Internet connections, only traditional methods of advertising were used (Thorson & Schumann 1999). At that time, banner ads were served as links to the online versions of newspapers, business directories or other direct services. By then, banner ads were one of the most prevalent online display ad formats (Hoffman & Novak 2000; Mangani 2004). Banner ads are considered as display ads (Edizel, Mantrach & Bai 2017). They are a form of graphical ads embedded into a webpage and commonly used as a combination of static/animated images or text and/or video. These are designed to convey an advertising/marketing message and/or encourage users to take action. Banner ad dimensions are generally defined by width and height, represented in pixels. By 1996, the banner ads on the web bring back a revenue of $267 million (Internet Advertising Revenue Report 1996-2016).
Since 1997, web advertisers have become more mature. They started focusing on targeting web advertisements. Instead of links, they are more concerned with location and personalization (Thorson & Schumann 1999). To overcome the geographic limitation of web advertising at that time, the websites asked their users to register the zip codes. Tailoring advertisements and purchase experiences to individual tastes, on the basis of people’s needs, interests, and preferences are called as personalization (Chellappa & Sin 2005). Personalization is an antecedent of online service quality (Wolfinbarger & Gilly 2003). Mokbel and Levandoski (2009) assert that advertising contents should be personalized or matched to users’ preferences and profile. Web display advertising could be in the forms of banners, skyscrapers, and rich media in order to achieve brand awareness and encourage click through to a target website. In one of the early studies of banner advertisement effects, Briggs and Hollis (1997) found that banner advertisements resulted in heightened awareness, brand perceptions and attitudinal shifts for brands.
By 1998, another form of ads was created and become popular. Those are Interstitial Ads. Ads of this type will appear while users wait for screens to download. By then, the advertisers have learnt to maximize their advertising revenue by taking advantage of loading time. The year 1998 is also the year when the history of contextual advertising began. Oingo, Inc., a privately held company started by Gilad Elbaz and Adam Weissman, developed a proprietary search algorithm based on word meanings and built upon an underlying lexicon called WordNet. Google acquired Oingo in April 2003 and renamed the system AdSense (Karp 2008). Later, Yahoo! Publish Network, Microsoft adCenter and Advertising.com Sponsored Listings amongst others were created to offer similar services (Kenny & Marshall 2001). Until then, the contextual advertising platforms have evolved to adapt to a richer media environment, such as video, audio and mobile networks with geographical information. These platforms allowed publishers to sell ad spaces on their web pages, video clips and mobile applications to make money. Usually, such services are called an advertising network or a display network that are not necessarily run by search engines and can consist of a huge number of individual publishers and advertisers.
2009). By then, web publishers have started thinking of maximizing revenue through their ad spaces while balancing it with user experience.
Around 2007, new platforms focusing on real-time buying and selling impressions were created, like ADSDAQ, AdECN, DoubleClick Advertising Exchange, adBrite, and Right Media Exchange, that is now known as ad exchanges (Graham 2011). Unlike traditional ad networks, these ad exchanges aggregate multiple ad networks together to balance the demand and supply in marketplaces (Muthukrishnan 2009). Individual publishers and advertising networks can benefit from participating in such businesses. On one hand, publishers sell impressions to advertisers who are interested in associated user profiles and context. Advertisers, on the other hand, could also get in touch with more publishers for better matching. During this time, other similar platforms emerged: the demand-side platform (DSP) and supply-side platform (SSP). These services help individual ad networks exchange their ad inventories in real time. Due to that, the kind of advertising is sometimes called programmatic advertising (Laudon & Traver 2018).
The emergence of ad exchanges is a result of the fact that there are thousands of ad networks available on the Internet, which can act as a barrier for advertisers as well as publishers when getting into the online advertising business. Advertisers have to create and maintain campaigns frequently for better coverage and analyse data across many platforms for a better impact. Publishers have to register with and compare several ad networks carefully to achieve optimal revenue. The ad exchange came as an aggregated marketplace of multiple ad networks to help alleviate such problems. Advertisers can create their campaigns and set desired to target only once and analyse the performance data stream in a single place, and publishers can register with ad exchanges and collect the optimal profit without any manual interference (Meyer et al. 2018). The advertising marketplaces are becoming more mature with the emergence of DSP, SSP and the revenue comes higher (Steel 2011).
With the invention of search engines in the later years, noticeably Google, web advertising revenue went even higher (Evans 2009). With those search engines, the advertisers have more access to the users’ interest and behaviour, which in turn helped improving ad targeting and personalization (Ha 2008). Since then, the advertising campaigns become more interactive (Park, Shenoy & Salvendy 2008). During this time, websites have started making use of an array of Personally Identifiable Information (PII) about users whilst they are accessing the website, derived from cookies, flash cookies, web beacons, browser and other meta-data. This PII is used to profile users and so deliver relevant, targeted ads to them, which has been shown to be effective in the study by Yan et al. (2009) who were able to provide empirical evidence of improvement using behavioural targeting. Even in the absence of cookies and other tracking files, it is possible to perform user profiling based on browser data alone. A higher number of studies on the contextual factors is recorded in this time, e.g. Adler, Gibbons and Matias (2002), Menon et al. (2011), Nakamura and Abe (2005) and Kumar, Subodha, Jacob and Sriskandarajah (2006). As technology has advanced, practitioners have become more concerned about increasing the effectiveness of employing modern technology like contextual analysis and using geographic location (Idwan et al. 2008). The popularity of web advertising continued to grow in the twenty-first century with the help of social media (such as Facebook, Twitter, and LinkedIn). By 2013, around $5.1 billion was already spent on social advertising.
to have their websites shown in top placement on search engine result pages. In web display advertising, advertisers reach out to a target Internet audience via some form of a visual advertisement such as display banner ads (including mobile), flash-based rich media, or
digital video (Aksakallı 2012). The web advertising practice is basically based on traditional advertising theories (Okazaki 2012). Firstly, it is based on Uses and Gratifications Theory, which were developed by Katz, Blumler and Gurevitch (1973). The driving question of Uses and Gratifications is why do people use media and what do they use them for. The Uses and Gratifications Theory discusses how users deliberately choose media that will satisfy given needs and allow one to enhance knowledge, relaxation, social interactions, diversion or escape. The users are normally active in their selection of content and messages from the mass media. In advertising, the Uses and Gratification Theory implies that the consumer is not passive, helpless advertising fodder (Hedges, Ford-Hutchinson & Stewart-Hunter 1997). Instead, advertisers and consumers factors interactively affect the outcome of advertising and they should be consumer-based, not vice versa. Another popular advertising theory is the theory of reasoned action developed by Fishbein and Ajzen (1975). The theory is used to explain the relationship between attitudes and behaviours within human action (the A-B relationship). It predicts how individuals will behave based on their pre-existing attitudes and behavioural intentions. Based on the theory of reasoned action, Ducoffe (1996) developed a well-defined Advertising Value Model. It is a framework for predicting attitudes toward web advertising. The Technology Acceptance Model was later developed by Davis (1985). The model suggests that the user’ attitude to the information system will directly affect the user’s intention, while the perceived usefulness and perceived ease of use will affect the users’ attitude towards information system, including clicks on advertisements. Okazaki and Barwise (2011) claimed that, in the field of web advertising, Technology Acceptance Model is the most frequently used model.
In terms of revenue, by 2013, the total revenue was already at $43 billion, including both web display advertising and mobile advertising (Internet Advertising Revenue Report 1996-2016).
2.2
Mobile Advertising
Mobile advertising is related closely to web advertising but with a far greater reach. Mobile advertising is referred to as “advertising or marketing messages delivered to portable devices, either via a synchronized download or wirelessly over the air” (Laszlo 2009). The differences between fixed (e.g. PC, web) and portable devices create some new opportunities for marketers, but they also prevent them from easily generalizing the research findings from fixed to mobile online settings. Typical online (but fixed) advertising strategies are either not applicable or at least demand modification to be effective (Shankar & Balasubramanian 2009). Mobile advertising, therefore, is considered as a new type of advertising and requires new academic research and practical strategies.
Ads on mobile devices have a long history especially after Short Message Service (SMS) became popular (Yunos, Gao & Shim 2003). In the early days, mobile advertising is usually considered as SMS advertising (Barwise & Strong 2002; Haghirian & Inoue 2007). Actually, the dawn of mobile advertising research begins with two seminal SMS related works: Barnes (2002) and Barwise and Strong (2002). The former is conceptual and the latter empirical (Okazaki 2012).
people using fixed devices, such as PCs. These rapid shifts have been echoed by advertisers, who have shifted their expenditures. The mobile advertising captured 22% of U.S. digital advertising expenses in 2013 and that number keeps increasing year by year (eMarketer 2015). By 2014, 66% of Facebook advertising revenue came from mobile ads, while that number on Twitter is already 85% (Bergen 2014). The success of mobile advertising is due to the fact that mobile devices are considered very personal, as extensions of users’ selves (Shu & Peck 2011). The increase in smartphone usage, in the sense that it provides marketers with an opportunity for electronic presence sense that this provides marketers with an opportunity for electronic presence (Lemon & Verhoef 2016; Varnali & Toker 2010).
The popularity of iPhone and Android devices bring a new form of mobile advertising through mobile web and mobile apps. Basically, the mobile ads in the forms of SMS messages and as display ads on mobile web and apps are different. According to Barnes (2002), they are two types of mobile advertising: push and pull. Push advertising involves or 'pushing' advertising messages to consumers, usually via an alert or SMS text message. Pull advertising involves placing advertisements on browsed wireless content, promoting free content. On mobile web and apps, messages are transferred by the free will of the audience, which is considered as a pull-type mobile display advertising (Park, Shenoy & Salvendy 2008).
Between the two types of mobile advertising, in theory, the research trends have been heavily skewed toward push advertising (Okazaki 2012). Empirical field research in mobile advertising mainly investigates the effectiveness of mobile coupons delivered via SMS, which are of push-type (Grewal, Bart, Spann & Zubcsek 2016) leaving the pull-type mobile display advertising largely unexplored (Korula, Mirrokni & Nazerzadeh 2016).
2.3
Mobile Display Advertising
Although largely unattended in academic literature, the revenue of pull-type display advertising keeps increasing. The trend in online publishing shows that online news outlets increasingly rely on advertising to generate revenue, as most readers refuse to pay subscription fees to read online news (Newman et al. 2016). In 2017, Mobile Display Advertising already generated nearly 70 billion USD (Statista 2018). As smartphones penetrate markets worldwide and applications on smartphones become more popular, a new type of form of mobile display advertising, called mobile in-app advertising, has become more popular (Hirose, Mineo & Tabe 2017). Smartphone users spend much more time on their apps while spending less time on mobile Internet access through web browsers.
The increase in popularity of smartphones has led to the growing need of developing smartphone applications (apps) that are gradually replacing the traditional use of internet services (Gupta, Khirbat & Singh 2014). As of Jun. 2016, Android and iPhone users were able to choose respectively between 2.2 million and 2 million mobile apps (Gupta, Khirbat & Singh 2014). The users are ever more motivated using mobile apps and it was announced that more than 195 billion mobile apps have already been downloaded together from App Store and Android Market (Cumulative number of apps downloaded from the apple app store 2018).
personalized advertising. Compared to mobile website advertising, in-app advertising can be related to personal information collected with a global positioning system (GPS) (Hirose, Mineo & Tabe 2017). Rosenkrans and Myers (2012) study explored the effectiveness of the Technology Acceptance Model (TAM) and the uses and gratifications theory by comparing mobile banner ads to non-mobile banner ads on a local newspaper’s website. Findings from their research indicated that mobile banner ads had significantly higher click-through rates than the non-mobile banner ads.
Another difference between mobile in-app advertising and mobile web advertising is the role of app publisher. It is observed that more apps adopt a pure ad strategy, that is, free apps with ads. That could be due to: consumer learning of the valuation of the app (Niculescu & Wu 2014); many developers adopt a freemium model where the app is made free to facilitate consumer referrals (Lee, C, Kumar & Gupta 2013); some developers offer free trials to reduce consumers’ uncertainty about the functionalities of their products and leverage the network effect among the users (Cheng, Li & Liu 2015; Cheng & Liu 2012) and some developers allow users to pay to remove ads in the free version (Lin, M, Ke & Whinston 2012). In mobile in-app advertising, publishers have more control than any other type of advertising. For example, unlike traditional newspaper and television firms, which have control over their ad publishing channels, a mobile platform owner has to induce mobile app developers to publish ads in their apps in order for the ads to reach any app users. If a developer chooses to publish in-app ads, the platform owner shares a portion of the advertising revenue with the app developer based on a revenue-sharing contract (Hao, Guo & Easley 2017). Furthermore, compared to traditional advertising (e.g., newspaper), in-app advertising has an important difference that for in-app advertising, the platform has a split structure with the platform owner and the app developer jointly provision both the app and the ads (Hao, Guo & Easley 2017). In April 2010, when Apple’s ad network, iAd, was initially launched, the percentage of ad revenue that iAd passed to the developer was 60%. In 2012, Apple decided to boost the developer’s ad-revenue-sharing percentage from 60% to 70%, reducing its own ad revenue percentage in favour of the app developer’s (Aimonetti 2012). The new money flow which involves the app publishers is shown in Appendix B.
According to eMarketer (2015), the global spending on mobile in-app advertising was almost 30 billion USD, three times that of mobile web advertising. That accordingly accounts for 37% of the total online advertising revenue worldwide (IAB 2017). Apparently, mobile in-app advertising has become one of the most effective marketing channels for businesses and have become a significant revenue source for publishers.
3
Mobile In-App Advertising
The present study is related to literature in four areas of mobile in-app advertising: processes, participants, outcome metrics and factors.
ABI/INFORM Complete, Taylor & Francis, ScienceDirect, ACM, IEEE, Psychology Database is performed. The keywords used were “in-app advertising processes”, “in-app advertising participants”, “in-app advertising outcome metrics” and “in-app advertising factors”. The search period covered all manuscripts available by the end of May 2019. After identifying a study, its references will be examined to find further studies. In addition, experts in the field are also contacted to inquire about other relevant manuscripts. Studies that reported on empirical data will be included while nonempirical studies, such as legal studies are left out. In total, 192 manuscripts fit the criteria, and the earliest study was published in 2008. Among these, 154 were from academic journals, 16 from conference proceedings, 18 was a book chapter, and 4 were published online.
3.1
Mobile In-App Advertising Processes
On mobile apps, the users consume the advertising content by clicking or tapping on the ads. Before a mobile ad, or impression, is served in a mobile application, an ad serving process is performed. There are two ways that ads can be supplied to a mobile application: through guaranteed contracts or through an unguaranteed Real-Time Bidding process (Korula, Mirrokni & Nazerzadeh 2016). In the guaranteed contract setting, the publisher supplies the ad spaces and deliver the ad impressions strictly following the contract commitments. That guaranteed process normally involves only one publisher and one advertiser (Yuan, Wang & Zhao 2013). The contracts agreed by advertisers and publishers, or between ad networks, are long term and of large volume. Yuan et al. (2012) called that kind of private contracts as over-the-counter (OTC).
On the other hand, in the unguaranteed setting, between the advertiser and the publisher, there are two additional service parties that monitor the ad serving process: the bidding service and the auction service (Balseiro & Candogan 2017; Choi et al. 2017). Interactive Advertising Bureau is an organization who creates and maintains the standards and specifications for Real-Time Bidding (RTB) process in order to improve the ad network landscape (see Appendix A). If advertising opportunities are traded in unguaranteed and transparent markets, the trading units are usually small, although the total number of impressions for the advertising campaign could be huge (Yuan et al. 2012).
exchange manages contract negotiation between advertisers and content publishers that wish to sell ad spaces.
Usually, the publishers will employ the brokering services of an advertising platform such as Google’s DoubleClick, AOL’s Advertising.com and Microsoft Media Network. For large publishers, normal practice is to sell only remnant inventory through an ad exchange, with the other inventory being negotiated directly with advertisers. Smaller publishers normally sell all of their advertising spaces through ad exchanges (Yuan et al. 2012). In both guaranteed and unguaranteed ad serving processes, the publisher is the one who supplies ad spaces and delivers ad impressions via their ad spaces. Because of that, any mobile in-app advertising ad serving process can be broken down to ad space supply process and ad space delivery one.
3.1.1 Ad Space Supply Process
If an app developer chooses to publish ads, he allocates space in the app for displaying ads. The allocated in-app ad space can then be filled by the platform owner, with a certain probability, upon receiving an ad request from the app (Hao, Guo & Easley 2017). Brakenhoff and Spruit (2017) highlighted how publishers control the ad space supply in a standard ad serving process as shown in Appendix A. The ad space supply process is triggered when a user opens an application and the ad spaces are loaded. When design their apps the publisher will reserve some spaces to display advertisements, which are called ad spaces. Supplying ad spaces with different characteristics are something that the publisher can control by themselves. An ad is only considered as an impression when the design characteristics, specified by the advertiser, meet the specifications of the request from the publisher and it is only possible that a certain design is shown to a user if the design fits the available ad space (Brakenhoff and Spruit, 2017). Ad space is a physical object, and like any physical object, the ad space can be measured by both spatial and temporal dimensions. Information like height, width, and duration of ad spaces can be sent for auctioning via an ad exchange/ad network (Edizel, Mantrach & Bai 2017). The present study argued that by controlling the ad space supply process, the publishers can actively influence and determine the effectiveness of mobile in-app advertising.
3.1.2 Ad Space Delivery Process
Besides supplying ad spaces for bidding, the publisher is also the one who controls the delivery of ad impressions. Brakenhoff and Spruit (2017) illustrated the publishers-controlled delivery process in a standard ad serving process as shown in Appendix A. Referring to that process after the ads have been selected by the advertiser and the ad network, the publisher will have full control on how to deliver them to the user. The publishers can control how to position the ads on their applications and how to schedule them. Interactive Advertising Bureau recommends ad positions to be top or bottom of the screen and sometimes in the middle of page sections. They also recommend ad scheduling to be before, in between or after the primary content experience ('IAB New Standard Ad Unit Portfolio’ 2017; Rastogi et al. 2016). The present study argued that by controlling the ad space supply process, the publishers can actively influence and determine the effectiveness of mobile in-app advertising.
3.2
Mobile In-App Advertising Participants
use ad networks/ad exchanges to bid and distribute the advertisements with the publishers. The publishers will then place those advertisements on their apps for impressing. In the end, the users are the consumers of the advertisers’ brands or products (Lin, TTC et al. 2015). These four players have different goals in mind when involving advertising.
Firstly, the users want to receive advertisements with their permissions, personalized and relevant (Barwise & Strong 2002). In a study conducted by Cho (2003), it was found that users who were interested in the site and shown advertisements for products and services related to those on the site achieved a higher click-through rate and that those more involved in a product were more likely to click through. Jansen and Spink (2007) reported from their experiments that people will retain their behaviour of clicking on organic or sponsored links even when these two types of result are mixed. This leads to a belief that from the user’s perspective, the only thing that matters is the relevance of ads. Actually, Kumar, V and Gupta (2016) claimed that customers’ expectations for the relevant messaging are evolving; they seek customized communication designed to fulfil their specific needs. As long as the advertising message is relevant to either the content that is being viewed by the consumer or his or her consumption goals, the effectiveness of an advertisement is not adversely impacted by multimedia usage (Angell et al. 2016). Argued that users also clicked on ads that they found trusted, personalized and relevant.
Secondly, the advertisers when running a campaign aimed to achieve two main goals of branding and direct response (Barwise & Strong 2002; Kumar, Sa 2016; Park, Shenoy & Salvendy 2008; Zhu & Wilbur 2011):
• Branding: Brand awareness, attitude, purchase intention • Direct Response: Engagement, conversion, advocacy
On the other hand, ad networks/exchanges naturally try to find the best match for their ad inventories. The best match, overall, is not limited to the ‘relevance’ from the traditional informational retrieval research sense, but also includes the best revenue from the economic perspective (Yuan et al. 2012). It is to maximize the revenue based on the probability that an ad will be clicked as well as the relevance of the ads to the users (Richardson, Dominowska & Ragno 2007). As an ad exchange, revenue optimization is among the most important tasks in order to run a business. This is especially true for search engine companies, for example, Google made 96% of its revenue from its advertising business (Alphabet 2018).
Lastly, when the publishers involved with advertising, they are more concerned with the direct response (Choi et al. 2017). That is how they could earn revenue. In order to maximize revenue from the guaranteed contracts, the publisher’s allocation and inventory management have to be efficient (Feige et al. 2008; Roels & Fridgeirsdottir 2009). In general, the publishers can earn money based on the number of impressions and the number of clicks on their ad spaces.
Participant Goal
User Personalized (impressions), Relevance (clicks) Advertiser Branding (impressions), Direct Response (clicks) Ad networks/exchanges Best match (click-throughs)
Table 1 shows the participants and their goals. Out of the four participants, the goals of users and advertisers are most studied in the current literature (Boerman, Kruikemeier & Zuiderveen Borgesius 2017). For example, Rodgers and Thorson (2000) categorized all the factors affecting the interactive advertising effectiveness into either advertiser or consumer-controlled in their Interactive Advertising Model (IAM). The Interactive Advertising Model (IAM) has been widely referenced by scholars from various disciplines around the world since it is first proposed in 2000 (Rodgers, Ouyang & Thorson 2017). The IAM offers an integrated way to evaluate advertising effects from both consumer-controlled and advertiser-controlled viewpoints. According to IAM, the consumer controls the internet motives, mode and information processes, while the advertiser controls the ad types, ad formats and ad features (see Appendix B). Recently, Grewal, Bart, Spann and Zubcsek (2016) proposed Mobile Advertising Effectiveness Framework (MAEF) to enhance the advertising effectiveness for advertisers using advertisers’ ad elements, ad networks’ context and users’ consumer factors, but not publishers. Most of the online/interactive advertising frameworks are built around the advertiser and consumer goals but not the publisher’s one.
Noted on the missing role of publishers, Choi et al. (2017) provided a comprehensive view of the display ad ecosystem, including both guaranteed and non-guaranteed selling channels and suggested publishers find the benefits by balancing the ad allocations between these two channels. The study highlights the publisher goal of maximizing revenues through clicks. Yuan, Wang and Zhao (2013) showed a money flow, on which advertisers are those who pay for their advertising contents to be shown on publishers’ ad spaces. They pay that to the ad networks, like Google Ads, Facebook Audience Network. Those ad networks, in turn, will pay back the publishers. In April 2010 when Apple’s ad network, iAd, was initially launched, the percentage of ad revenue that iAd passed to the developer was 60% (Apple Inc 2010). Two years later, in 2012, Apple decided to boost the developer’s ad-revenue-sharing percentage from 60% to 70%, reducing its own ad revenue percentage in favour of the app developer’s (Aimonetti 2012). It means the revenue for publishers could start from 20-30% of the total mobile in-app advertising spending of 30 billion USD (eMarketer 2015). Mobile In-App Advertising is, therefore, also for publisher purpose (Yuan et al. 2012).
Typically, the publishers might not need to promote brand awareness as advertisers, but they share the same direct goal, aka clicks. The direct response also is used to measure the relevance of the ads to the users in the long run (Kohavi et al. 2009) and to measure the best match for the ad networks/exchanges (Kumar, S 2016). Increasing the matching, in the interactive context like mobile in-app advertising, therefore, is where both the publisher, the advertisers, the ad networks/exchange and the user's goals could meet. The present study argued that enhancing the matching is the common goal of all participants involved in mobile in-app advertising.
3.3
Mobile In-App Advertising Outcome Metrics
Some common Web metrics include: (1) page impressions, (2) ad impressions, (3) clicks, (4) visits, (5) unique visitors, (6) path analysis, (7) conversion rate, (8) frequency, and (9) recency (Rosenkrans, Ginger 2007). Among those metrics, clicks and ad impressions, i.e., the number of times an advertisement is served to a user's browser, are the top two metrics used for advertisement delivery reporting and audience measurement (Bhat, Bevans & Sengupta 2002). According to ('Interactive Audience Measurement and Advertising Campaign Reporting and Audit Guidelines’ 2014, September), a click is a user-initiated action of clicking on an ad element, causing a redirect to another web location. A click is when users interact within a Web browser or an app by using a device (i.e., mouse, finger, or a stylus). The 'Interactive Audience Measurement and Advertising Campaign Reporting and Audit Guidelines' 2014, September) states there are three kinds of clicks: click-through, in-unit click, and mouse-over (e.g., mouse rollover, or user rolls mouse-over ad). These three actions are referred to as clicks. A click-through is when a user initiates action by clicking on an ad and the click-through directs the user to another online location, such as another browser window or Web site. Click-throughs are tracked and reported by an ad server, and it is imperative that bot activity is excluded to ensure accurate and reliable metrics. The cost-per-click (CPC) model or click-through rate (CTR) remains one of the most important media pricing metrics for the Internet. Click-throughs are based on the number of clicks divided by the number of ads requested or clicked on by users during a time period (Bhat, Bevans & Sengupta 2002).
According to the structurational point of view (Giddens 1986), these two sets of measures are characterized by different, but complementary views regarding the role of interactive advertising. One set of measures focuses on the number of impressions. Such measures might be descriptively labelled as control process measures centralizing around advertisers’ goal. This is related to branding goals. The second set of measures focuses on the effects of consumers' using interactive media. Within an interactive context measures such as awareness, attitude, and product choice, among others, are not simply the result of exposure to advertising; they are also the result of choices made by the consumer, which are, in turn, guided by the consumer's goals and purposes. These outcome measures are the joint product, or interaction, of the consumer and the advertising. In that sense, advertising both shapes and is shaped by consumer preferences (Pavlou & Stewart 2000).
Accordingly, Revenue Per Thousand Impressions (RPM) and Click Through Rate (CTR) are the two most common metrics currently being used (Hagen, Robertson & Sadler 2006; Punyatoya 2011; Rosenkrans, G. 2007; Rosenkrans, Ginger 2007). When the number of impressions is chosen, the cost is calculated by the Cost Per Thousand Exposure (CPM) model; and the revenue is calculated by the Revenue Per Thousand (RPM) metric (Hoffman & Novak 2000). The CPM model has commonly been used for many traditional media, such as television and newspapers, and has also been adopted for online advertising. Even though highly ad-averse users are unlikely to respond to ads, the CPM model charges advertisers according to the level of exposure, regardless of ad effectiveness. Impressions, basically, do not track whether users interacted with an ad and definitely do not measure the matching of mobile ads.
pay only when their ads generate clicks. Recently, performance-based ad revenues surpassed the CPM revenues in 2006 and remain increasingly dominant (Lin, M, Ke & Whinston 2012). Click-Through Rate (CTR) is a performance-based metric. It is the ratio of a number of times an advertisement is clicked to the number of advertisement impressions (Schonberg et al. 2000). This metric is one of the oldest methods of evaluating the success of online advertising campaigns and is an appropriate tool for assessing direct marketing objectives. CTR is commonly used to evaluate the effectiveness of banner ads (Kumar, S 2016). Clickthroughs are behavioural and are an accountable measure for online advertising. Click-through metrics are easy to observe and they indicate a behavioural response; clicks indicate an immediate interest in the advertised brand (Chatterjee, Hoffman & Novak 2003; Singh, Dalal & Spears 2005) (Chatterjee, Hoffman, & Novak, 2003; Lawrence 2000; Singh & Dalal 1999). The CTR is considered a good diagnostic metric for direct responses.
The CTR is also a good metric to measure the branding goal in the long run. Hollis (2005) suggests that the two paradigms, i.e., branding and direct response, are not contradictory but they are in fact complementary and that the applicability of either model depends not only on the intent of the advertiser but also the mindset of the audience. It can thus be argued that the two objectives are not mutually exclusive, yet, at a conceptual level, how the advertising budget should be prioritized is usually a matter of debate. Kohavi et al. (2009) argue that long-term goals should be part of the direct response. For example, when ads are plastered over a page, they hurt the user experience, so a good direct response should include a penalty term of usage of real-estate for ads that are not clicked, and/or should directly measure repeat visits and abandonment. Similarly, delayed conversion metrics should already count for a lag from the time a user is exposed to something and take action. Miller, S (2006) and Quarto-von Tivadar (2006) called them latent conversions (Miller 2006; Quarto-von Tivadar 2006). According to Kohavi et al. (2009), coming up with a good metric is hard, but what is the alternative? The key point here is to recognize this limitation, but avoid throwing the baby out with the bathwater.
Goals Demand-side (Advertisers) Supply-side (Publishers) Best match
Impressions Cost Per Impression (CPM) Revenue Per Impression (RPM) CTR (long term) Clicks Cost Per Click (CPC) Revenue Per Click (RPC) CTR (short term) Table 2: CTR as the common metric to measure advertising goals
In practice, behavioural campaigns seem to be especially popular in the online arena. It is estimated that behavioural advertising accounts for a larger amount of all ad dollars spent online. In 2017, more than 62% of the total display advertising revenues were measured by CTR and 4% were measured by both CTR and CPM/RPM (IAB 2017). Apparently, compared with ad impression, ad click has become the most important indicator of online advertising effectiveness. Improving the outcome metric CTR or the ad click performance is to enhance the advertising effectiveness for all participants as shown in Table 2. A better click-through rate, directly and indirectly, means a better ad relevance (users’ goal), a better direct response (advertisers’ goal) and higher revenue (ad networks and publishers’ goal). Most advertising research assumes that the effectiveness of online ads depends on their benefits for individual
3.4
Mobile In-App Advertising Factors
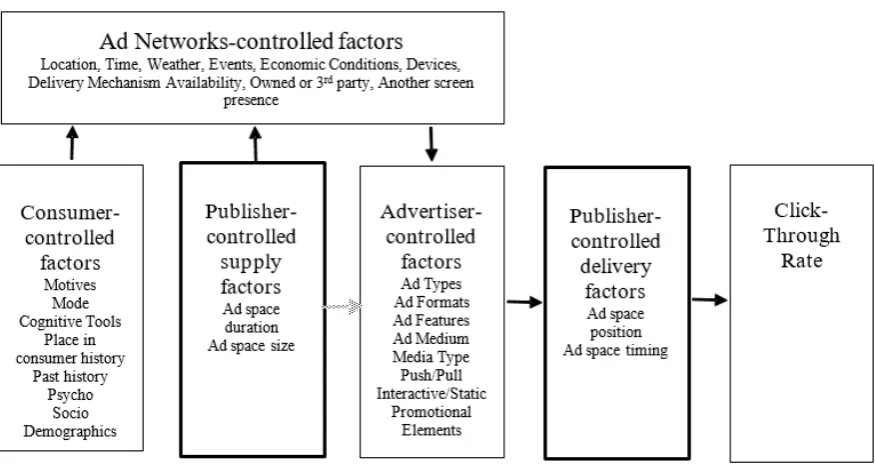
Factors that affects the mobile in-app advertising as well as enhances the click-through rate of mobile in-app advertising can be categorized into three groups (Chen, P-T & Hsieh 2011): ad characteristics (brand, price, informativeness, entertainment, etc.), user behaviours (age, gender, interest, preference, activity history, etc.) and context (time, location, weather, technology, etc.) or three-factor components: stimuli characteristics, personal characteristics, and advertising context (De Pelsmacker, Geuens & Anckaert 2002). Grewal, Bart, Spann and Zubcsek (2016) grouped those factors into ad elements, consumer and context factors. Those three groups are correspondingly controlled to the three participants: advertisers, consumers and ad networks. The Ad Elements in the MAEF are elements that characterize the look and feel of an ad and can be referred to as design characteristics, which are controlled by the advertisers. The component ‘consumer’ contains information about the consumer. Besides the information of the current state of the consumer in the ‘customer journey‘, it also contains information about the history of the consumer and possibly demographic information, which are related to consumers (Brakenhoff & Spruit 2017). The context component contains factors relating to the environment, such as location, time, weather, events, and technology such as the size of the screen and the location (website or app) they come from. In addition to the demographic and contextual targeting, advertisers greatly enjoy behavioural targeting in RTB (Choi et al. 2017). The contextual factors are controlled by ad networks/exchanges (Broder et al. 2007).
3.4.1 Advertisers-controlled factors
2016). Another related study by Lim, Tan and Jnr Nwonwu (2013) revealed that mobile users better recall image banner ads than text ones and more likely to perceive large image banner ad as app content. Certain aspects related to the specific format of the ad can have an impact on its effectiveness such as the type of ad (Grigorovici & Constantin 2004). Li, Y-W, Yang and Liang (2015) found out that both website interactivity and promotional methods can enhance consumer attitudes, but price discount is effective only when the brand perception is functional but not effective when the brand image is symbolic. Appendices B, C and D listed out several ad elements specified in the Interactive Advertising Model (Rodgers & Thorson 2000), Online Behavior Model (Boerman, Kruikemeier & Zuiderveen Borgesius 2017) and Mobile Advertising Effective Framework (Grewal, Bart, Spann & Zubcsek 2016) respectively. Nowadays, advertisers have many options to design their ads and directly improve the performance-based effectiveness of their mobile in-app advertising campaigns.
3.4.2 Consumers-controlled factors
out that when individuals engage in behaviours that are habitual for them, they use simplified decision rules, which results in enacting the same behaviours as in the past. Previous behaviours, in turn, seem to be an important predictor of future behaviour (Ouellette & Wood 1998).
Understanding the role of consumer information, some of the social platforms enable advertisers to target ads using consumers' social profiles (Bakshy et al. 2012). New Internet technologies provide the possibility of automated tracking of consumers' Internet behaviour. Such tracking is used to create user profiles for the purpose of displaying advertisements that fit the interest of these individuals (Goldfarb & Tucker 2011; McDonald & Cranor 2010). Personalization is a customer-oriented marketing strategy that aims to deliver the right content to the right person at the right time, to maximize business opportunities (Tam & Ho 2006). The types of information used included age, gender, location (Aguirre, E et al. 2015), education level (Tucker 2014), interests (Aguirre, E et al. 2015), online shopping behaviour (Bleier & Eisenbeiss 2015a), and search history (Doorn & Hoekstra 2013). Their findings suggest that the level of personalization influences consumer-related factors, such as feelings of intrusiveness (Doorn & Hoekstra 2013), feelings of vulnerability, the ad’s perceived usefulness, reactance, and privacy concerns (Bleier & Eisenbeiss 2015a). The level of personalization also influences the outcomes, such as click-through rates (Aguirre, E et al. 2015). Appendix B and D listed the factors controlled by consumers according to Interactive Advertising Model (Rodgers & Thorson 2000) and Mobile Advertising Effective Framework (Grewal, Bart, Spann & Zubcsek 2016) respectively. Nowadays, advertisers have many consumer targeting options to control and improve the performance-based effectiveness of their mobile in-app advertising campaigns.
3.4.3 Ad networks-controlled factors
Ad networks facilitate the programmatic and real-time buying and selling of advertisements (Choi et al. 2017; Laudon & Traver 2018). Programmatic advertising delivers dynamic content to users based on their location, time and so on (Kumar, V & Gupta 2016). In general, “context” is referred to as the editorial medium environment of an advertisement (Moorman 2003). In the words of Norris and Colman (1993), "the same source delivering the same message to the same audience on separate occasions might produce different effects depending on the differing programming or editorial contexts in which the message appears”. Instead of displaying the same ads to everyone, different ads are shown with regard to the geography, language, device and other characteristics of visitors, to maximize the utilization of advertising opportunities. “Context” refers to both the physical and social environments, which can be paraphrased as “situation”. Advertisers can make use of the context of user actions and their personal information in order to tailor adverts to their demographic and taste, so as to maximise the number of click-throughs received for each ad and subsequently the revenue obtained (Belk 1975).
context. The receiver context can be described as the situational circumstances in which a person is exposed to an advertisement. This includes the person's physical environment, the social environment, the time frame, and the mental state a person is in prior to exposure to the medium content (Moorman 2003). The medium context concerns with the environment of the ad provided by the vehicle carrying it, such as a television program, an issue of a magazine or an Internet site (Pieters & Raaij 1992). Another distinction can be made between an editorial context and commercial context. Studies on commercial context have predominantly concentrated on the effect of the amount and nature of other commercial messages in the environment of an ad, referred to as clutter and competitive clutter (Moorman 2003). It has been shown that as the number of other ads in the environment of the target ad increases the effectiveness of the target add decreases, especially when the other ads are directly competitive. On the other hand, knowledge about the effect of editorial context is more valuable for media planners since they are only provided with information about the editorial context, while information about the commercial context is not given in advance. This makes it difficult to take the effect of other advertisements into account when making media planning decisions (Kent 1993, 1995).
targeting options to control and improve the performance-based effectiveness of their mobile in-app advertising campaigns.
This section presented an overview of the mobile in-app advertising processes, participants, outcome metrics and factors. It is noticeable that there are four participants involved in mobile in-app advertising, while there are only three components of factors being explored in previous studies. It is also noted the lack of an integrated effectiveness framework, which is built around a common goal of all participants. The knowledge vacuum and research gaps identified within the discussion pointed to further actions in the present study. Theoretical and empirical literature in regard to the publishers-controlled factors gap and the integrated effectiveness framework gap are discussed in Section 4 and 5 respectively.
4
Publishers-controlled Factors and Interactions
The previous literature basically only includes factors controlled by advertisers, users and ad networks, while there are actually four participants. The role of publishers and their controlled factors are not included in previous effectiveness frameworks and have not been fully explored in the advertising effectiveness studies. Due to the lack of academic materials in the field, the present study will also bring in academic literature from other types of advertising and also literature from practice.
4.1
Publishers-controlled Factors
As shown in Section 3.1, from a publisher standpoint, any mobile in-app advertising ad serving process can be broken down to ad space supply process and ad space delivery one. By supplying the ad space with predefined and relevant characteristics, the publisher could significantly enhance the effectiveness of mobile in-app advertising. The question is what are those ad space characteristics?
'IAB New Standard Ad Unit Portfolio' 2017) stated that ads/ad spaces could have two characteristics: duration and size. That means publishers can control how long they want the ads last on their apps regardless of how long those ads are designed by the advertisers. They can do that by setting the duration for their ad spaces. When the publisher supplies an ad space with a predefined duration or a predefined size, only ads with those elements are selected to be provided and displayed. However, while measurement guidelines have existed for other forms of online advertising, mobility has its own special set of challenges. For instance, on TV or on websites, there are fairly standard expectations from marketers about what constitutes a "view" of an ad. On smartphones, it's a little less certain. We're not at a point yet where we have a clear and fast definition on viewability. Is it where half the ad is viewable for a couple of seconds, or does it need to be the entire ad?" (Schick, 2013). Furthermore,
advertising on an app is different than advertising on TV and radio because ads on an app are
usually placed alongside the content whereas ads on TV and radio appear instead of the content.
reasoned that these two factors increase the complexity of an ad and hence have a negative effect on the viewer’s attitude towards and response to the banner. Chandon, Chtourou and Fortin (2003) and Lohtia, Donthu and Hershberger (2003) concluded that animation improved click-through rates. On the other hand, Burke et al. (2005) suggested that animated banners may be more difficult to remember than static ones. Goldstein, McAfee and Suri (2011) found that displaying two shorter ads results in more total recollection than displaying one longer ad of twice the duration. Studies about the impact of ad duration on the advertising effectiveness actually deliver mixed results in the context of web advertising. Some research could not point out if recollection relates to click-through rates. In most cases, current monetization strategies do not explicitly consider time as a resource to be optimized (Sun, et al, 2017).
All the mentioned academic and practitioner literature has pointed out that the ad space duration is not fully studied in the past but could be a factor that can strongly impact the click-through rate of mobile in-app advertising. This study, therefore, hypothesized that:
Hypothesis 1: The publishers-controlled supply factor: ad space duration, has a significantly strong impact on the click-through rate of mobile in-app advertising
Similar to the ad space duration, publishers can set the size of their ad spaces ('IAB New Standard Ad Unit Portfolio’ 2017). When the publisher supplies an ad space with a predefined ad size, only ads with that element are selected to be provided and displayed. By supplying the ad space with predefined and relevant characteristics, the publisher could significantly enhance the click-through rate. Conventional industry wisdom has maintained that large banner advertisements will receive more viewer attention as measured by clicks, supporting past research finding (Marx 1996). The success of larger advertisements to secure attention also has an impact on viewer impression of brand quality. A larger advertisement can imply a higher level of advertising cost and effort that the viewer equates with a higher level of brand credibility and success. With regard to banner advertisements, where a click leads the viewer to another location, this may have a positive impact on viewers’ impressions and site expectations, resulting in increased viewer response, i.e., clicks. Baltas (2003) also found that bigger ads are more effective in attracting attention and (hence more likely to) trigger response. Chandon, Chtourou and Fortin (2003) found positive interactions on five banner sizes, although no significant difference between the two bigger sizes.
All the mentioned academic and practitioner literature has pointed out that the ad space size is not fully studied in the past but could be a factor that can strongly impact the click-through rate of mobile in-app advertising. This study, therefore, hypothesized that:
Hypothesis 2: The publishers-controlled supply factor: ad space size, has a significantly strong impact on the click-through rate of mobile in-app advertising
Besides supplying ad spaces for bidding, the publisher is also the one who controls the delivery of ad impressions. After the ads have been selected by the advertiser and the ad network, the publisher will have full control on how to deliver them to the user. The publishers can control how to position the ads on their applications and how to schedule them. Interactive Advertising Bureau recommends ad positions to be top or bottom of the screen and sometimes in the middle of page sections. They also recommend ad scheduling to be before, in between or after the primary content experience ('IAB New Standard Ad Unit Portfolio’ 2017). The publishers-related delivery factors are shown as being critical in the ad serving process that will then enhance the click-through rate of mobile in-app advertising.
There are many studies on scheduling and positioning ads on a website, pioneering by Adler, Gibbons and Matias (2002), Nakamura and Abe (2005) and Kumar, Subodha, Jacob and Sriskandarajah (2006). In websites, ads can be placed on top, at the bottom, in the middle of the screen or in relation with other contents (Djamasbi, Hall-Phillips & Yang 2013). Prominent brand placements (e.g. large ads, central ads) seem to be better in capturing the player’s attention, resulting in a positive effect on brand awareness (Jeong & Biocca 2012; Lee, M & Faber 2007; Schneider, Systems & Cornwell 2005). It was found that banner advertisements at the top of the webpage were more often viewed (Josephson 2004; Sundar & Kalyanaraman 2004).
Herrewijn and Poels (2018) claimed that the spatial position is actually the most important placement characteristic. Agarwal, Hosanagar and Smith (2011) evaluated the impact of ad placement on revenues and profits generated from a sponsored search. The authors measure the impact of ad placement on both click-through and conversion rates. They find that while the click-through rate decreases with the position, and contrary to the conventional wisdom in the industry, the topmost position is not necessarily the revenue or profit-maximizing position. They help correct a significant misunderstanding among advertisers regarding the value of the top position. Ansari and Mela (2003) find that the higher position of links in an e-mail campaign can lead to a higher probability of clicking. Johnson, EJ et al. (2004) find that consumers searched fewer than two stores during a typical search session. Similarly, Brynjolfsson, Dick and Smith (2010) find that only 9% of shopbot users select offers beyond the first page. In general, because of the cognitive costs associated with evaluating alternatives, consumers often focus on a small set of results (Montgomery, Hosanagar & Clay 2004). Those research have shown the importance of position in search advertising. Does that apply to mobile app advertising as well? Until we could find out the answer, in the meantime, many publishers simply display some banner ads and never consider how effective the placement of those ads is (Oak 2008). The question of optimizing mobile advertising placements remains open (Grewal, Bart, Spann & Zubcsek 2016). That led to the following hypothesis:
Ads can also be scheduled to be displayed before, after or in between sessions (Chatterjee, Hoffman & Novak 2003; Kumar, S., Dawande & Mookerjee 2007; Sun 2017). With different delivery schemes like that, the click-through rate could be significantly different. In online search advertising, Hoque and Lohse (1999) found that consumers are more likely to choose advertisements near the beginning of an online directory than they are when using paper directories. Weingarten and Berger (2017) studied how temporal location—that is, whether events or experiences occurred in the past, present or future—affects word of mouth. Bleier and Eisenbeiss (2015b) highlighted the importance of the interplay of what, when and where,
aka scheduling. The first seconds of exposure caused a steep increase in the memory for an ad, and further exposure time had a smaller, albeit still increasing the impact on recollection. Unlike broadcast networks, mobile app publishers are able to observe the traffic to their websites and therefore can dynamically plan a strategy to deliver impressions (Roels & Fridgeirsdottir 2009). Nakamura and Abe (2005) developed an LP-based algorithm to schedule banner ads, where they presented three features that each ad was associated with; time of day that the ads were preferred to be viewed (e.g. the afternoon), page category (e.g. sports) and the number of impressions. The features were then used to determine the optimal ad time and location that maximises overall revenue, rather than relying solely on the CTR of an individual ad. Their strategy showed an improvement over greedy and random methods. Trope and Liberman (2003) found out that the temporal distance to objects or events alters the way in
which they are processed. Sahni (2015) conducted a field experiment on a restaurant search
website. The key result of their work is that increasing the time between exposures, up to two weeks, increases the probability of a purchasing event. Do that imply a direct response also? Goldstein, McAfee and Suri (2015) claimed that there is no guidance to publishers as to how ads should be scheduled. (Goldstein, McAfee & Suri 2015). King (2017) recently called publishers to take back control of the inventory and to remind that timing is just as important as audience targeting. In line with these findings, the present study hypothesized that:
Hypothesis 4: The publishers-controlled delivery factor: ad space timing, has a significantly strong impact on the click-through rate of mobile in-app advertising
4.2
Publishers-controlled Interactions
Firstly, in the MAEF, there are ten context factors listed out, including Location, Time, Weather, Events, Economic Conditions, Devices, Delivery Mechanism Availability, Owned or 3rd party, Another Screen presence. About Location, Goh, Chu and Wu (2015) further categorized it as area, city, and country. Goh, Chu and Wu (2015) investigated the attributes of province location, mobile service plan (pre/post paid) and indicators of last digits towards the advertising performance goals. The research guided a link between the advertising response and the information search. Luo et al. (2014) found out that mobile ads that match users' logical location are more effective. As the location is confirmed as a contextual factor that has a significant strong impact on the effectiveness of online advertising in previous studies, the present study hypothesized that:
Hypothesis 5: The impact of location on the click-through rate of mobile in-app advertising is strongly moderated by the publishers-controlled factors
Similarly, the time has been considered as an important factor that could affect mobile advertising effectiveness. For example, Li, Y (2014) discovered that most of Twitter tweets are posted from 10:00 am to 12:00 am at midnight with a peak at 9:00 pm. The Twitter users are also found to have more activities during weekends than weekdays (Li, Y 2014). All of the research showed the different level of activities over weekdays. Similarly, Baker, Fang and Luo (2014) demonstrated that the effectiveness of advertisements varies with the time of day. Different time of day associated with different outcomes as shown in a study by Luo et al. (2014). Not only the time of day, but the day of the week is also considered as an important factor. According to 'Digital Marketing Trends in the Education Market' 2018) for their clients, the optimal days to send email to continue to be during the business week on Tuesday, Wednesday, and Thursday for both the K-12 and Higher Ed markets. Open rates for the K-12 market were highest for emails delivered on Thursdays, while open rates for the Higher Ed market were highest on Wednesdays. Similarly, Tuesday and Friday are the best days when maximum India Internet Users Open and Click on the email communications sent to them ('Annual State of Email Marketing in India’ 2015). In their report, Tuesday is the day when they see maximum engagement rates for email open rates. As time is confirmed as a contextual factor that has a significant strong impact on the effectiveness of online advertising in previous studies, the present study hypothesized that:
Hypothesis 6: The impact of time on the click-through rate of mobile in-app advertising is strongly moderated by the publishers-controlled factors
core and peripheral information (Muylle, Moenaert & Despontin 1999). A study by Zorn et al. (2012) showed that different websites have different users. Users on one social networking site, myspace.no, preferred animated ads but users of the other social networking site, ebuddy, preferred static ads. For surf sites, animated ads worked significantly better than static ads. Yet, myspace.no accounted for 96% of all impressions on surf sites and English static ads worked best for the second surf site, ebuddy.no. CTRs for static ads and animated ads had an insignificant difference in search sites. Advertisements placed on different apps could have different results as shown in the study of Brakenhoff and Spruit (2017). As app design is confirmed as a factor that has a significant strong impact on the effectiveness of online advertising in previous studies, the present study hypothesized that:
Hypothesis 7: The impact of ad medium on the click-through rate of mobile in-app advertising is strongly moderated by the publishers-controlled factors
Grewal, Bart, Spann and Zubcsek (2016) distinguished four different ad types: static, dynamic, interactive, and ads containing a video. In the MAEF the creative attributes are indicated as interactive/static. The type of creative in an ad can be important regarding how inviting the ad is for interaction. According to Edizel, Mantrach and Bai (2017), many advertisers have begun to implement animated banners to deliver a progressive and sequential image. It is well known that television is one of the most intrusive, involving media forms because of its ability to use moving images. When banners use animation, they also take on the character of television advertisements, and this may suggest that animated banner advertisements will attract more attention and hence be clicked more (Wegert 2002). Studies of the side-by-side performance of advertisements for different companies conducted by ACNielsen suggest that animation increases click rate (Briggs 2001). Based on their experiment, Li, H and Bukovac (1999) illustrate that animation increases response times and recall of banner advertisements. Ad interactivity has a significant impact on effectiveness. However, most of the ads today are still static, and there are static text and static image. Lim, Tan and Jnr Nwonwu (2013) revealed that mobile users better recall static image banner ads than static text ones and more likely to perceive large image banner ad as app content. As ad type has been confirmed as a factor that has a significant strong impact on the effectiveness of online advertising in previous studies, this study hypothesized that:
Hypothesis 8: The impact of ad type on the click-through rate of mobile in-app advertising is strongly moderated by the publishers-controlled factors
In this section, four publishers-controlled factors were identified. Their main and interactive effects will be evaluated accordingly in the present study. Those constructs and relationships will be part of an integrated effective framework, which will be presented in Section 5.
5
An Integrated Effectiveness Framework
advertising effectiveness. One of the first models are the Defining Advertising Goals for Measured Advertising Results (DAGMAR). The model assumes that advertising works in the sequence of awareness, comprehension, conviction and action (Scholten 1996). The process was also thought to be largely inevitable. That is, if the first was established, others would follow in their natural order—with some help along the way, of course, by the advertiser (Li, H & Leckenby 2004). Hierarchy of effect model basically categorizing elements into three categories: cognition, affection and behaviour. However, the internet introduces an additional dimension – alienation (subject’s estrangement from its community, society. So, the internet is an active media and moving consumer to the role of an active receiver from being a passive
receiver (Davidavičienė 2012).