PARAMETRIC STUDY FOR E-SHAPED MICROSTRIP PATCH ANTENNA
Kim Huat Yeap1, Widad Ismail1, Soon Leng Yap2, Kim Ho Yeap3
1
Auto-ID Laboratory, School of Electrical & Electronic Engineering, Universiti Sains Malaysia, Engineering Campus, Seberang Perai Selatan, 14300 Nibong Tebal, Penang, Malaysia.
2 Motorola Solutions (M) Sdn. Bhd., Innoplex, No. 2A, Medan Bayan Lepas, Bayan Lepas Technoplex, Industrial
Park Mukim 12, S.W.D., 11900 Bayan Lepas, Pulau Pinang, Malaysia.
3
Dept. of Electronic Engineering, Faculty of Engineering and Green Technology, Universiti Tunku Abdul Rahman, Jalan Universiti, Bandar Barat, 31900 Kampar, Perak, Malaysia.
Received: 28 Apr 2016 Revised : 28 Nov 2016 Accepted: 29 Nov 2016
ABSTRACT The 2.4-GHz ISM band is extensively adopted in wireless system networks. However, its band coverage depends on different country regulations. This paper presents an E-shaped patch antenna that operates in this ISM band and supports a dual resonance of 2.4 GHz and 2.5 GHz. A parametric study of the antenna is conducted by varying the dimensions of its parameters in sequential accordance and the effect on its performance is analyzed. The result provides a comprehensive guidance for the design and optimization of the antenna. It also facilitates the adjustment of its resonant frequencies to comply with the respective country regulation.
ABSTRAK Jalur ISM 2.4 GHz dipakai secara meluas dalam rangkaian sistem tanpa wayar. Akan tetapi, liputan jalur ini bergantung pada peraturan-peraturan negara yang berlainan. Kertas ini menyampaikan sebuah antena tampalan yang beroperasi dalam jalur ISM dan menopang dwi resonans pada 2.4 GHz dan 2.5 GHz. Kajian parametrik pada antena ini telah dikendalikan dengan mengubahkan dimensi parameternya mengikut urutan dan kesan pada prestasinya dianalisiskan. Keputusannya menyediakan suatu panduan yang menyeluruh bagi reka bentuk dan pengoptimuman antena ini. Ia juga mempermudahkan pelarasan frekuensi resonansnya agar mematuhi peraturan negara masing-masing.
Keywords: ISM band, E-shaped, microstrip patch antenna, parametric study, resonant frequencies
1. INTRODUCTION
In recent years, research works pertaining to the E-shaped microstrip patch antenna have been widely conducted, among which are listed in (Ang & Chung, 2007; Bayat, 2012; Chen et al., 2010; Ghannay & Samet, 2009; Islam et al., 2009a; Islam et al., 2009b; Jain et al., 2011; Jalali et al., 2014; Khidre et al., 2010; Pandey & Vishvakarma, 2007; Razzaqi et al., 2013, Saha et al., 2013; Yang et al., 2001). This reactively-loaded antenna exhibits dual-resonance on a single radiating structure, thereby omitting the need of separate antennas to support two different bands. Besides, it also renders antenna size reduction as well as bandwidth
enhancement. This ultimately contributes to system compactness and cost effectiveness.
center arm are varied whereas in (Khidre et al., 2010), the dimension of the inset slots is varied along with the position of the feed point. (Jain et al., 2011) and (Jalali et al., 2014) conducted a brief study by only varying the dimension of the center arm and the length of the patch, respectively. On the other hand, (Razzaqi et al., 2013) presents a much detailed study by not only varying the dimensions of the inset slots and center arm, but also the width of the side arm as well as the position of its feed point. To the best of knowledge, it is noted that a full parametric study on the E-shaped antenna by varying every dimension within the geometry is not available in documentation. Yet, such study is in fact imperative, as each dimension is structurally inter-related and its surface current is continuously distributed throughout the patch as a whole.
In view of this fact, a comprehensive parametric study on the E-shaped microstrip patch antenna that operates in the 2.4-GHz Industrial, Scientific and Medical (ISM) band is presented in this paper. The 2.4-GHz ISM band is part of the radio frequency (RF) spectrum internationally reserved for research, industrial usages and for medical devices (International Telecommunication Union, 1947). It is governed by the International Telecommunication Union – Radio (ITU-R) under the IEEE 802.11b/g/n standard (IEEE Computer Society, 2012). Due to the advantage of having license exemption in several major applications, this band has been extensively adopted in
wireless technology mediums. These include Wireless Fidelity (Wi-Fi) networks, Bluetooth technology (Nazabal et al., 2012), video applications, RF identification devices (RFID), as well as microwave ovens and sulphur plasma lightings. Its usages span from 2.4 to 2.5 GHz, depending on country specific regulations (Coleman & Westcott, 2012). In Japan, for instance, its allocated spectrum is from 2.471 to 2.497 GHz while in the US and most European countries, the allowable bandwidth ranges from 2.4 to 2.4835 GHz. The relevant frequency allocation band for several countries is listed out in Table 1 (Zyren & Petrick, 1999).
In this paper, the proposed E-shaped patch design resonates at both 2.4 GHz and 2.5 GHz, so as to cover the entire 2.4-GHz ISM band during its study. It is a multiple-input and multiple-output (MIMO) antenna that features three excitation ports to support multiple applications simultaneously. The center arm port resonates at 2.5 GHz whereas both the side arm ports resonate at 2.4 GHz. An extensive study is conducted by systematically varying its geometrical parameters and the effect on its performance is analyzed. The effort is aimed at determining the relevance of the antenna resonance with its geometry. By gaining deeper insight on the resonance tendency, this study realizes a convenient way of tuning the antenna resonances to accommodate it into applications that comply with the respective country’s permissible range.
Table 1. Frequency allocations at 2.4-GHz ISM band (Zyren & Petrick, 1999).
Country Allocated Spectrum
US 2.4 GHz – 2.4835 GHz
Japan 2.471 GHz – 2.497 GHz France 2.4465 GHz – 2.4835 GHz
2. ANTENNA DESIGN
2.1 Overview of Rectangular Patch
Antenna
The rectangular microstrip patch antenna could be visualized as two radiating slots separated by a transmission line (Munson, 1974). Its electric field propagates in a nonhomogeneous structure, whereby the
major part of it is concentrated in the substrate while the remaining part resides in free space, normally air. Due to the phase difference in air and substrate, the transmission line operates in quasi transverse electromagnetic (quasi-TEM) mode. Hence, an effective dielectric constant (εreff) is introduced to account for the
fringing fields’ effect
2 1 12 1 2 1 2 1 W h r r
reff (1)
where εr is the dielectric permittivity, h is
the height of the substrate, and W is the width of the patch. εreff is found slightly
lower than εr as the fringing fields around
the periphery of the patch are not confined within the dielectric substrate alone but also spread into the air surroundings.
To operate in the transverse magnetic (TM) mode and by accounting for the fringing effects, the length of the patch is electrically longer than its physical dimension (L). L could be calculated by (Hammerstad, 1975; Zurcher & Gardiol, 1995)
L
f
v
L
reff
r
o
2
2
(2)
8
0
258
0
264
0
3
0
412
0
.
h
W
.
.
h
W
.
h
.
L
r r (3)where ∆L is the fringing length at one edge of the patch and its width (W) is expressed as (Kumar & Gupta, 1985)
1
2
2
where vo is the speed of light in free space
(3×1011 mm/s) while fr is the resonant
frequency of the antenna.
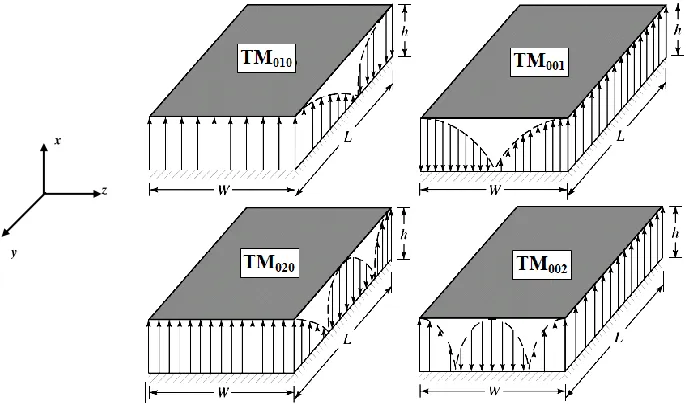
The rectangular patch antenna field configuration differs with respect to its dimensions, as shown in Figure 1 (Balanis, 2005). When L>W>h, the dominant mode is TM010. When L>W>
2
L
>h and L>
2
L
>W>h, its second order mode is TM001 and TM020,
respectively. Similarly, when W>L>h, its dominant mode is TM001 and when
W>
2
W
>L>h, its second order mode is TM002.
2.2 Overview of E-Shaped Patch
Antenna
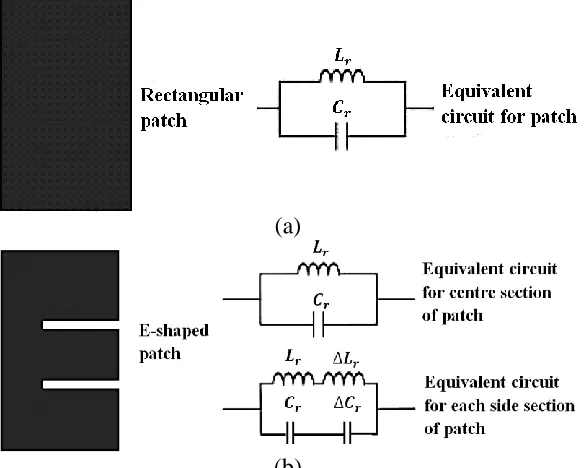
The E-shaped patch antenna is electrically loaded by inserting slots on a rectangular patch structure to tune its dual resonance effect. This could be represented by two inductor-capacitor (LC) tank circuits (Lee & Chen, 1997). Its first resonance is exhibited by the original rectangular patch while its second resonance is caused by the slots then
introduced. Figure 2(a) shows a rectangular patch that is represented by a single LC circuit, where current flows from the feeding point to both edges of the patch. The inductance (Lr) is attributed to the current
path length while the capacitance (Cr) is
mainly subjected to the sandwich-like structure of the substrate bounded by the patch and ground layers.
In Figure 2(b), two parallel slots are incorporated into the design, impacting a change of resonance (Ao & Xiang, 2013). On the center of the patch, the current flows like the initial design, and hence it is modeled exactly as the original LC circuit. However at the sides of the patch, its current circumnavigates through the slots and the distance of its current path is increased. The effect of the increased path can be modeled as an additional series inductance (ΔLr)
(Kadu et al., 2012) while the slot inserted between the center and side of the patch results in an additional parallel capacitance (ΔCr), hence, causing the side of the patch to
resonate at a lower frequency (Patel & Kosta, 2011).
Figure 1. Different field configurations for a rectangular patch (Balanis, 2005).
y x
(a)
(b)
Figure 2. LC circuit of (a) rectangular patch and (b) E-shaped patch antenna (Lee & Chen, 1997).
2.3 Proposed E-Shaped Patch
Antenna
The proposed E-shaped patch antenna is shown in Figure 3. It is segmented into four sections, namely the dominant section (Sdominant), the center
section (Scenter), and two side sections (Sside).
In strict principle however, it is legitimately less appropriate to segment the antenna with a definite boundary, since the geometries of each section are structurally inter-related and its current is continuously distributed throughout as a whole. The segmentation in this context nevertheless, is solely intended to facilitate its parametric study and analysis.
Sdominant plays the major part in the
design, which is responsible for the overall radiation behaviour of the antenna. It determines the antenna resonance range and field configuration. Sside and Scenter fine-tune
Sdominant to resonate at the desired
frequencies with finer precision. Both these
sections also function as transmission channels to interface the antenna with the external circuitries through its respective feeding point.
The proposed antenna is designed to resonate at 2.5 GHz through Scenter and at 2.4
GHz through Sside. In other words, fr = 2.5
GHz is excited from Port 1 while fr = 2.4
GHz is excited from Port 2 and 3 each, referring to Figure 3. The upshot design simulated using Advanced Design System (ADS) Momentum is shown in Figure 4(a) and 4(b), while its dimensions are listed in Table 2. The patch is then fabricated on a Flame-Retardant level 4 (FR-4) substrate with εr = 4.5 and h = 1.6 mm, as shown in
GHz
.
f
GHz
.
f
,
dB
S
,
S
,
dB
S
r r
4
2
5
2
10
33
22
10
11
(5)
Its measured and simulated |Γ| (in dB) plotted across 2.2 GHz to 2.8 GHz is shown in Figure 5. The notches for both plots simultaneously dip about its respective frequency of interest, that is 2.5 GHz for S11, 2.4 GHz for S22 and S33. With a deviation of less than 4 dB, the simulation results are deemed closely co-related to the physical board performance. Besides, the design exhibits substantial 50 Ω matching at its respective port of interest as evident by the S-parameters response below the red line (10 dB) in the plot. The measured S11 is -16.175 dB at 2.5 GHz, while S22 is -17.497 dB and S33 is -18.592 dB, at 2.4 GHz. From the simulation, S11 is -13.347 dB at 2.5
GHz, while S22 is 16.546 dB and S33 is -16.553 dB, at 2.4 GHz.
It is further observed that at Port 1, the measured 10-dB bandwidth ranges from 2.47 to 2.552 GHz, while at Port 2 from 2.372 to 2.42 GHz and Port 3 from 2.373 to 2.421 GHz. This infers that at Port 1, its bandwidth is 82 MHz while at Port 2 and 3, it is each 48 MHz. On the other hand, the ADS Momentum simulated frequency range covers a bandwidth of 76 MHz from 2.469 to 2.545 GHz at Port 1. At each Port 2 and 3, the simulated bandwidth is 68 MHz, which ranges from 2.361 to 2.429 GHz.
(a) (b) (c)
Figure 4. (a) Top, (b) isometric views of simulated design, and (c) prototype board of E-shaped antenna.
Table 2. Dimensions of E-shaped patch antenna.
Segments
Parameters
Dimensions
S
dominantW
dominant83.00 mm
L
dominant34.00 mm
S
centerW
center12.00 mm
L
center40.00 mm
S
sideW
side20.00 mm
L
side27.00 mm
Slots/Slits
W
slot8.50 mm
W
edge7.00 mm
It is to be noted that the resemblance in response for both S22 and S33 is absolutely non-coincidental. In fact, this manifestation could be well explicated from the dimensions of Sdominant. From Table 2,
Wdominant>
2
ant min do W
>Ldominant>h, whereby
Wdominant and Ldominant is the respective width
and length of Sdominant. The antenna thus
operates in the TM002 mode configuration.
As evident in Figure 1, the field propagation is identical at both ends along the width,
Wdominant. Consequently, with the signals
channeled through Sside’s from both ends of
Wdominant, Port 2 and 3 inherit a similar
degree of output matching.
3. PARAMETRIC STUDY
The parametric study of the proposed antenna is conducted in simulation by
systematically varying the segmented dimensions of each parameter designated in Figure 3. Its corresponsive |Γ| responses (in dB) are studied and discussed.
Figure 5. Reflection coefficient responses for the proposed E-shaped antenna.
(a) (b)
(c)
3.1 Dominant Section (Sdominant)
Wdominant is expanded by every 4 mm from
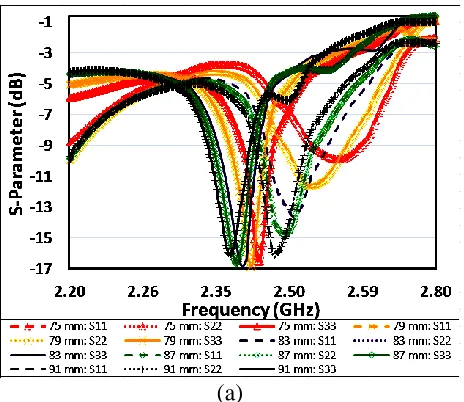
75 mm to 91 mm while the dimensions of the remaining parameters are the same as in Table 2. Its |Γ| responses (in dB) are plotted in Figure 7. As the width expands, a reduction of spacing between both optimal resonances is observed from 127 MHz to 109 MHz, as shown in Figure 7(a). This 18 MHz spacing reduction indicates that both resonances grow closer as Wdominant widens.
At the meantime, the high resonant frequency at Port 1 as well as the low resonant frequency at Port 2 and 3 also decrease. In Figure 7(b), the optimal high resonant frequency at Port 1 decreases from 2.565 GHz to 2.483 GHz with its corresponding S11 decreases much from -9.913 dB to -16.083 dB. This decrease signifies an improvement in the degree of output matching at Port 1. Concurrently, the optimal low resonant frequency at Port 2 and 3, respectively decreases from 2.438 GHz to 2.374 GHz, as mutually displayed in Figure 7(c) and (d). Nevertheless, the S22 and S33 responses are considerably consistent.
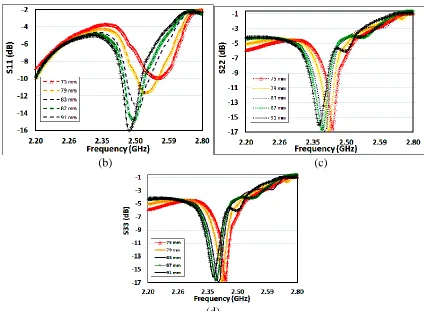
Similarly, Ldominant is varied from 32
mm to 36 mm by an interval of 1 mm while keeping the dimensions of Wdominant and the
rest of the parameters the same as in Table 2. The frequency spacing between the optimal resonances increases notably from 75 MHz to 151 MHz, as shown in Figure 8(a). This spacing increase of 76 MHz simply implies that both frequencies resonate further away from each other as
Ldominant lengthens. In conjunction to this, the
high resonant frequency at Port 1 as well as the low resonant frequency at Port 2 and 3 experience a decrease. In Figure 8(b), the optimal high resonant frequency at Port 1 decreases from 2.558 GHz to 2.465 GHz while in both Figure 8(c) and (d), the optimal low resonant frequency at Port 2 and 3 respectively decreases from 2.483 GHz to 2.314 GHz. Despite the decrease in its resonances, the |Γ| (in dB) at all three ports increase as Ldominant increases. At Port 1, its
optimal S11 increases from 18.9 dB to -11.25 dB while at Port 2, its optimal S22 increases from -20.216 dB to -15.28 dB and at Port 3, its optimal S33 increases from -20.212 dB to -15.282 dB.
(b) (c)
(d)
Figure 7. (a) |Γ| responses (in dB) and (b) S11, (c) S22, (d) S33 responses, as Wdominant varies
from 75 mm to 91 mm.
(b) (c)
(d)
Figure 8. (a) |Γ| responses (in dB) and (b) S11, (c) S22, (d) S33 responses, as Ldominant varies
from 32 mm to 36 mm.
3.2 Side Section (Sside)
The width of Sside (Wside) is expanded by
every 1 mm from 18 mm to 22 mm while the dimensions of the rest of the parameters are maintained as in Table 2. Its corresponding |Γ| responses (in dB) are plotted in Figure 9. As the width expands, a small reduction of spacing between both optimal resonances is observed from 119 MHz to 108 MHz, as shown in Figure 9(a). The spacing reduction of merely 11 MHz indicates that both resonances are slowly tuned closer as Wside widens. Meanwhile, the
resonances at all three ports increase much gradually. In Figure 9(b), the optimal high resonant frequency at Port 1 is almost constant. To be exact, the insignificant increase is only 6 MHz from 2.505 GHz to 2.511 GHz. In Figure 9(c) and (d) respectively, the optimal low resonant
frequency at Port 2 and 3 increases a little from 2.386 GHz to 2.403 GHz. On the other hand, the |Γ| (in dB) at all three ports experience an insignificant increase. At Port 1, its optimal S11 increases from -14.03 dB to -13.333 dB while at Port 2, its optimal S22 increases from -17.274 dB to -16.358 dB and at Port 3, its optimal S33 increases from -17.278 dB to -16.357 dB.
Similarly, the length of Sside (Lside) is
varied from 23 mm to 31 mm by an interval of 2 mm while keeping the dimensions of
Wside and the rest of the parameters the same
as Lside lengthens. In conjunction to this, the
|Γ| (in dB) at all three ports increase. In Figure 10(b), the optimal high resonant frequency at Port 1 decreases from 2.555 GHz to 2.475 GHz but its corresponding S11 increases remarkably from -31.756 dB to -10.158 dB. Meanwhile, Figure 10(c) and
(d) show that the optimal low resonant frequency at each Port 2 and 3 decreases greatly from 2.503 GHz to 2.291 GHz. Its corresponding S22 increases from -20.824 dB to -15.792 dB while its corresponding S33 increases from -20.823 dB to -15.789 dB.
(a)
(b) (c)
(d)
Figure 9. (a) |Γ| responses (in dB) and (b) S11, (c) S22, (d) S33 responses, as Wside varies from
(a)
(b) (c)
(d)
Figure 10. (a) |Γ| responses (in dB) and (b) S11, (c) S22, (d) S33 responses, as Lside varies from
23 mm to 31 mm.
3.3 Center Section (Scenter)
The width of Scenter (Wcenter) is expanded by
every 1 mm from 10 mm to 14 mm. The dimensions of the rest of the parameters remain the same as in Table 2. Its corresponding |Γ| responses (in dB) are
shown in Figure 11. In Figure 11(a), it is observed that both optimal resonances grow closer to each other with spacing from 127 MHz to 109 MHz as Wcenter widens. It is also
2.504 GHz with S11 reduces from -10.076 dB to -18.822dB. On the other hand, Figure 11(c) and (d) indicates that the low resonant frequency at Port 2 and 3 are relatively constant. To be precise, its optimal
resonance increases very little by only 7 MHz from 2.392 GHz to 2.399 GHz, with S22 increases slightly from 17.046 dB to 16.627 dB and S33 from 17.039 dB to -16.626 dB.
(a)
(b) (c)
(d)
Figure 11. (a) |Γ| responses (in dB) and (b) S11, (c) S22, (d) S33 responses, as Wcenter varies
Similarly, the length of Scenter (Lcenter) is
varied from 36 mm to 44 mm by an interval of 2 mm. Wcenter and the other parameters are
maintained the same as in Table 2. The resulted |Γ| response (in dB) plotted in Figure 12(a) displays an evident decrease in frequency spacing between both resonances. As Lcenter lengthens, both optimal resonant
frequencies grow noticeably closer by 190 MHz, from a spacing of 216 MHz to a mere 26 MHz away from each other. At the same
time, the optimal high resonant frequency at Port 1 decreases from 2.604 GHz to 2.423 GHz, as shown in Figure 12(b). Viewing from its |Γ| (in dB) aspect however, the degree of matching at all three ports improves immensely. The optimal S11 reduces from -12.31 dB to -22.594 dB while the optimal S22 reduces from -14.836 dB to -28.009 dB and similarly, the optimal S33 reduces from -14.842 dB to -28.022 dB.
(a)
(b) (c)
(d)
Figure 12. (a) | Γ| responses (in dB) and (b) S11, (c) S22, (d) S33 responses, as Lcenter varies from
3.4 Inset Slot
The width of the slot (Wslot) inset into the
antenna is expanded by every 1 mm from 6.5 mm to 10.5 mm while the dimensions of the remaining parameters are maintained the same as in Table 2. Its |Γ| responses (in dB) are plotted in Figure 13. As Wslot expands,
the spacing between its optimal resonances reduces from 131 MHz to 102 MHz as illustrated in Figure 13(a). The change on the high resonant frequency at Port 1 is relatively minor compared to the low resonant frequency at Port 2 and 3. Precisely at Port 1, the optimal high resonant frequency merely increases by 14 MHz, from 2.503 GHz to 2.517 GHz as shown in Figure 13(b). On the other hand, the increase in the optimal low resonant frequency in Port 2 and 3 appears more obvious, that is by 43 MHz from 2.372 GHz to 2.415 GHz respectively, as shown in Figure 13(c) and
(d). Concurrently, the |Γ| (in dB) at its optimal resonances decrease at all three ports. S11 decreases from 10.397 dB to 20.684 dB while S22 decreases from -13.744 dB to -20.684 dB and S33 decreases from -13.743 dB to -20.672 dB.
Varying Wslot alters the
reactive load on the radiating patch and subsequently affects the perturbation on its surface current. This manifests a conspicuous impact on the bandwidth of the antenna. Thereupon, the response of its 10 dB RL bandwidth is further studied as shown in Figure 14. It appears that the bandwidths exhibited at all three ports increase proportionally as Wslot expands.
Nevertheless, the increase at Port 1 is much substantial in spite of the minor increase in its high resonant frequency. In contrast, the increase in bandwidths exhibited at Port 2 and 3 are less drastic, which is from 51 MHz to 81 MHz, respectively.
(b) (c)
(d)
Figure 13. (a) |Γ| responses (in dB) and (b) S11, (c) S22, (d) S33 responses, as Wslot varies from
6.5 mm to 10.5 mm.
Figure 14. 10 dB RL bandwidth response as Wslot varies from 6.5 mm to 10.5 mm.
4. RESULTS AND DISCUSSION
The summary of the parametric study is depicted in Table 3. It shows the overall changes on the antenna performance when
the dimensions of the E-shaped patch are varied accordingly. Both high and low resonances separate further apart when
Ldominant and Lside increase respectively but
dimensions increase. Increasing Wside tunes
up the low resonant frequency at Port 2 and 3, but increasing either Lcenter or Wcenter tunes
down the high resonant frequency at Port 1. Correspondingly, the resonances at all three ports reduce as either Wdominant or Ldominant
increases. The resonances also reduce as
Lside increases. In conjunction with this,
widening the inset slots increase the low resonant frequency at Port 2 and 3 considerably and increase the high resonant frequency at Port 1 mildly.
Since Sdominant governs the overall
field configuration of the E-shaped patch antenna and Wdominant is inversely
proportional to its resonant frequency as expressed in (4), the decrease in both the resonances is thus reasonably anticipated along with the expansion of Wdominant, as
portrayed in Figure 7. This decrease in resonances could also be analyzed through the field configurations within the cavity model of the patch antenna. With the antenna operating in the TM002 mode, the
distribution of its tangential electric field along the side walls of the cavity is as illustrated in Figure 1. Correspondingly, its electric field (E) and magnetic field (H) components are expressed with reference to the dimensions designated in Figure 1,
, (6a)
, (6b)
, (6c)
where the subscripts x, y, z for E and H
denote its respective x, y, z direction. A002
represents the amplitude coefficient of the TM002 mode whereas z’ represents the field
within the cavity. In conjunction with E and
H, the resonant frequency ( ) at its dominant mode is expressed in terms of the dielectric permittivity (ε) and permeability (μ) as
, (7)
which implies that the dominant resonant frequency is inversely proportional to the width of the patch, Wdominant in this case. It is
therefore sensible to note that the resonances decrease along with the expansion of
Wdominant.
On the other hand, the decrease in both the resonances along with the elongation of Ldominant in Figure 8 agrees
proportionality. On top of this, the increasing trend observed for |Γ| (in dB) albeit the decrease in its resonances, suggests that the degree of mismatches at all three ports tend to intensify as Ldominant
elongates further.
Another interesting observation to be noted is the S11 response in Figure 8(b), when Ldominant is set at 32 mm. A second
lower resonance is observed at 2.224 GHz with S11 of -33.735 dB. This is attributed to the additional series inductance (∆Lr) effect,
which not only influences the Sside, but
throughout the entirety of the antenna. As stated in the E-shaped antenna segmentation, every section is inter-related and its current is continuously distributed throughout. Indeed, when Ldominant is tuned remarkably
short at 32 mm, ∆Lr resulted by the current
circumnavigation around the slot is sufficiently low to produce an obvious second resonance that is closely distanced from its initial resonance. As Ldominant
increases, the second resonance starts to shift lower but distanced much closer to its initial resonance, until to a point that both resonances coupled together into one. It is thus found that only a single resonance is observed in Port 1 for Ldominant of
considerable length, approximately more than 33 mm.
In Figure 9(c) and (d), the gradual changes in terms of resonances and |Γ| (in dB) observed when Wside expands affirm the
role of Sside in tuning the antenna resonances
at Port 2 and 3 with finer precision. On the other hand, elongating Lside increases the
additional series inductance (∆Lr) because
the diversion of surface current around the slots is more intensive. Hence, the low resonant frequency at Port 2 and 3 decrease significantly, as observed in Figure 10(c) and (d). Apart from this, it is also noted that the response observed in Figure 10(b) when
Lside is set at 23 mm is alike to the S11
response observed when Ldominant is set at 32
mm. A second resonant mode at Port 1 is observed at 2.223 GHz with S11 of -31.306 dB. This is again, due to the parasitic ∆Lr,
which tunes a second resonance that is 332 MHz lower than its initial resonant mode. Nevertheless, as Lside increases, both
resonances ultimately couple into one single band.
The responses observed during the variations of the dimension for Scenter is
similar as that for Sside. The insignificant
change in resonances observed during the expansion of Wcenter in Figure 11(b), affirms
the function for Scenter that fine tunes the
antenna resonance at Port 1 with higher accuracy. The elongation of Lcenter
introduces the additional series inductance (∆Lr) to the initial patch inductance (Lr) at
Port 1 due to the extension of its current path. Consequently, this impacted the descent of the optimal high resonance at Port 1, as shown in Figure 12(b). Since the low resonance at Port 2 and 3 are primarily attributed to the current flow circumnavigating around the slots, there is no significant change caused by the variation of Lcenter, as mutually portrayed in
Figure 12(c) and (d). The decrease of |Γ| (in dB) observed as Lcenter is elongated reflects a
sheer contrast to the |Γ| (in dB) responded from the elongation of Ldominant and Lside. Its
effect is therefore useful in counter balancing the mismatches caused.
When expanding Wslot, the high
increase is observed at its low resonant frequency, as depicted in Figure 13(c) and (d). The expansion on Wslot causes Sside and
Scenter parted further away from each other,
distanced by the substrate embraced in
between. The resultant effect is the reduction of the parallel parasitic capacitance (∆Cr).
The logic behind this could be further illustrated base on the fundamental capacitor formulation, with capacitance (C) given as
(8)
where ɛo is the permittivity in free space
(8.854 pF/m), A is the surface area of the co-facing conductive plates, and d denotes the plates separation, which is Wslot in this
context. As such, ∆Cr decreases as Wslot
widens. In response, the low resonant frequency increases proportionally, as depicted in Figure 13(c) and (d). This explication agrees well with the dual-LC circuit model, where the lower resonance is closely associated with ∆Cr.
The increase of the resonant frequencies along with the expansion of Wslot
can also be visualized from the cavity model of the patch antenna. Base on the cavity perturbation theory, when a resonant cavity is perturbed, in this case when the inset slots perturb the rectangular patch to form the E-shaped patch, the electromagnetic (EM) fields inside the cavity change accordingly. This results in the resonant frequency shifts (Jaheen et al., 2016), which is expressed as
(Waldron, 1960)
(9)
where is the change in angular resonant
frequency, is the angular resonant frequency of the original cavity (the angular resonant frequency of the rectangular patch,
in this case), and are the respective
change in and , and are the fields of the original cavity (the basic rectangular
patch antenna, in this case), and are the fields of the perturbed cavity (the E-shaped
patch antenna, in this case), and is the volume of the cavity. Expression (9) simply
implicates that as Wslot widens, the
perturbation caused by the inset slots
intensifies. This leads to the decrease in
and , hence the resonant frequencies increase as observed in Figure 13.
In fact, and the quality factor of
its resonant mode ( ) are intimately related
to the total stored energy ( ) within the cavity, given as (Omar, 2011; Pozar, 2012)
, (10)
where and are the changes in the stored magnetic energy and electric energy,
respectively, and is the average power
loss. It is thus noted that the ( ) is
lessened along with the increase in ’s.
This in turn, explains the increase in bandwidths observed in Figure 14, since the
spectral lines are broadened as is lowered.
Table 3. Summary of parametric study for the E-shaped antenna.
Ports
1
2, 3
Frequency
Spacing
Parameters
|Γ|
f
r|Γ|
f
rWidth ↑
S
dominant↑
↓
NC
↓
↓
S
sideNC NC
NC
↑
↓
S
center↑
↓
NC
NC
↓
Slot
↑
↑
↑
↑
↓
Length
↑
S
dominant↓
↓
↓
↓
↑
S
side↓
↓
↓
↓
↑
S
center↑
↓
↑
NC
↓
Note:
↑ increases
↓ decreases
NC no significant change observed
5. CONCLUSION
In this paper, an E-shaped patch antenna is designed to operate in the 2.4-GHz ISM band. It supports resonances of 2.5 GHz at its center port (Port 1) and 2.4 GHz at its side ports (Port 2, 3). At Port 1, its measured optimal |Γ| (in dB) is -16.2 dB while at Port 2, it is -17.5 dB and at Port 3, it is -18.6 dB. In general, the analysis elucidates the effects contributed by the various dimensional parameters. It provides a comprehensive guide on the design and optimization of the
ACKNOWLEDGEMENTS
The authors would like to thank Auto ID Lab (AIDL), School of Electrical and Electronic Engineering, Universiti Sains Malaysia (USM) for providing the opportunity and support on the research through RUI grant (814241).
REFERENCES
Ang B.-K. & Chung B.-K. (2007). A wideband E-shaped microstrip patch antenna for 5–6 GHz wireless communications. Progress In Electromagnetics Research, 75: 397– 407.
Ao W. & Xiang W.Q. (2013). Analysis and design of E-shaped dual-frequency microstrip antenna based on CPSO algorithm. In: Satapathy S.C., Raju K.S., Mandal J.K. & Bhateja V. (eds.):
Proceedings of the Second International Conference on Computer Science and Electronics Engineering, Hangzhou, 22– 23 March, pp. 3016–3019, Chenai, India: Springer.
Balanis C.A. (2005). Antenna Theory, Analysis and Design, pp. 831, New York, USA: John Wiley and Sons. Bayat A. (2012). Single patch E-shaped
compact microstrip antenna.
International Journal of Modern Engineering Research, 2: 3895–3898.
Chen Y., Yang S. & Nie Z. (2010). Bandwidth enhancement method for low profile E-shaped microstrip patch antennas. IEEE Transactions on Antennas and Propagation, 58: 2442– 2447.
Coleman D.D. & Westcott D.A. (2012).
CWNA: Certified Wireless Network
Administrator Official Study Guide, pp. 192, New York, USA: John Wiley & Sons.
Ghannay N. & Samet A. (2009). E-shaped patch antenna modeling with MoM and RWG basis functions. In: 16th International Conference on Electronics, Circuits, and Systems, Yasmine Hammarmet, 13–16 December, pp. 199– 202, New York, USA: IEEE.
Hammerstad E.O. (1975). Equations for microstrip circuit design. In:
Proceedings of the 5th European Microwave Conference, Hamburg, 1–4 September, pp. 268–272, New York, USA: IEEE.
IEEE Computer Society (2012). Wireless LAN Medium Access Control (MAC) and Physical Layer (PHY) Specifications, pp. 1442–1535, New York, USA: IEEE Standard Association.
International Telecommunication Union (1947). Documents of the International Radio Conference Doc. No. 1-100, pp. 628, Atlantic City, USA: Bureau of the International Telecommunication Union.
Islam M.T., Shakib M.N. & Misran N. (2009a). Broadband E-H shaped microstrip patch antenna for wireless systems. Progress In Electromagnetics Research, 98: 163–173.
Jaheen F., Ovi A.A.N. & Akhi M. (2016). Slot loaded square microstrip patch antenna for dual band operation.
Electrical and Electronic Engineering, 6: 11–17.
Jain N., Nema R., Khare A. & Gour P. (2011). Dual band E-shape microstrip patch antenna on RT DUROID 5880 substrate for pervasive wireless communication. International Journal of Computer Science and Information Technologies, 2: 1075–1081.
Jalali M., Sedghi T. & Shafei S. (2014). Design and implementation of low profile antenna for dual-band applications of using rotated E-shaped conductor-backed plane. The Scientific World Journal, 2014: 1–5.
Kadu M.B., Labade R.P. & Nandgaonkar A.B. (2012). Analysis and designing of E-shape microstrip patch antenna for MIMO application. International Journal of Engineering and Innovative Technology, 1: 67–69.
Khidre A., Lee K.F., Yang F. & Elsherbeni A. (2010). Wideband circularly polarized E-shaped patch antenna for wireless applications. IEEE Antennas and Propagation Magazine, 52: 219– 229.
Kumar G. & Gupta K.C. (1985). Non-radiating edges and four edges gap coupled multiple resonator broadband microstrip antennas. IEEE Transactions on Antennas and Propagation, 33: 173– 178.
Lee K.F. & Chen W. (1997). Advances in Microstrip and Printed Antennas, pp. 53–62, New York, USA: Wiley.
Munson R.E. (1974). Conformal microstrip antennas and microstrip phased arrays.
IEEE Transactions on Antennas and Propagation, 22: 74–78.
Nazabal J.A., Iturri P.L., Azpilicueta L., Falcone F. & Fernandez-Valdivielso C. (2012). Performance analysis of IEEE 802.15.4 compliant wireless devices for heterogeneous indoor home automation environments. International Journal of Antennas and Propagation, 2012: 1–14.
Omar A. (2011). Electromagnetic Scattering and Material Characterization, pp. 7– 10, Norwood, MA: Artech House.
Pandey V.K. & Vishvakarma B.R. (2007). Analysis of an E-shaped patch antenna.
Microwave and Optical Technology Letters, 49: 4–7.
Patel S.K. & Kosta Y.P. (2011). E-shape microstrip patch antenna design for GPS application. In: International Conference on Current Trends in Technology, Gujarat, 8–10 December, pp. 1–4, New York, USA: IEEE.
Pozar D.M. (2012). Microwave Engineering. 4th edition, pp. 306–312, New York, USA: John Wiley and Sons.
Razzaqi A.A., Mustaqim M. & Khawaja B.A. (2013). Wideband E-shaped antenna design for WLAN applications. In: IEEE 9th International Conference on Emerging Technologies, Islamabad, 5–6 Septermber, pp. 1–6, New York, USA: IEEE.
Journal of Science, Engineering and Technology Research, 2: 625–632.
Waldron R.A. (1960). Perturbation theory of resonant cavities. In: Proceedings of the Institution of Electrical Engineers, 22 July, pp. 272–274, London, UK: IET.
Yang F., Zhang X.-X. & Rahmat-Samii Y. (2001). Wide-band E-shaped patch antennas for wireless communications.
IEEE Transactions on Antennas and Propagation, 49: 1094–1100.
Zurcher J.F. & Gardiol F. E. (1995).
Broadband Patch Antennas, Boston, USA: Artech House.