[Hari * et al., 5(5): May, 2018]
ISSN: 2349-5197
Impact Factor: 3.765
I
NTERNATIONAL
J
OURNAL OF
R
ESEARCH
S
CIENCE &
M
ANAGEMENT
QUALITY DESIGN OF BATIK TULIS USING THE TAGUCHI METHOD
Purnomo Hari
*, Lutfianto Saufik & Apsari Ayudyah Eka
*Industrial Engineering Department, Universitas Islam Indonesia, Yogyakarta
Industrial Engineering Department, Universitas Pancasakti, Tegal
Industrial Engineering Department, Universitas Islam Batik Surakarta
DOI: 10.5281/zenodo.1243253
Keywords: Design, Quality, Batik Tulis, Taguchi
Abstract
In the batik industry center of Pemalang, a lack of product quality standards have led to complaints from consumers who do not like the batik products. Products that have been purchased by consumers are returned because of inferior quality. From the initial survey about batik conducted with 30 respondents in Pemalang, it was found that 80% of respondents chose Pekalongan batik rather than Pemalang batik. This is due to customers complaining about the wearing of colors and the use of non-sturdy and uncomfortable materials. The purpose of this study was to determine the characteristics needed for optimal batik product design. The method used was a pure experimental design using the Taguchi method with orthogonal array L27(313). The results of this study suggest that the optimal characteristics of batik are primissima butterfly cloth, coloring using naftol, dyeing for 50 minutes and the process of waxing with a temperature of 700C. The optimum level setting provided a quality enhanced by 1.78 grey scale or 22.22%
Introduction
Indonesia is a country that is famous for small- and medium-sized industries. Small industries are industries that can defend a growing country against a global crisis and have a tremendous positive impact on peoples’ lives [1] Arts and home industries are included in the small industries category. Small industries are effective industries that are able to develop independently. Small companies in rural areas are an important source of increased non-oil exports [2, 3]. One of the small industrial centers that has grown significantly in Indonesia is the batik industry [4, 5]. The batik industry amounts to 48,287 units spread over 17 provinces. It provides a workforce of 792,300 people and contributes to about 30-35% of national exports [6]. According to the Ministry of Industry, in 2016, batik industrial centers had yet to have quality standards for products such as quality of color resistance, fiber wrinklability, and types of fabrics used [7]. This lack of quality standards could become a problem for the Indonesian batik industry regarding global competition and a fundamental problem for batik entrepreneurs in Indonesia.
To improve the quality standards of batik in Indonesia, several studies related to quality have been conducted. Some studies on coloring have shown changes in the quality of fabric dyes and the influence of temperature on the immersion process [8, 9, 10, 11, 12]. Other studies have shown changes in the quality of staining using synthetic dyes [13, 14]. Swamy et al., [15] had find that dyed silk using Madhuca longifolia was fastness properties and possess antibacterial activity. Meanwhile, Roy & Saha [16] found that the color range of natural fibres are very effectively and also very economical. A study of yarn materials showed that yarn materials qualities are ruggedness, maximum tensile strength and corresponding torsional strength [17]. Other studies of quality fabric revealed that mori cloth could improve the performance of batik cloth products while decreasing batik damage by 20% [8, 9]. Compares study of silk sericin In addition to batik quality, the use of eco-friendly materials and technology can attract consumer interest and improve the artist economy [18, 19].
[Hari * et al., 5(5): May, 2018]
ISSN: 2349-5197
Impact Factor: 3.765
I
NTERNATIONAL
J
OURNAL OF
R
ESEARCH
S
CIENCE &
M
ANAGEMENT
Materials and Method
Experiment: The experimental process is based on a predetermined orthogonal array with three setting factor levels and four controlled factors. The process started by soaking the mori in water for one night, then washing it for a ¼ hour and boiled it in kanji or tajin water (rice stew water sometimes mixed with bamboo leaves and a slight amount of limestone). Next, menganji and mengemplong processes were done. The processes of menganji (soak the cloth overnight in clean water so that malam does not seep into the fabric) and mengemplong (hitting the fabric repeatedly so that the surface of the fabric becomes smooth, flat and weak) are done so that the liquid wax scratched onto the cloth will not permeated into the fabric too much. Then a canting tool was used to move the liquid wax, coating the desired design. The aim is that during the dyeing of the material, the portion of the fabric with the wax layer is not exposed to the dyeing solution. After the wax is dry enough, then the cloth is dipped into the dye liquid.
Materials and Methods: This study uses a pure experimental design that identifies the characteristics of batik quality using the Taguchi method consisting of four controlled factors with each factor having three levels. The number of levels and factors available are determined by the number of rows for orthogonal arrays. The appropriate orthogonal arrays for this study are L27(313). At this stage, the Taguchi method is conducted to determine the factors that affect the levels involved in the experiment.
Materials: This research was conducted on batik tulis made with mori primissima cloth. Batik tulis is processed using a canting tool to move the liquid wax on the fabric surface to cover the desired part, so as not to cover the dye. Mori primissima is the most delicate mori. Mori is traded in the form of a roll (piece) with a width of 42 inches, or approximately 106 cm, and a length of 17.5 yards, or about 15.5 m. The wax used is a mixture of elements consisting of gondorukem, mata kucing, paraffin or microwax, and fat or vegetable oil coupled with wax from wasps that can be inscribed onto cloth. The dye used is naftol, which is dissolved in a soda solution (caustic soda), turning into a soluble naftolat in cold water.
Equipment used in this research includes: (1) Form tool materials used to retrieve data tools batik design; 2) A BenQ digital camera to document the batik before and after the experiment and the work process; (3) Batik tulis design for batik design, (4) Computers using SPSS 16.0 for Windows software to analyze the results of the questionnaire and Minitab 14 software for analyzing the Taguchi experimental data; (5) Laboratory apparatus comprised of cup goblets used for stirring a soap liquid for 30 min at a temperature of 40-50˚C with a ratio of 1:30 Vlot, a mixer used as a stirring aid in the cup goblets, a heater used to heat the fabric sample, sewing needle, yarn used as adhesive for sewing cloth on all four sides creating a square measuring 10 x 4 cm, a gray scale used to assess color change, and a staining scale used as a color throwing test after washing.
Taguchi Experimental Design
Determination of Factor Level Settings
The experiments conducted in this study used three-factor level settings that showed high, medium and low levels. The level settings for the factors involved in the experiment are described as follows:
a. Variations of mori fabrics are blue mori primissima, GA mori primissima, and kupu mori primissima. The selection of these three moris was based on the relationship between price and quality.
b. Variations of dye to the threshold are color rapid, natural color, and color naphthol, which at a higher level, are expected to increase the quality of dyeing fastness.
c. Variations in dyeing to staining are 30 minutes, 40 minutes and 50 minutes. d. Variations of wax, or malam, to staining are 600C, 650C, and 700C.
Determination of Orthogonal Array
[Hari * et al., 5(5): May, 2018]
ISSN: 2349-5197
Impact Factor: 3.765
I
NTERNATIONAL
J
OURNAL OF
R
ESEARCH
S
CIENCE &
M
ANAGEMENT
Signal to Noise Ratio (S/N Ratio)
A signal to noise ratio (S/N ratio) acts as a quality indicator, evaluating the effects of changes in a parameter design on the performance of the product. A characteristic of the signal to noise ratio is that it uses “the larger the better (LTB)” concept. This is because it has a continuous and non-negative quality characteristic that has a value of ≤ 0, where the expected target value is something other than 0 or, in other words, has as much value as possible. The signal to noise ratio can be calculated using the formula (Belavendram, 1995):
𝑆𝑁
𝐿𝑇𝐵= −10𝐿𝑜𝑔 [
1𝑛
∑
1 𝑦𝑖2 𝑛 𝑖=1]
Where n is the number of experimental repetitions and Yi is the i-th observational data (i = 1, 2, 3, n).
Results and Discussion
Normality and Homogeneity Tests for Taguchi Experimental Results
The data normality test is intended to show that the sample data is from a normally distributed population. Normality was determined using the Kolmogorov-Smirnov test. Based on the calculation, the value of p for replication 1, 2, 3, and 4 was 0.151, 0.158, 0.158 and 0.158, respectively. These values are all greater than 0.05 (p > 0.05), thus all data is normally distributed. The homogeneity test is meant to test that each group compared has the same variance. Based on the calculation, a p-value of 0.997 was obtained, which is greater than 0.05 (p > 0.05), thus the results of the Taguchi experiments have homogeneous variance.
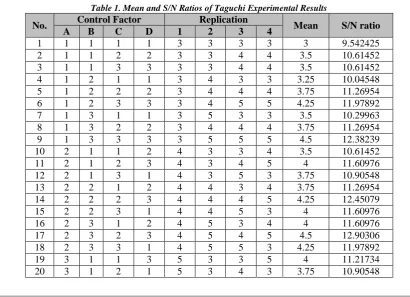
Mean and S/N Ratio of Taguchi Experimental Results
The calculation of mean values to find optimal level settings can minimize the deviation of the average value, while the S/N ratio determines factors that contribute to the reduction of the variance of a quality characteristic. Table 1 shows the results of calculating mean values and S/N ratios. The highest mean value and S/N ratio were in experiment 27, with a mean value of 4.75 and S/N ratio value of 13.40797. The mean values and S/N ratios were then analyzed using analysis of means and analysis of S/N ratios to find optimal setting levels, that is, conditions with high target values and low variance.
Statistical Analysis for Mean Values and S/N Ratios
The Taguchi method uses analysis of means to look for factors that affect the average value of the response. Analysis of means is a method used to find the optimal level setting that can minimize the deviation of the average value.
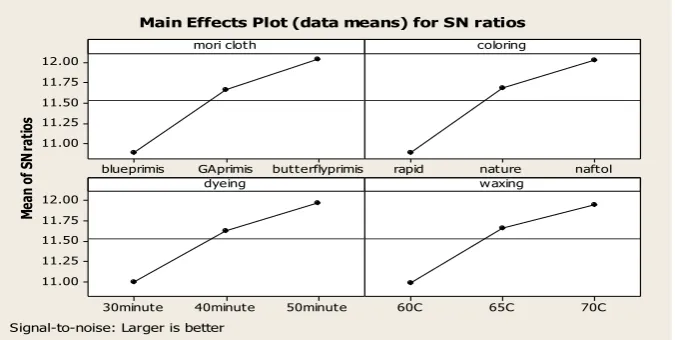
Based on Figure 1, which shows the mean response for each factor level, it can be seen that factor A (mori cloth) has the highest mean fastness in level 3, factor B (coloring) has the highest mean fastness in level 3, factor C (dyeing) has the highest mean fastness in level 3, and factor D (waxing) has the highest mean fastness in level 3. The Taguchi method used the analysis of S/N ratios to find the factors that contributed to the reduction of variance of quality characteristics (the response variable). A characteristic of quality used in this research is color fastness, where a higher value is better, so the S/N ratio used was “the larger the better”.
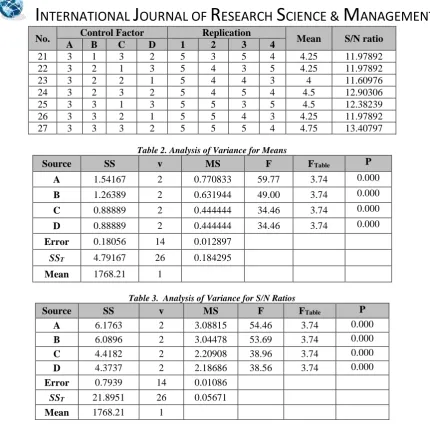
Based on Figure 2, which shows S/N ratio level factor responses, it can be seen that factor A (mori cloth) has the highest mean fastness value in level 3, factor B (coloring) has the highest mean fastness value in level 3, factor C (dyeing) has the highest mean fastness value in level 3, and factor D (waxing) has the highest mean fastness value in level 3. The next analyses conducted were done to calculate the analysis of variance for means and analysis of variance for S/N ratios of the response table. The results of the analysis of variance for means can be seen in Table 2.
[Hari * et al., 5(5): May, 2018]
ISSN: 2349-5197
Impact Factor: 3.765
I
NTERNATIONAL
J
OURNAL OF
R
ESEARCH
S
CIENCE &
M
ANAGEMENT
Based on Table 3, F values are higher than FTable (FA = 54.46 > FTable = 3.74; FB = 53.69 > FTable = 3.74; FC = 38.96 > FTable = 3.74; and FD = 38.56 > FTable = 3.74). This means that all factors are significant to color fastness. Using the differential test, the paired sample T-test, to compare before and after experiment designs, a p-value of 0.000 (p < 0.05) was obtained. From these results it can be concluded that significant quality improvement occurred between the variables in the batik design before the experiment and the batik design after. The average difference before and after the experiment was 1.78 Grey Scale or an increase of 22.22%.From the research results and discussion above it can be concluded that by using the Taguchi experimental method on Indonesian batik tulis mean values of color fastness are FA = 59.77, FB = 49.00, FC = 34.46, and FD = 34.46. The S/N ratio value effects are FA = 54.46, FB = 53.69, FC = 38.96, and FD = 38.56. This means that all factors are significant to color fastness. Confirmation of experimental results for mean and S/N ratio values are acceptable considering confidence intervals. Thus, the optimal level settings are mori fabric using mori primissima kupu-kupu, coloring with naftol coloring, immersion for 50 minutes and the waxing process, or malam, in a temperature of 700C. After designing Indonesian batik using the results of Taguchi experimental methods, there was a quality improvement of 22.22% compared to before.
Acknowledgement
The authors would like to thank the textile chemistry laboratory of the Islamic University of Indonesia for testing the research sample. The authors also thank the owners and employees of Pemalang Batik Industrial Center for information and research data retrieval
References
[1] Situmorang, J, W., & Situmorang, J. (2008). Iklim Usaha UKM di Era Otonomi Daerah. Infokop, 16, 18-36.
[2] Marbun. (1993). Pengantar Ekonomi Perusahaan. Jakarta: Ghalia Indonesia.
[3] Tambunan, T. (2002). Usaha Kecil dan Menengah di Indonesia Beberapa Isu Penting. Jakarta: Salemba Empat.
[4] Nurainun, Heriyana & Rasyimah. (2008). Analisis Industri Batik di Indonesia, Jurnal Fokus Ekonomi, 7, 124-135.
[5] Yusri & Idris, M. (2011). Gema Industri Kecil. Desperindo Natamedia Publising, Jakarta, 54.
[6] Erma, S., Abdullah, I., & Lasiyo. (2011). Strategi Pengembangan Komoditas Studi Tentang Budaya Ekonomi Di Kalangan Pengusaha Batik Laweyan. Jurnal Kawistara, 1, 213-320.
[7] Kemenperin. (2016). Industri Batik Nasional Diperkuat. www.kemeperin.go.id. Retreived: 13 Agustus 2017.
[8] Aprilia, S., & Syamwil, R. (2014). Pengaruh Konstruksi Kain Terhadap Kualitas Batik Dengan Teknik Wet On Wet (WOW). Fashion and Fashion Education Journal, 3, 1-6.
[9] Fakriyah, U., Pulungan, M, H., & Dewi, I, K. (2015). Pengaruh Jenis dan Konsentrasi Fiksator Terhadap Intensitas Warna Kain Mori Batik Menggunakan Pewarna Alami Kunyit (Curcuma Domestica Val.). Proceedings Agroindustry Seminar and Nasional Symposium Study Program TIP-Universitas Trunojoyo Madura, A1-A4. Jawa Timur, Indonesia.
[10]Prayitno, R, E., Wijana, S., & Diyah, B, S. (2014). Pengaruh Bahan Fiksasi Terhadap Ketahanan Luntur dan Intensitas Warna Kain Mori Batik Hasil Pewarnaan Daun Alpukat (Persea americana Mill) (Unplublished Master’s thesis). Universitas Brawijaya, Malang, Indonesia.
[11]Sulasminingsih. (2006). Studi Komparasi Kualitas Kain Kapas Pada Pencelupan Ekstrak Kulit Pohon Mahoni Dengan Mordan Tawas dan Garam Diazo (Unplublished Master’s thesis), Universitas Negeri Semarang, Semarang, Indonesia.
[12]Wahyuningsih, S, E. (2009). Pengaruh Suhu Pada Proses Perendaman Terhadap Daya Susut Kain Batik Dari Serat Kapas. Jurnal Kompetensi Teknik, 1, 1-8.
[13]Herlina, S., & Palupi, D, Y. (2013). Pewarna Tekstil I. Jakarta: Kementerian Pendidikan dan Kebudayaan Direktorat Pembinaan Sekolah Menengah Kejuruan.
[Hari * et al., 5(5): May, 2018]
ISSN: 2349-5197
Impact Factor: 3.765
I
NTERNATIONAL
J
OURNAL OF
R
ESEARCH
S
CIENCE &
M
ANAGEMENT
[15]Swamy, V.N., Gowda, K N.N., & Sudhakar, R. (2015). Dyeing of Silk Using Madhuca Longifolia asNatural Dye Source. Indian Journal of Fibre and Textile Research. Vol. 40, No 4.
[16]Roy, G. & Saha, S C. (2016). A novel and Low-cost Instrument for Color Identification of Natural Fibres. Indian Journal of Fibre and Textile Research. Vol. 41, No. 3.
[17]Triawati, N. (2007). Penentuan Setting Level Optimal Untuk Meningkatkan Kualitas Benang Rayon (30R) Dengan Eksperimen Taguchi Sebagai Upaya Jaminan Atas Spesifikasi Kualitas Benang (Unplublished Master’s thesis), Universitas Sebelas Maret, Surakarta, Indonesia.
[18]Borshalina, T. (2015). Marketing Strategy and the Development of Batik Trusmi in the Regency of Cirebon which Used Natural Coloring Matters. Procedia Social and Behavioral Sciences. The 6th Indonesia International Conference on Innovation, Entrepreneurship, and Small Business, 217-226. USA.
[19]Margried, N. (2015). Batik Fractal Community: Creative Engagement through Technology. Social and Behavioral Sciences, 184, 214-222.
[20]Mavruz, S., & Ogulata, R, T. (2010). Taguchi approach for the optimisation of the bursting Strength of knitted Fabrics. Fibres & Textile in Eastern Europe, 18, 78-83.
[21]Oji, J, O., Sunday, P, H., Petinrin, O, M., & Adetunji, A, R. (2013). Taguchi Optimization of Process Parameters on the Hardness and Impact Energy of Aluminium Alloy Sand Castings. Leonardo Journal of Sciences, 23, 1-12.
[22]Cicek, A., Krvak, T., & Samtas, G. (2012). Application of taguchi method for surface raughness and roundness error in drilling of AISI 316 stainless steel. Journal of Mechanical Engineering, 58, 165-174. [23]Yadav, R, N. (2017). A hybrid approach of Taguchi-Response surface methodology for modeling and
optimization of duplex turning process. Measurement, 100, 131-138.
[24]Sabir, E.C. & Sarpkaya, C. (2016). Optimization of sizing parameters with Taguchi Method. Indian Journal of Fibre and Textile Research. Vol. 41, No. 1.
[25]Belavendram, N. (1995). Quality by Design: Taguchi Techniques for Industrial Exsperimentation. London: Prentice Hal.
Tables
:
Table 1. Mean and S/N Ratios of Taguchi Experimental Results
No. Control Factor Replication Mean S/N ratio
A B C D 1 2 3 4
1 1 1 1 1 3 3 3 3 3 9.542425
2 1 1 2 2 3 3 4 4 3.5 10.61452
3 1 1 3 3 3 3 4 4 3.5 10.61452
4 1 2 1 1 3 4 3 3 3.25 10.04548
5 1 2 2 2 3 4 4 4 3.75 11.26954
6 1 2 3 3 3 4 5 5 4.25 11.97892
7 1 3 1 1 3 5 3 3 3.5 10.29963
8 1 3 2 2 3 4 4 4 3.75 11.26954
9 1 3 3 3 3 5 5 5 4.5 12.38239
10 2 1 1 2 4 3 3 4 3.5 10.61452
11 2 1 2 3 4 3 4 5 4 11.60976
12 2 1 3 1 4 3 5 3 3.75 10.90548
13 2 2 1 2 4 4 3 4 3.75 11.26954
14 2 2 2 3 4 4 4 5 4.25 12.45079
15 2 2 3 1 4 4 5 3 4 11.60976
16 2 3 1 2 4 5 3 4 4 11.60976
17 2 3 2 3 4 5 4 5 4.5 12.90306
18 2 3 3 1 4 5 5 3 4.25 11.97892
19 3 1 1 3 5 3 3 5 4 11.21734
[Hari * et al., 5(5): May, 2018]
ISSN: 2349-5197
Impact Factor: 3.765
I
NTERNATIONAL
J
OURNAL OF
R
ESEARCH
S
CIENCE &
M
ANAGEMENT
No. Control Factor Replication Mean S/N ratio
A B C D 1 2 3 4
21 3 1 3 2 5 3 5 4 4.25 11.97892
22 3 2 1 3 5 4 3 5 4.25 11.97892
23 3 2 2 1 5 4 4 3 4 11.60976
24 3 2 3 2 5 4 5 4 4.5 12.90306
25 3 3 1 3 5 5 3 5 4.5 12.38239
26 3 3 2 1 5 5 4 3 4.25 11.97892
27 3 3 3 2 5 5 5 4 4.75 13.40797
Table 2. Analysis of Variance for Means
Source SS v MS F FTable P
A 1.54167 2 0.770833 59.77 3.74 0.000
B 1.26389 2 0.631944 49.00 3.74 0.000
C 0.88889 2 0.444444 34.46 3.74 0.000
D 0.88889 2 0.444444 34.46 3.74 0.000
Error 0.18056 14 0.012897
SST 4.79167 26 0.184295
Mean 1768.21 1
Table 3. Analysis of Variance for S/N Ratios
Source SS v MS F FTable P
A 6.1763 2 3.08815 54.46 3.74 0.000
B 6.0896 2 3.04478 53.69 3.74 0.000
C 4.4182 2 2.20908 38.96 3.74 0.000
D 4.3737 2 2.18686 38.56 3.74 0.000
Error 0.7939 14 0.01086
SST 21.8951 26 0.05671
Mean 1768.21 1
Figures
:
Figure 1. Chart Response for Mean Value
M
ea
n
of
M
ea
ns
butterfly primis G A primis
blueprimis
4.20
4.05
3.90
3.75
3.60
naftol nature
rapid
50minute 40minute
30minute
4.20
4.05
3.90
3.75
3.60
70C 65C
60C
mori cloth coloring
dyeing w axing
[Hari * et al., 5(5): May, 2018]
ISSN: 2349-5197
Impact Factor: 3.765
I
NTERNATIONAL
J
OURNAL OF
R
ESEARCH
S
CIENCE &
M
ANAGEMENT
Figure 2. Chart Response for S/N Ratio Value
M
ea
n
of
S
N
ra
tio
s
butterflyprimis GAprimis
blueprimis 12.00
11.75 11.50 11.25 11.00
naftol nature
rapid
50minute 40minute
30minute 12.00
11.75 11.50 11.25 11.00
70C 65C
60C
mori cloth coloring
dyeing waxing
Main Effects Plot (data means) for SN ratios