261
This open access article is distributed under a Creative Commons Attribution (CC-BY SA) 3.0 license
OPTIMISING TRAFFIC FLOW AT A SIGNALISED
INTERSECTION USING SIMULATION
Muhammad Rozi Malim1, Sherey Sufreney Abd Rahman2 and Faridah Abdul Halim3
Faculty of Computer and Mathematical Sciences, UiTM Shah Alam, Selangor, Malaysia
1[email protected], 2[email protected], 3[email protected]
ABSTRACT
Traffic signal lights system is a signalling device located at an intersection or pedestrian crossing to control the movement of traffic. The timing of traffic signal lights has attracted many researchers to study the problems involving traffic light management and looking for an inexpensive and effective solution that requires inexpensive changes in the infrastructures. A simple traffic lights system uses a pre-timed control setting based on the latest traffic data, and the setting could be manually changed. It is a common type of signal control and sometimes the setting was not correctly configured with the traffic data, thus leading to congestion at an intersection. Many mathematical strategies were applied to get an optimal setting. This study aims to model the traffic flow at Persiaran Kayangan and Persiaran Permai Intersection, Section 7, Shah Alam, as the case study, by using AnyLogic simulation software. The model was used to determine the best timings of traffic green lights that minimise the average time at the intersection and reduce traffic congestion. The findings showed that the best timings of traffic green lights for four directions at the intersection are 120 seconds, 75 seconds, 130 seconds and 100 seconds, respectively. These timings of green lights produced the lowest average time at the intersection (55.65 seconds).
Keywords: Traffic Light, Intersection, AnyLogic Simulation, Optimisation.
Received for review: 28-06-2019; Published: 10-10-2019
1. Introduction
A traffic light system consists of three basic subsystems; the signal lights (red, yellow and green) in their housing, the supporting poles, and the electric controller. It is a signalling device located at an intersection or pedestrian crossing to control the movement of traffic.
262
The timing of traffic signal lights has attracted many researchers to study the problems involving traffic light management and looking for an inexpensive and effective solution that requires inexpensive changes in the infrastructures of city areas (Babicheva, 2015; Covell et al., 2015; Goel et al., 2017; Pop, 2018). A simple traffic light system uses a fixed control setting based on the latest traffic data, and the setting could be manually changed. It is a common type of signal control and sometimes it produces a glitch which differs from the original setting, thus leading to a long queue at an intersection. Many mathematical strategies were applied to get an optimal setting (Di Febbraro and Sacco, 2014; Kamran et al., 2017; Li and Sun, 2016; Prontri et al., 2015; Kou et al., 2018). Most of the studies consider sensitivity analysis on different factors affecting traffic flow and try to optimize traffic flow for different types of settings.
In this study, a pre-timed traffic light system at an intersection that experiences some issues such as long waiting time and long queue was considered as the case study. The objectives are to evaluate the traffic flow at the intersection using a simulation approach, and then determine the best timings of traffic green lights that would reduce the traffic congestion during rush hours. The traffic flow was modelled using AnyLogic software. The timings of traffic green lights were optimised via an optimisation engine built in the software.
2. Case Study and Methodology
2.1 The Case Study, Data Collection, and Significant of Study
A signalised intersection (fixed time three-stroke traffic light system) at Section 7, Shah Alam, Selangor was selected as the case study. The specific location is the Persiaran Kayangan and Persiaran Permai Intersection at Section 7, Shah Alam, where one of the four directions is the entrance to Universiti Teknologi MARA (UiTM).
Through observations and video recording at the intersection, the required data were collected for one week during rush hours (seven days including weekends). To build the corresponding simulation model, the following variables for each direction at the intersection must be determined; arrival rate of cars, mean duration of traffic green light, mean duration of yellow light, and mean duration of red light. The current four-phase signals plan of the traffic light system that controls the movements of cars and the factors contributing towards traffic congestion at the intersection were also observed.
Optimising the durations of traffic signal lights would be a normal approach for reducing traffic congestion at intersections. Traffic flow at Persiaran Kayangan and Persiaran Permai Intersection facing bad congestion during morning and evening rush hours as it is connected to the main roads from i-City Section 7, Section 2, Padang Jawa, and UiTM Shah Alam. The commuters spent too much time waiting at the intersection. This not only annoys the commuters, the long waiting time would trigger anxiety among them. This study would significantly contribute to the interest of all stakeholders; UiTM Shah Alam’s staff and students, Shah Alam City Council or MBSA (the local authority), and Shah Alam residents, especially in the vicinity of Section 7.
2.2 Simulation with AnyLogic
Simulation is a probabilistic decision model (Malim et al., 2019). Simulation has been widely applied to solve various problems including traffic management (Halim et al., 2012; Jupri and Malim, 2013; Kamran et al., 2017).
263
and agent-based modelling methods into one model development environment (Karaaslan et al., 2018). Shi et al. (2010) used the AnyLogic-based simulation to model and analyse the container terminal’s service process. A passenger flow lines simulation model was established by Wang et al. (2018) based on AnyLogic. The software enabled them to optimise the passenger flow lines and improve the operation capacity of a high-speed railway station. In Chen et al. (2013), AnyLogic was used to study the layout of pedestrian walking facilities at metro stations, and a reasonable facility arrangement plan was obtained.
By default, AnyLogic considers the arrivals of vehicles follow a Poisson process. The optimisation process to determine the best timings of traffic green lights at the intersection was performed using AnyLogic OptQuest Optimisation Engine. OptQuest automatically finds the best values of variables of a model, with respect to certain constraints.
2.3 AnyLogic Model Overview
The simulation model for Section 7 intersection was built using AnyLogic Personal Learning Edition 8.3.3 software. There were several necessary steps to follow, as described below.
Step 1: Road Network Creation
First, a simulation model with the name “Intersection Section 7” was constructed on a satellite image of the intersection taken from Google Maps. For optimal results, the model must be constructed based on the image scale aligned with the AnyLogic scale. Later, the lanes on each road at the intersection were created. Each of the roads (directions) was mapped with connecting lanes and turning points according to the current four-phase plan where flow from each direction is put into a single phase avoiding all conflicts (one phase for each direction). At each junction, a line was drawn to represent the stopping line.
Step 2: Set up Arrival Rates
Car is the only agent that had been defined with the ‘CarSource’ block creating agent at a specified rate. This is the specific procedure for this step. The arrival rate of Car for each of the four sources (Padang Jawa, i-City, Section 2, and UiTM) was set up based on the number of vehicles arrived at the road stopping line.
Step 3: Set Up Speed
Acceleration and deceleration can be modelled by changing the speed at appropriate times. For instance, the initial speed and preferred speed for vehicles from Padang Jawa were setup at 80km/h as this is the maximum speed for that road. The agent (Car) length defined in this model is 5 meters.
Step 4: Traffic Flow Logic
Road Traffic Library in AnyLogic can be utilised by simulating and visualising the traffic flow. The library provides a specific physical-level of vehicles development. It is appropriate for road and highway traffic modelling. This library incorporates:
• Visual space mark-up to draw street systems (street, crossing point, parking, stop line).
• Driver behaviour; speed control, pick less busy lane, give way when paths merge, etc.
• Support of user-defined vehicle types with custom animation and attributes.
264
connectors. The probability to use a specific lane has been setup based on vehicle options to follow any route. Then, every segment of the road is paired with a certain element.
Road Traffic Library consists of Car object blocks that use to control the Car. The CarSource block produces Car objects and places them within the road network at a specified location. The Car arrivals may be defined by interarrival times, arrival rate, arrival schedule, or call for injection functions. Car Dispose block eliminates Car from the model, and CarMoveTo block controls the movement of Car. When a Car enters the CarMoveTo block, it estimates the route from start location to the next destination (roads, parking, bus stop, or stop lines). If destination is a road, the Car will start moving throughout the shortest route from initial road and then move along the road till it is disposed. Otherwise, if there is no route from current location to the next destination, the Car is disposed from the block.
TrafficLight block simulates traffic lights at intersections or pedestrian crossings to control conflicting traffic flows. RoadNetworkDescriptor block allows the set up of actions for each Car in the following cases; entering network, changing lanes, entering roads, and many more. This block also allows for a road density map which shows the current traffic jams on a network of roads. A probability distribution is defined to determine turning points and directions of the Car. The function of Delay block is to keep Car meant to park during allotted time interval. The Car will later exit the environment through CarExit block when all instructions have been completed.
Step 5: Setup Traffic Lights
The logic model is then simulated for the purpose of noticing any improper function. Next is to configure the traffic lights; it is a mandatory for intersections. Let say, there were no traffic lights built in the logic model, then AnyLogic would function perfectly but a malfunction warning will be displayed.
Step 6: Optimisation of Traffic Lights
The first step in optimisation process is to determine the initial values of variables byrunning a simulation experiment using the developed model for one-hour based on the collected data. Using the initial values, an optimisation process can be performed. This process searches through all possible values of variables to find the optimal values. It is possible to have more than one set of optimal values. The optimal values are determined by a search area. If the search area gets bigger, the optimal values will be dragged. In other words, the wider the range, the more time is needed to find the optimal values in the search area.
In the optimisation process, AnyLogic software performs its mathematical reasoning. It is important to know the right mathematical formula to achieve optimal results. Currently AnyLogic has its own top place in OptQuest Optimisation Engine. It was claimed as one of the most flexible and user-friendly optimisation tools in the market. The OptQuest will search for the best values of variables of a model automatically. AnyLogic provides a convenient graphical user interface to set up and control the optimisation process. The model used in this study will not allow a vehicle to wait at the intersection. It is also assumed that the number of vehicles passing through the intersection is maximised by solving the following linear programming model from road i to road j for a fixed vertex (Göttlich and Ziegler, 2014).
Maximise
iin fi
ˆ (1)
such that fj =
iindijfi
ˆ , 0 ≤fˆ ≤i Fˆ , 0 ≤i fˆ ≤j Fˆ j (2)
where fˆi:= f(ˆi) and fj:= f(j) indicate the flow of incoming and outgoing edges, in
is
the set of incoming edges and out is the set of outgoing edges, i [0, max] denotes the
265
The optimal solution will be referred by
fˆi,iin
and
outj j
fˆ , . Under certain conditions, it is possible to solve the linear model exactly. If a unique solution exists,
j i indijFi F
ˆ . (3)The optimal solution is given by fˆi =Fˆi, fj =
iindijfi
ˆ . (4)
From equations (3) and (4), it is followed immediately that equation (2) is satisfied,
and hence the feasible solution of equation (2) is
fˆi,iin
and
out j jfˆ , . Let
s in
i i
fˆ , and
fˆjs,jout
be the second feasible solution of equation (2). Then, equation (3) induces that is
i f
fˆ ˆ for all iin. Since fjs is uniquely defined by equation (3), the
second solution is only different from the first if i s
i f
fˆ ˆ for at least one iin. This implies that
iin fis
iin fi
ˆ ˆ (objective function). Consequently,
fˆi ,iin
and
outj j
fˆ , represent the unique optimal solution for equation (2).
2.4 Intersection Section 7 Simulation
The Intersection Section 7 simulation model was developed with AnyLogic 8.3.3 software using Road Traffic, Analysis, Presentation, Agent, Process Modelling, and Statechart libraries. The simulation was performed for a period of 3600 seconds. There are four different sources of cars (Section 2, Padang Jawa, i-City, and UiTM), as shown in Table 1. The average number of cars per hour (arrival rate or traffic flow rate) from Section 2 is 900 cars, Padang Jawa is 1300 cars, i-City is 1350 cars, and UiTM is 115 cars. The numbers of cars were generated based on the traffic flow rates of the corresponding sources.
Table 1. Traffic Flow Rate, Speed and Flow Density
Source Traffic Flow Rate, q (cars/hour) Speed, v (km/h) Flow Density (k =q/v)
Section 2 900 80 11.25
Padang Jawa 1300 80 16.25
i-City 1200 30 40
UiTM 115 20 5.75
According to the fundamental traffic flow theory (Disbro and Frame, 1992), the relationship between density, flow and speed is k =q/v, where k = flow density (cars/km/lane),
𝑞 = traffic flow rate (cars/hour/lane), and 𝑣 = speed (km/hour). As calculated in Table 1, the flow densities for Section 2, Padang Jawa, i-City, and UiTM are 11.25, 16.25, 40, and 5.75 cars per km per lane, respectively. Hence, i-City has the highest flow density due to low speed, whereas UiTM has the lowest flow density due to low flow rate and speed.
3. Simulation Results and Discussion
3.1 Data Collection and Analysis
266
hours (7.00 to 8.00am and 5.00 to 6.00pm), and also during lunch break (1.00 to 2.00pm).
The yellow light at each stop line was pre-timed at a constant of three seconds. The red light for Padang Jawa stops line has the shortest duration of 3.3 minutes (198 seconds). For other three stop lines (Section 2, i-City, and UiTM), the same duration of 3.45 minutes (207 seconds) were recorded for the three red lights. The green light changes for Padang Jawa, i-City and UiTM stop lines were measured, on average, as 14 times per hour. However, the green light changes for Section 2 stop line was slightly lower as 13 times per hour.
The four-phase plan of the traffic light system currently adopted at the intersection is the most simple and trivial phase plan where flow from each direction is put into a single phase avoiding all conflicts. The factors contributing towards traffic congestion at the intersection were observed as follows; too many cars on the roads especially during rush hours, traffic signal lights out of sync many times on purpose or occasionally when the controllers were malfunctioning, and the timings of traffic signal lights were not significant.
3.2 AnyLogic Simulation Results
The average durations of green lights for four stop lines after running the simulation experiment for one hour (3600 seconds) based on the collected data were obtained as follows; p1 (Section 2) = 90 seconds, p2 (Padang Jawa) = 75 seconds, p3 (i-City) = 120 seconds, and p4 (UiTM) = 40 seconds, as shown in Table 2 (Before Optimisation). These are as the initial values of variables for optimisation process. The average time in system (at the intersection) is 67.98 seconds.
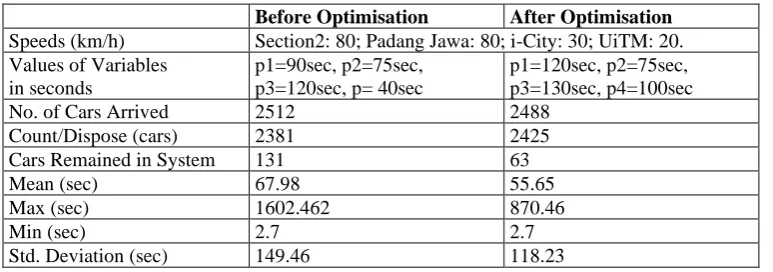
Table 2. Summary of Simulation Results
Before Optimisation After Optimisation
Speeds (km/h) Section2: 80; Padang Jawa: 80; i-City: 30; UiTM: 20. Values of Variables
in seconds
p1=90sec, p2=75sec, p3=120sec, p= 40sec
p1=120sec, p2=75sec, p3=130sec, p4=100sec
No. of Cars Arrived 2512 2488
Count/Dispose (cars) 2381 2425
Cars Remained in System 131 63
Mean (sec) 67.98 55.65
Max (sec) 1602.462 870.46
Min (sec) 2.7 2.7
Std. Deviation (sec) 149.46 118.23
Next, the initial values of variables (durations of green lights at four stop lines) were optimised by running the simulation model with OptQuest Optimisation Engine on all possible values of the four variables. The range of values for each variable was set up between 10 seconds and 200 seconds with steps of 5 seconds. All variables were converted to discrete values. The travelling speed from i-City was considered as 30 km/h, from both Section 2 and Padang Jawa were 80 km/h, and from UiTM was 20 km/h (the speed limit inside UiTM campus).
267 3.3 Discussion
As summarised in Table 2, the minimum time a car spent at the intersection for both experiments is 2.7 seconds. For the first experiment (before optimisation), the initial values of variables are p1 = 90 seconds, p2 = 75 seconds, p3 = 120 seconds, and p4 = 40 seconds. The total number of cars passed through the green lights is 2381, and the number of cars arrived at the intersection is 2512; thus, 131 cars remained at the intersection. The mean and maximum times a car spent at the intersection are respectively 67.98 seconds and 1602.46 seconds with a standard deviation of 149.46 seconds.
Meanwhile, for the optimisation experiment, the best values of variables are p1 = 120 seconds, p2 = 75 seconds, p3 = 130 seconds, and p4 = 100 seconds. The total number of cars passed through the green lights is 2425, and the number of cars arrived at the intersection is 2488; thus, 63 cars remained at the intersection. Hence, the number of cars remained at the intersection after optimisation is lower compared to before optimisation. The mean and maximum times a car spent at the intersection are respectively 55.65 seconds and 872.53 seconds with a standard deviation of 99.96 seconds (both are lower than before optimisation). Based on the results, it can be concluded that the best timings of traffic green lights at the intersection that would minimise the average waiting time and maximise traffic flow are p1 (Section 2) = 120 seconds, p2 (Padang Jawa) = 75 seconds, p3 (i-City) = 130 seconds, and p4 (UiTM) = 100 seconds.
4. Conclusion
Traffic light system plays an important role in managing traffic congestion at intersections. The intersection considered in this study, Persiaran Kayangan and Persiaran Permai Intersection at Section 7, Shah Alam, is a crowded area adjacent to the Federal Highway with high traffic flow. This study provides a better understanding of the traffic light system at the intersection and has successfully produced better timings of green lights that would significantly reduce the waiting time and hence reduce traffic congestion at the intersection.
According to MBSA (Shah Alam City Council), the traffic light system at the intersection was set up based on a typical cycle which is about 120 sec (2 minutes). However, it was observed that the waiting time was between two minutes to four minutes. As the consequence, there were complaints from commuters regarding traffic congestion at the intersection; some have to wait for five minutes or longer. The main objective of this study is to model traffic flow at the intersection during rush hours for the purpose of determining the best values of variables (green light durations) that minimise the average waiting time and maximise traffic flow.
Using the data collected at the intersection, the traffic flow at the intersection was modelled using AnyLogic simulation software. The simulation model was run for one hour to determine the average timing of green light at each of the four stop lines at the intersection. These average durations revealed that the average waiting time at the intersection was 67.98 seconds; i.e., a commuter would wait 67.98 seconds to pass through the intersection.
268 References
Babicheva, T. S. (2015). The Use of Queuing Theory at Research and Optimization of Traffic on the Signal-controlled Road Intersections. Procedia Computer Science, 55, 469-478. Chen, L., Song, R., Li, Z., & Li, T. (2013). Simulation Study on the Layout of Metro Station
Hall Facilities based on AnyLogic. Journal of Transport Information & Safety 2013-05, 19-24.
Covell, M., Baluja, S., & Sukthankar, R. (2015, September). Micro-Auction-Based Traffic-Light Control: Responsive, Local Decision Making. In Intelligent Transportation Systems (ITSC), 2015 IEEE 18th International Conference on Intelligent Transportation Systems, 558-565.
Di Febbraro, A., & Sacco, N. (2014). On Evaluating Traffic Lights Performance Sensitivity via Hybrid Systems Models. Procedia - Social and Behavioral Sciences, 111, 272-281. Disbro, J. E., & Frame, M. (1992). Traffic Flow Theory and Chaotic Behavior.
Transportation Research Record, 1225, 109-115.
Goel, S., Bush, S. F., & Gershenson, C. (2017). Self-Organization in Traffic Lights: Evolution of Signal Control with Advances in Sensors and Communications. Computer Science: Systems and Control, Cornell University, 1-54.
Göttlich, S., & Ziegler, U. (2014). Traffic Light Control: A Case Study. Discrete and Continuous Dynamical Systems-Series S, 7, 483-501.
Halim, F. A., Malim, M. R., & Zulkefly, N. (2012, September). An Analysis of Client Service System at an Insurance Company using Simulation. In 2012 International Conference on Statistics in Science, Business and Engineering (ICSSBE), Langkawi, Malaysia, IEEE Explore.
Jupri, N., & Malim, M. R. (2013). Risk Analysis of Construction Project Scheduling using PERT and Monte Carlo Simulation: A Case Study on NIOSH Campus. International Journal of Accounting and Business Management (IJABM), 1(1), 83-91.
Kamran, M. A., Ramezani, H., Masoumzadeh, S., & Nikkhoo, F. (2017). Traffic Light Signal Timing using Simulation. Communications on Advanced Computational Science with Applications, 1(1), 1-11.
Karaaslan, E., Noori, M., Lee, J. Y., Wang, L., Tatari, O., & Abdel-Aty, M. (2018). Modeling the Effect of Electric Vehicle Adoption on Pedestrian Traffic Safety: An Agent-Based Approach. Transportation Research Part C: Emerging Technologies, 93, 198-210. Kou, W., Chen, X., Yu, L., & Gong, H. (2018). Multiobjective Optimization Model of
Intersection Signal Timing Considering Emissions Based on Field Data: A Case Study of Beijing. Journal of Air Waste Management Association, 68(8), 836-848.
Kulanthayan, S., Phang, W. K., & Hayati, K. S. (2007). Traffic Light Violation among Motorists in Malaysia. IATSS Research, 31(2), 67-73.
Li, X., & Sun, J. Q. (2016). Multi-Objective Optimization of Intersections. World Academy of Science, Engineering and Technology, International Journal of Transport and Vehicle Engineering, 10(3).
Malim, M. R., Halim, F. A., Ramli, N. A., & Rani, R. M. (2019). Quantitative Analysis and Techniques for Engineers, Scientists and Managers. Shah Alam: UiTM Press.
Pop, M. D. (2018). Traffic Lights Management Using Optimization Tool. Procedia - Social and Behavioral Sciences, 238, 323-330.
Prontri, S., Wuttidittachotti, P., & Thajchayapong, S. (2015, June). Traffic Signal Control using Fuzzy Logic. In 12th International Conference on Electrical Engineering/ Electronics, Computer, Telecommunications and Information Technology (ECTI-CON), Hua Hin, Thailand, 1-6.
Shi, Y., Yang, X., He, Q., Li, Q., & Xu, Q. (2010, December). AnyLogic-based Simulation Analysis of Queuing System at Container Terminals. In 2nd International Conference on Information Science and Engineering (ICISE2010), Hangzhou, China, 121-124. Wang, H., Wang, B., Xu, J., & Hu, Z. (2018). Analysis and Optimization of Passenger
269
Weimer, C. W., Miller, J. O., & Hill, R. R. (2016, December). Agent-Based Modelling: An Introduction and Primer. In 2016 Winter, Simulation Conference, Arlington, VA, USA, IEEE, 1558-4305.