CONTINOUS QUALITY IIMPROVEMENT PROCESS USING
CONSTRUCTIVE ALIGNMENT
Salleh Ahmad Bareduan, Ishak Baba, Zarina Md Ali and Asmarashid Ponniran Centre for Academic Development, UTHM
ABSTRACT
This paper presents an application of continuous quality improvement (CQI) process for a typical engineering course using constructive alignment. The performance measures are the course learning outcomes (CLO) attainment and overall course grades which combines the marks obtained in the tests, assignments and final examination. Tests and final examination represent the cognitive assessment while assignments represent the generic skills assessment measured using rubrics. Pareto diagram is used to analyze the CLO attainment data resulting from tests, assignments and final exam marks. Possible causes related to low CLO attainment are explored using the QC tool of Ishikawa diagram. From detail studies on both Pareto and Ishikawa diagrams, CQI activities based on constructive alignment are then drafted and implemented to the course. The CQI implementation shows significant improvements to the CLO attainments.
1. INTRODUCTION
Quality concepts which were previously preached and highly regarded in the business and entrepreneurs world are currently being adopted and incorporated into the university education field (Lewis and Smith, 1994). Almost all aspects of the university systems including teaching, research, professional training, industrial and community relations, academic program accreditation, and university support services have been introduced with the quality philosophy. In fact, some universities put a great effort to obtain the ISO 9001 certification to show the public that quality is part of their daily concerns. One of the most important elements of the quality concepts being embedded into the higher education system is the principals of continuous quality improvement (CQI).
CQI is categorized as an organizational philosophy that “utilizes scientific outcomes measurements, systematic management techniques, and teamwork to achieve the mission of organization” (Freed., Klugman, and Fife, 1994). Today, CQI principles and practices are no longer strangers and have been seriously implemented in universities strategic planning, program review, and accreditation standards (Harper and Lattuca, 2010). In Malaysia, the CQI is one of the criteria being evaluated by the Malaysian Quality Agency (MQA) and the Engineering Accreditation Council (EAC) for all educational program accreditation process. During the accreditation evaluation process, the institution of higher learning (IHL) has to show evidence that meaningful data is gathered and utilized to measure the performance of the education program. The performance measures must entail the attainment of all learning outcomes and educational objectives. Appropriate CQI action plans are expected to be derived from the data analysis. Some of the common quality tools that can be used in the data gathering and analysis are flowcharts, check sheets, histograms, Pareto analysis, and cause-and- effect (Ishikawa) diagrams (Stevenson, 2007).
Learning outcomes attainments for educational programs are measured by conducting assessments. A good learning system is the one that aligns teaching method and assessment so that learning outcomes can be achieved (Biggs and Tang 2007). This was termed as “constructive alignment” and it follows three stage models:
Identify clear learning outcomes.
Design suitable assessment tasks that are capable of determining the attainment of the learning outcomes.
Design suitable learning activities to prepare the students to a point where they can successfully undertake the assessment tasks.
The remainder of the paper is organized as follows: Section 2 discusses the methodology employed in the study. This is followed with the data analysis in section 3 and CQI plans, implementation and results in section 4. Lastly, the final section presents the study conclusion.
2. METHODOLOGY
The paper presents a proposed methodology utilizing two of the most popular QC tools in business environment namely the Pareto chart and Ishikawa diagram. The Pareto chart is used to analyze the related available data concerning the students’ grade and the course learning outcomes (CLO) attainment and their comparisons against the key performance indicator (KPI). Then, brainstorming session is conducted using Ishikawa diagram as a tool to determine possible causes resulted to the non-achievement of the KPI. Action plans are then selected to address several main causes and these plans were introduced into the teaching and learning process as the CQI implementations. Post implementation data were collected and analyzed to ascertain the performance of the CQI process.
One of the academic programs available at the Faculty of Mechanical and Manufacturing Engineering (FKMP), Universiti Tun Hussein Onn Malaysia is the Bachelor of Mechanical Engineering. With the introduction of outcome-based education (OBE), courses offered in this program have a specific list of CLO ranging from three to four statements for each course. The faculty has also predetermined the standard KPI for each CLO which is 50% students to achieve 55% score and above. This KPI is also applied to the
students’ course grade. Any course that does not achieve the KPI for students’ grade or CLO attainment, a mandatory detail analysis must be conducted and CQI action plans have to be proposed to prevent recurring non-satisfactory results.
3. DATA ANALYSIS
FKMP has identified nine program learning outcomes (PLO) for the Bachelor of Mechanical Engineering. These PLO are listed below:
Upon completion of the course the student should be able to:
PLO 1.Acquire adequate knowledge and technical competency in mechanical engineering and its related discipline. (Knowledge)
PLO 2.Apply techniques, skills, and appropriate engineering approaches necessary for engineering research and practices. (Practical Skill)
PLO 3. Communicate effectively using a variety of appropriate mediums. (Communication)
PLO 4. Identify problems, generate solutions and innovate creatively to improve practices in mechanical engineering. (Critical thinking, problem solving).
PLO 6. Acquire self-learning and information management capability, enabling life-long learning. (Life-life-long learning and Information Management).
PLO 7. Recognize the importance of entrepreneurship in mechanical engineering and its related discipline. (Entrepreneurship)
PLO 8. Comprehend global perspective on social culture and sustainable development and perform professional and ethical responsibilities for the benefit of mankind. (Moral, Professional and Ethics)
PLO 9. Organize and effectively lead a team to accomplish certain task. (Leadership)
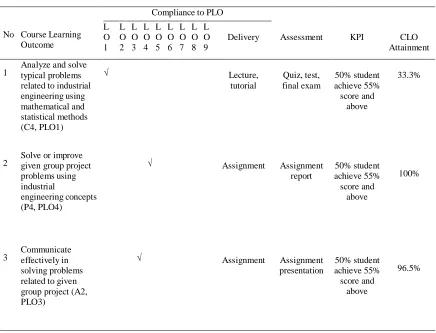
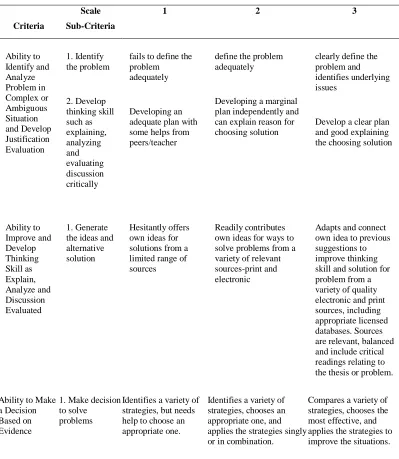
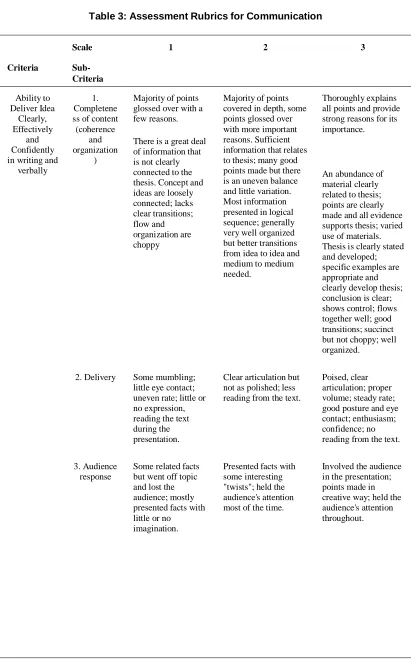
At the end of 2008/2009 academic result analysis, one of the few courses that did not achieve the intended KPI for the program was Industrial Engineering. The CLO attainments and the students’ grades for this course were below the KPI values. Only 47.7% students met the KPI on course grades while the CLO1 attainment was at 33.3% students. Table 1 shows the matrix of CLO vs. PLO + Delivery + Assessment + KPI for Industrial Engineering course. The attainments for all CLO are also shown in the same figure. CLO1 attainment is measured using the results of test 1, test 2 and final examination. On the other hand, CLO2 which measured the assignment report is assessed using critical thinking and problem solving rubrics shown in Table 2. Similarly, CLO3 which measured the students’ presentation generic skill is assessed using communication rubrics shown in Table 3.
Table 1: Matrix of CLO vs. PLO + Delivery + Assessment + KPI + CLO Attainment
Compliance to PLO
No Course Learning Outcome L O 1 L O 2 L O 3 L O 4 L O 5 L O 6 L O 7 L O 8 L O 9
Delivery Assessment KPI CLO Attainment
1 Analyze and solve typical problems related to industrial engineering using mathematical and statistical methods (C4, PLO1) √ Lecture, tutorial Quiz, test, final exam 50% student achieve 55% score and above 33.3%
2 Solve or improve given group project problems using industrial
engineering concepts (P4, PLO4)
√ Assignment Assignment
report 50% student achieve 55% score and above 100%
3 Communicate effectively in solving problems related to given group project (A2, PLO3)
√ Assignment Assignment
Table 2: Assessment Rubrics for Critical Thinking and Problem Solving
Scale 1 2 3
Criteria Sub-Criteria
Ability to Identify and Analyze Problem in Complex or Ambiguous Situation and Develop Justification Evaluation 1. Identify the problem 2. Develop thinking skill such as explaining, analyzing and evaluating discussion critically
fails to define the problem adequately
Developing an adequate plan with some helps from peers/teacher
define the problem adequately
Developing a marginal plan independently and can explain reason for choosing solution
clearly define the problem and identifies underlying issues
Develop a clear plan and good explaining the choosing solution
Ability to Improve and Develop Thinking Skill as Explain, Analyze and Discussion Evaluated 1. Generate the ideas and alternative solution
Hesitantly offers own ideas for solutions from a limited range of sources
Readily contributes own ideas for ways to solve problems from a variety of relevant sources-print and electronic
Adapts and connect own idea to previous suggestions to improve thinking skill and solution for problem from a variety of quality electronic and print sources, including appropriate licensed databases. Sources are relevant, balanced and include critical readings relating to the thesis or problem.
Ability to Make a Decision Based on Evidence
1. Make decision to solve problems
Identifies a variety of strategies, but needs help to choose an appropriate one.
Identifies a variety of strategies, chooses an appropriate one, and applies the strategies singly or in combination.
Table 3: Assessment Rubrics for Communication
Scale 1 2 3
Criteria
Sub-Criteria Ability to Deliver Idea Clearly, Effectively and Confidently in writing and
verbally
1. Completene ss of content
(coherence and organization
)
Majority of points glossed over with a few reasons.
There is a great deal of information that is not clearly connected to the thesis. Concept and ideas are loosely connected; lacks clear transitions; flow and organization are choppy
Majority of points covered in depth, some points glossed over with more important reasons. Sufficient information that relates to thesis; many good points made but there is an uneven balance and little variation. Most information presented in logical sequence; generally very well organized but better transitions from idea to idea and medium to medium needed.
Thoroughly explains all points and provide strong reasons for its importance.
An abundance of material clearly related to thesis; points are clearly made and all evidence supports thesis; varied use of materials. Thesis is clearly stated and developed; specific examples are appropriate and clearly develop thesis; conclusion is clear; shows control; flows together well; good transitions; succinct but not choppy; well organized.
2. Delivery Some mumbling; little eye contact; uneven rate; little or no expression, reading the text during the presentation.
Clear articulation but not as polished; less reading from the text.
Poised, clear articulation; proper volume; steady rate; good posture and eye contact; enthusiasm; confidence; no reading from the text.
3. Audience response
Some related facts but went off topic and lost the audience; mostly presented facts with little or no
imagination.
Presented facts with some interesting "twists"; held the audience's attention most of the time.
Scale 1 2 3
Criteria
Sub-Criteria Ability of Non- verbal Skill Usage 1. Eye Contact Only focuses attention to one particular part of the class does not scan audience.
Occasionally looks at someone or some groups during presentation.
Constantly looks at someone or some groups at all times.
2. Body Language and facial expression Not always attentive, as reflected in comments and body language.
Occasionally displays both a deadpan and conflicting expression during presentation Generally pays attention. Occasionally demonstrates either a deadpan or conflicting expression during presentation
Consistently attentive (as reflected in direct and indirect evidence).
Gives audience clues to what the content of speech is about; Appropriate expression, never notice a deadpan or conflicting expression.
Ability to Use Technology
in Presentation
1. Visual Audio
Have visual audio material but fail to use latest
presentation devices.
Hand made visuals-audio (clip- art, graphs, tables, charts, and QuickTime movies) that enhanced presentation
Hand made visuals-audio (clip-art, graphs, tables, charts, and multimedia)
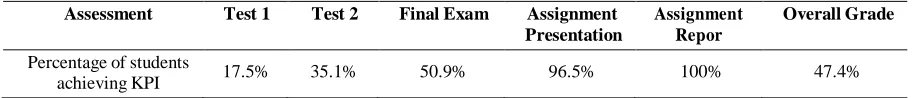
Table 4: Assessment Performance Analysis Sem1 0809
Assessment Test 1 Test 2 Final Exam Assignment
Presentation
Assignment Repor
t
Overall Grade
Percentage of students
achieving KPI 17.5% 35.1% 50.9% 96.5% 100% 47.4%
4. CQI PLANS, IMPLEMENTATIONS AND RESULTS
Information related to the possible causes of the low CLO attainment was gathered from the students. Ishikawa diagram as shown in Figure 2 was used to cluster the information mainly in the following categories:
Access to assessment information Tutorial material
Classroom teaching and learning process Student self-studies
No. of students
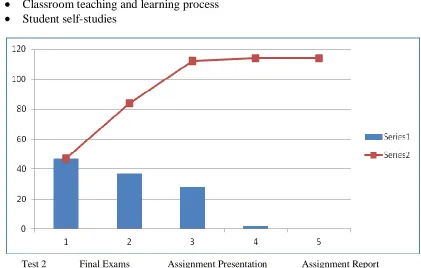
F i g u r e
1 :
P a r e t o
Diagram Analysis on Number of Students Not Achieving the Assessment Kpi
Figure 2: Ishikawa Diagram
Major f i n d i n gs f r o m dia l ogs w i t h t h e s t u d e nt s revealed the followings:
Students have no idea about the pattern of questions for tests and exam. No access to past years exams questions
Problems discussed in lectures and tutorials were very much easier than the tests and exam questions.
Students were asked to do their own problem solving exercises using the recommended text books. No recommended questions list is provided.
Time spent during lecture hours discussing problem solving was insufficient because the lecturer spent much time delivering the theory.
Detail discussions were held with the course coordinator and lecturers involved with the teaching and learning process. The main intention was to come up with a practical action plan that can be used to improve the CLO attainment. As a result, the following CQI activities were agreed to be implemented for the coming semester:
All past years test and final exam questions are to be uploaded to e-Learning facilities.
All tutorial questions discussed in class are to be tailored to resemble the expectations of the CLO, including tests and final exam.
Recommended problem solving questions are to be uploaded to the e-Learning facilities.
More allocation time is to be provided in class discussing problem solving that will help students to achieve the CLO.
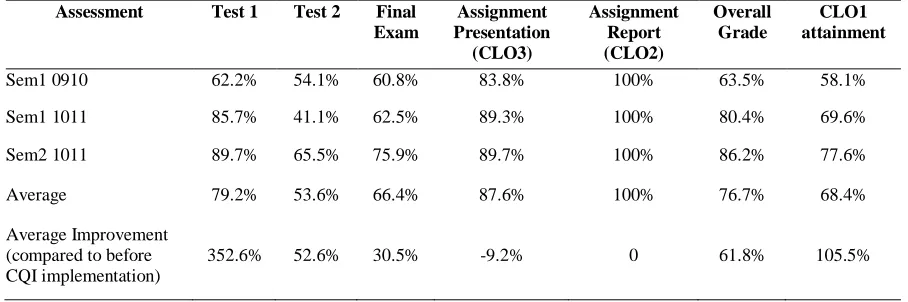
The results of the CQI implementations were monitored for three semesters. Table 5 shows the KPI achievement after implementing the CQI plans. The results showed that significant improvements were obtained in the achievements for tests, final examination, overall grade and CLO1 attainment. Compared to Table 4 (before CQI implementation data), the achievement for test 1 improved by 352.6%, test 2 by 52.6%, final examination by 30.5%, overall grade by 61.8% and CLO1 by 105.5%. However CLO3 showed reduction in attainment by 9.2% while CLO2 was maintained at 100%. Overall, the average attainments of CLO1, CLO2 and CLO3 were higher than the KPI value of 55%.
5. CONCLUSIONS
Table 5: Percentage of students achieving KPI after CQI implementation
Assessment Test 1 Test 2 Final
Exam
Assignment Presentation (CLO3)
Assignment Report (CLO2)
Overall Grade
CLO1 attainment
Sem1 0910 62.2% 54.1% 60.8% 83.8% 100% 63.5% 58.1%
Sem1 1011 85.7% 41.1% 62.5% 89.3% 100% 80.4% 69.6%
Sem2 1011 89.7% 65.5% 75.9% 89.7% 100% 86.2% 77.6%
Average 79.2% 53.6% 66.4% 87.6% 100% 76.7% 68.4%
Average Improvement (compared to before CQI implementation)
352.6% 52.6% 30.5% -9.2% 0 61.8% 105.5%
REFERENCES
Biggs, J. B. and Tang, C. S. (2007). Teaching for Quality Learning at University: What the Student Does, e-Book 3rd edition, McGraw-Hill.
Freed, J. E., Klugman, M. and Fife, J. D. (1994). Total Quality Management on Campus: Implementation, Experiences, and Observations. Annual Meeting of the Association for the Study of Higher Education. Harper, B. J. and Lattuca, L. R. (2010). Tightening Curricular Connections: CQI and Effective Curriculum
Planning. Res High Education. 51: 505-527.
Lewis, R. G. and Smith, D. H. (1994).Total Quality in Higher Education, Delray Beach, FL. St. Lucie Press. Rust, C. (2002). The Impact of Assessment on Student Learning: How Can the Research Literature Practically
Help to Inform the Development of Departmental Assessment Strategies and Learner- Centered Assessment Practices? Active Learning in Higher Education, 3, 145-158.