Challenges in Aviation Governance:
Implementation of Single European Sky
and EU Emissions Trading Scheme
MARINA EFTHYMIOU
A thesis submitted in partial fulfilment of the requirements of The University of West London for the degree of
Doctor of Philosophy in Aviation Management
This PhD thesis may be cited as follows:
Efthymiou, M. (2016). Challenges in
Aviation Governance: Implementation of Single
European Sky and EU Emissions Trading Scheme. PhD thesis, University of West
Dedication:
Στον Ανδρέα και
σε όλους τους ανθρώπους
ACKNOWLEDGEMENTS
Undertaking this PhD has been a life-changing experience and it would not have been
possible without my advisor and mentor Professor Dr Andreas Papatheodorou. I would like
to thank him for his support and patience.
I gratefully acknowledge the support I received from the highly esteemed experts of
EUROCONTROL and especially from the Support to States and Regional Activities Unit of
Directorate of Pan-European Sky. They have helped me understand the various topics and
I feel obliged for what I learned from them.
I would like to express my special appreciation and thanks to all the experts that
participated in my research. Without their help, it would not have been possible to
undertake research on this topic. I would like to thank the Business School of the
University of Aegean, Greece for providing me a place to work during my first year of the
PhD thesis. The support from different experts and individuals during the last three years
of my PhD studies was also very valuable. Among others, I would like to thank Paraskevas
Korfiatis, Juan Vázquez-Sanz, Dr Chris Markou, Hoang Vu Duc, Dr Cathal Guiomard, Dr
Frédéric Dobruszkes, Prof. Frank Fichert, Prof Alexandros Paraskevas, Dr John
Paravantis and the scholars of the German Aviation Research Society (GARS).
Finally, I would like to thank the members of my family and all the people that were or are
part of my life for their support in its various periods.
Marina Efthymiou,
October 2016
ABSTRACT
Traffic growth, capacity constraints, climate change and the necessity to develop a more
cost efficient system led to an ambitious initiative to reform the architecture of airspace
management. This initiative, launched by the European Commission (EC), is called Single
European Sky (SES). The four Key Performance Areas (KPAs) of SES are environment;
cost efficiency; capacity; and safety. In the environment KPA Performance Indicators for
Air Navigation Services Providers (ANSPs) are established to ensure that improvement in
sustainability is achieved. In addition, aviation is included in the European Union’s
Emission Trading Scheme (EU ETS): the EC sets limits on CO2 emissions and provides
economic incentives to airlines to reduce emissions by establishing a market-based
trading system. EU-ETS can be used to simultaneously promote economic efficiency and
achieve environmental goals on a sustainable basis.
The PhD research examines the existence of cancel-out effects between supply-led, i.e.
SES, and demand-led management, i.e. EU ETS, policies by following a holistic approach.
Environmental economics theory and industrial economics are applied to identify factors
that have a significant influence on the two policies. Interestingly, and in spite of common
objectives, the two schemes are governed by different bodies, which may fail to streamline
their communication process. Hence, the PhD thesis also addresses the issue of
governance and its possible failure regarding the full implementation and efficiency of the
schemes.
From a methodological perspective, Delphi is conducted in two rounds to encapsulate
policy complexity at an in-depth level. The target population comprises stakeholders
involved in SES and EU ETS. To select candidates purposive and snowball sampling was
used. Thus, the sample consists of 39 senior managers/experts from Civil Aviation
Based on the results of the Delphi and building on its theoretical background, the PhD
thesis then develops a conceptual model to address governance failure, thus effectively
linking supply- to demand-oriented aviation policies in a holistic manner.
Key words: Single European Sky, Emissions Trading Scheme, Air Navigation Service
TABLE OF CONTENTS
ABSTRACT ... vii
TABLE OF CONTENTS ... ix
TABLE OF FIGURES ... xiii
TABLE OF TABLES... xv
ACRONYMS AND ABBREVIATIONS ... xix
1 Introduction ... 1
1.1 Rationale of the research ... 2
1.2 Research Aim and Research Questions ... 9
1.3 Research Context ... 11
1.4 Research undertaken in aviation and the environment and research gap ... 18
1.5 PhD Thesis Layout ... 23
2 Sustainable Aviation ... 27
2.1 Sustainable Growth of Civil Aviation ... 27
2.2 Negative external economies ... 29
2.3 Principal Environmental issues in aviation ... 38
2.3.1 Greenhouse Gases ... 39
2.3.2 Noise Pollution and Local Air Quality ... 42
2.4 Measuring environmental impact ... 45
2.5 Fuel ... 49
2.5.1 Biofuels ... 52
2.6 Summary ... 56
3 EU Emissions Trading Scheme in aviation ... 57
3.2 EU Emissions Trading Scheme inclusion of Aviation ... 62
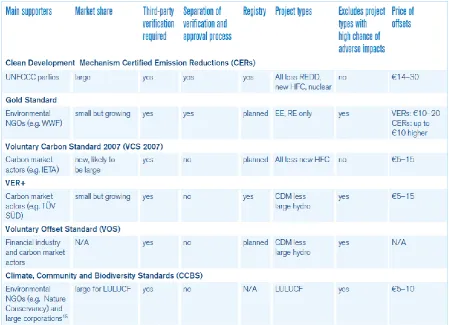
3.3 Principles of carbon offsetting ... 69
3.4 Trading Units and carbon prices ... 71
3.5 Auction of Allowances and airlines’ decisions making ... 75
3.6 Calculation of carbon dioxide emissions by ICAO ... 85
3.7 Monitoring, Reporting and Verification ... 89
3.8 Carbon Leakage ... 93
3.9 Different Carbon offsetting programs ... 96
3.9.1 ICAO and the environment ... 98
3.9.2 Voluntary carbon offsetting ... 101
3.9.3 Examples of other ETS outside of Europe ... 102
3.10 Linking Emissions Trading Schemes ... 104
3.11 Summary ... 106
4 Single European Sky ... 107
4.1 The Single European Sky concept ... 108
4.2 Functional Airspace Blocks ... 110
4.3 Charges for the ANS provision ... 119
4.4 The economics of Air Transport Management ... 124
4.5 Economic regulation of Air Navigation Services ... 133
4.6 Performance ... 153
4.6.1 KPA: Safety ... 155
4.6.3 KPA: Cost-Efficiency ... 156
4.6.4 KPA: Environment ... 157
4.7 Summary ... 173
5 Elaborations from Literature Review and Experts Consultation... 175
5.1 Multi-stakeholder Analysis and Management ... 176
5.2 Transaction Cost Economics theory and externalities ... 180
5.2.1 Transaction Costs Categories in EU ETS and SES ... 187
5.3 Summary ... 193
6 Research methodology ... 195
6.1 Research philosophy ... 195
6.2 Data collection techniques ... 198
6.2.1 Participant Observation ... 200
6.2.2 Delphi Method ... 202
6.3 Design of the instrument ... 207
6.3.1 Questionnaires design and Pilot Survey ... 209
6.3.2 Target participants and sample ... 213
6.4 Ethical considerations ... 216
6.5 Limitations of the research ... 219
6.6 Summary ... 220
7 The findings of the Delphi Method ... 223
7.1 First round of the Delphi Method ... 223
7.1.1 The EU Emissions Trading Scheme Questionnaire descriptive analysis ... 225
7.2 Second round of Delphi Method ... 238
7.2.1 The EU Emissions Trading Scheme Questionnaire descriptive analysis (2nd round) . 241 7.2.2 The Single European Sky Questionnaire descriptive analysis (2nd round) ... 247
7.2.3 Comparison of the common questions of SES and EU ETS Questionnaires ... 254
7.2.4 Cross Tabulation of SES and EU ETS questionnaires (2nd round) ... 256
7.3 Summary ... 296
8 Discussion ... 299
8.1 Aviation Governance ... 299
8.1.1 Member States Readiness ... 300
8.1.2 Incentive Scheme ... 311
8.1.3 Trade-offs between the KPAs ... 312
8.2 Multi-Stakeholder Governance in Aviation ... 314
8.2.1 The Positions of the Stakeholders ... 316
8.2.2 The level of influence and interest ... 321
8.2.3 The group/coalition of stakeholders ... 327
8.3 Summary ... 329
9 Conclusion ... 331
9.1 Conclusion for EU ETS and SES ... 331
9.2 Contribution of the PhD thesis to the body of existing knowledge ... 333
9.2.1 Contribution to the policy makers and the aviation practitioners ... 335
9.2.2 Contribution to the methodology theory ... 360
9.3 Conclusions for the Research Questions ... 361
9.5 Directions for further research ... 371
Reference List ... 373
Appendices ... 1
Appendix 1: Definitions of key terms and concepts ... 1
Appendix 2: Key features of the EU ETS for aviation (EC, 2013:16) ... 1
Appendix 3: DANUBE FAB Performance Plan (Draft version) ... 1
Appendix 4: Pilot Survey questionnaire ... 1
Appendix 5: 1st round Questionnaire: EU ETS and Aviation ... 1
Appendix 6: 1st round Questionnaire: SES/FABs and the Environment ... 1
Appendix 7: 2nd round Questionnaire: EU ETS and Aviation ... 1
Appendix 8: 2nd round Questionnaire: SES/FABs and the Environment ... 1
Appendix 9: Permission to use copyright material ... 1
TABLE OF FIGURES
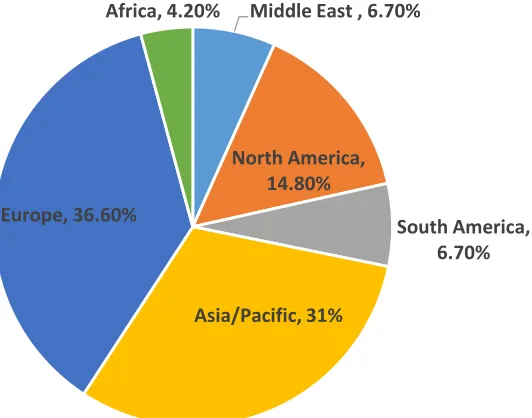
Figure 1: Estimated regional share of CO2 from international aviation in 2020 without a regulatory intervention (Based on ICAO Doc 10018, 2013) ... 4Figure 2: The performance tree (Source: Adapted from Lebas, l995 (Neely, 2004: 69) ... 7
Figure 3: Air Navigation Services categories ... 15
Figure 4: Implementing tax to correct the impact of negative externalities ... 33
Figure 5: Market for pollution permits ... 35
Figure 6: Functions of the marginal cost of reducing pollution for two airlines ... 38
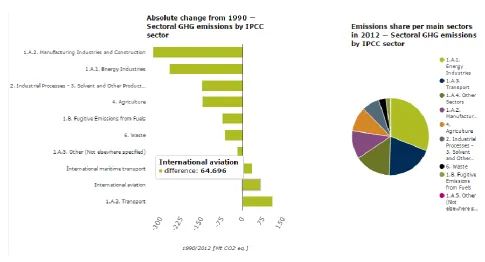
Figure 7: Sectoral GHG emissions by IPCC sector (EEA, 2016)... 41
Figure 8: World population exposed to noise exceeding 55DNL (ICAO, 2013a) ... 43
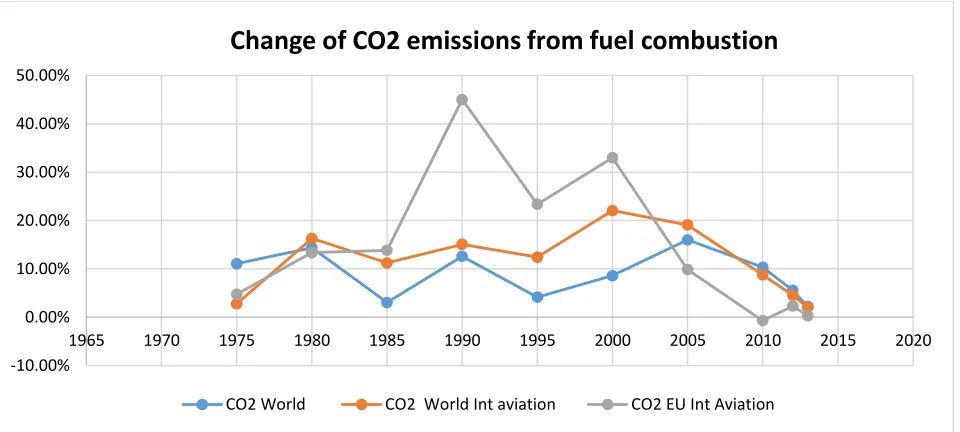
Figure 9: Changes in the proportion of CO2 emissions from EU and World international aviation and total CO2 emissions from all the industries (Data based in IEA statistics, 2015) ... 48
Figure 11: Emission calculation procedure of carbon dioxide from the ICAO (2014b) ... 86
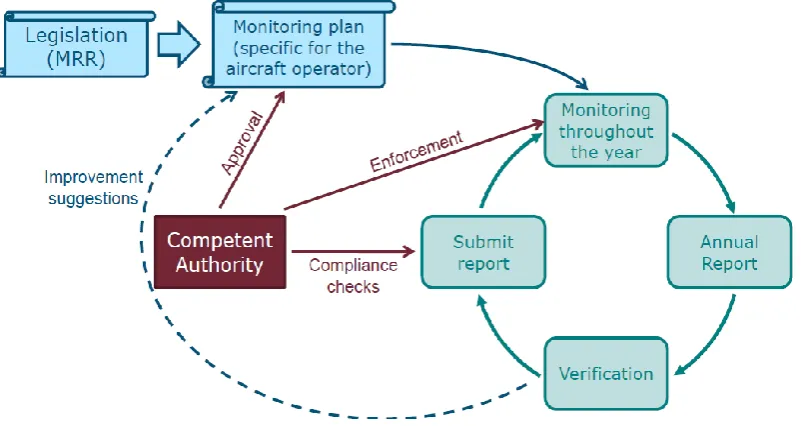
Figure 12 The compliance cycle of EU ETS ... 91
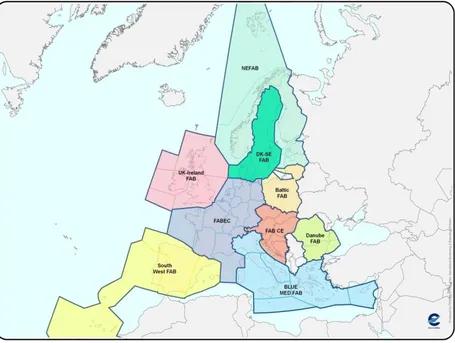
Figure 13: The geographical scope of FABs (EUROCONTROL, 2016a) ... 112
Figure 14: Traffic complexity scores (EUROCONTROL, 2016a: 13) ... 115
Figure 15: Average annual flight growth 2014-2021 per state (EUROCONTROL, 2015a) ... 117
Figure 16 Average Annual Growth per FAB, 2021 v 2014 (EUROCONTROL, 2015a) ... 118
Figure 17: Drivers for ANSP cooperation (Singh, 2011: 343) ... 128
Figure 18: Price and Quantity in monopoly market ... 131
Figure 19: Economies of scale versus subadditivity ... 132
Figure 20: PRU Framework for Cost Effectiveness Analysis (PRU, 2004: vii) ... 141
Figure 21: Example of regulated ANSP under uncertainty (Train, 1991: 102) ... 149
Figure 22: Evolution of horizontal flight efficiency (actual and flight plan) (2008-2015) (FAA and EUROCONTROL, 2016) ... 161
Figure 23: The planning process of an optimized Flight Plan Routing (ICAO Doc 030, 2013) ... 162
Figure 24 General CDO concept (EUROCONTROL, 2011a: 2) ... 165
Figure 25: Use of CDRs (EUROCONTROL, 2013: 22) ... 168
Figure 26: Conditional Routes (CDR) during one peak day ... 168
Figure 27: Free Route Airspace Implementation 2014-2019 (NM, 2015) ... 171
Figure 28: The research onion (Saunders et al., 2015) ... 196
Figure 29: The Research Journey ... 208
Figure 30: Connection between SES (FABs) and EU ETS (1st round of EU ETS Q) ... 231
Figure 31: Connection between SES (FABs) and EU ETS (1st round of SES Q)... 238
Figure 32: The Global Competitiveness Index framework (WEF, 2015) ... 301
Figure 33: Comparison of the Netherlands with the advanced economies in the 12 pillars of GCI (1: low score and 7: high score) (WEF, 2015: 276)... 303
Figure 34: The most problematic factors for doing business in the Netherlands (WEF, 2015) ... 304
Figure 35: The main National Stakeholders involved in ATM in the Netherlands (LSSIP the Netherlands, 2015) ... 305
Figure 36: The most problematic factors for doing business in Greece (WEF, 2015) ... 306
Figure 37: Comparison of Greece with the advanced economies in the 12 pillars of GCI (1: low score and 7: high score) (WEF, 2015: 276) ... 306
Figure 39: Comparison of Greece and The Netherlands(1: low score and 7: high score) (created by
the author based on WEF, 2015) ... 309
Figure 40: Two alternative routes between Milan and Brindisi ... 314
Figure 41: Aeronautical data chain stakeholders (Dutch Ministry of Infrastructure and the Environment, 2013:7) ... 315
Figure 42: Multi-stakeholder theory of governance in aviation (based on Schwab and WEF, 2007) ... 316
Figure 43: The biofuel journey from production to consumption (Source: own elaboration) ... 337
Figure 44: EU ETS and other policies for carbon neutral growth (source: own elaboration) ... 356
Figure 45: Problems and recent interventions in aviation (source: own elaboration) ... 357
Figure 46: Aviation Policies for Environment (source: own elaboration) ... 363
TABLE OF TABLES
Table 1: Research about Aviation and the environment ... 18Table 2: CO2 emissions from EU and World international aviation and total CO2 emissions from all the industries (IEA statistics, 2015) ... 48
Table 3: The four phases of the Kyoto Protocol ... 60
Table 4: A comparison of CERs and VERs (IATA, 2008a) ... 72
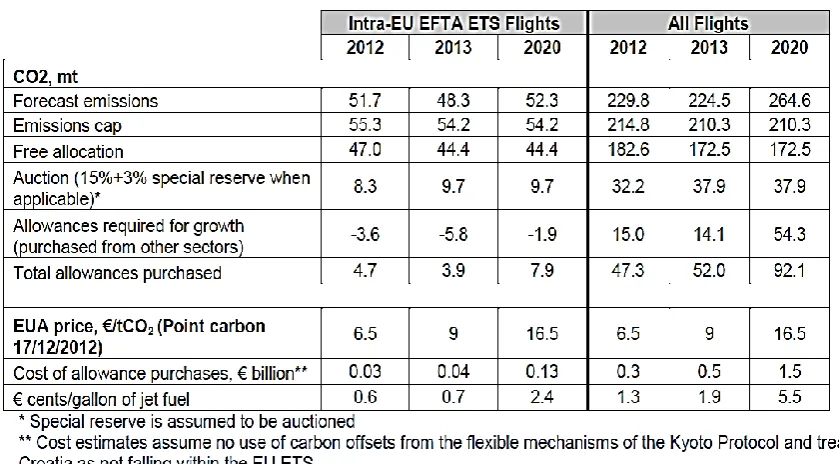
Table 5 Cost of purchasing allowances in EU ETS (IATA, 2013b) ... 74
Table 6 German early auctions of the third trading period (Early Auctions) and the EUAA auction of 2012 (DEHSt, 2012) ... 78
Table 7: EUAA auction in 2012 (EEX, 2012) ... 78
Table 8: EUAAs Spot Primary Market Auction Report 2015 (EEX, 2016) ... 79
Table 9: Some project types (IATA, 2008a) ... 97
Table 10: US/EUROPE Key ATM System Figures (EUROCONTROL and FAA, 2013) ... 107
Table 11: Functional Airspace Blocks ... 113
Table 12: Cost-bases and national unit rates for 2016 (EUROCONTROL, 2016c) ... 123
Table 13: Organisation and Corporate arrangements of the ECAA states (Efthymiou et al, 2016) 137 Table 14: Price cap versus rate of return regulation (Armstrong and Sappington, 2007:1608) ... 150
Table 16: Power-Interest Matrix (Johnson and Scholes, 2010; Olander, 2007) ... 179
Table 17: Transaction costs categories for policymakers/regulators emerging from the Performance scheme regarding the KPA of environment (Source: own elaboration)... 188
Table 18: Transaction costs categories for airlines deriving from the inclusion of aviation in EU ETS (Source: own elaboration) ... 190
Table 19: Transaction costs categories for policy makers/regulators deriving from the inclusion of aviation in EU ETS (Source: own elaboration) ... 191
Table 20: Use of Delphi method ... 204
Table 21: The Research Validation Strategies followed by the researcher (based on Creswell, 2012) ... 218
Table 22: Q1 Position of participants on EU ETS (1st round EU ETS Q) ... 226
Table 23: Question about the impact of different allowance allocation methods (1st round EU ETS Q) ... 228
Table 24: Ideal allocation method (1st round EU ETS Q) ... 228
Table 25: Factors to be considered for linking different ETSs (1st round EU ETS Q) ... 229
Table 26: Factors leading to carbon neutral growth (1st round EU ETS Q) ... 230
Table 27: Areas benefitted from the establishment of FABs (1st round SES Q) ... 232
Table 28: Position of participants on SES and the environment (1st round SES Q) ... 233
Table 29: Factors affecting horizontal en route flight efficiency (1st round SES Q) ... 234
Table 30: Factors affecting the Civil Military cooperation (1st round SES Q) ... 235
Table 31: Factors contributing to emissions’ reduction (1st round SES Q) ... 235
Table 32: Factors leading to carbon neutral growth (1st round SES Q) ... 236
Table 33: Q1 Position of participants on EU ETS (2nd round EU ETS Q) ... 242
Table 34: Ideal allocation method (2nd round EU ETS Q) ... 243
Table 35: Factors to be considered for linking different ETSs (2nd round EU ETS Q) ... 244
Table 36: Factors leading to carbon neutral growth (2nd round EU ETS Q) ... 245
Table 37: Transaction costs categories (2nd round EU ETS Q) ... 246
Table 38: Areas benefitted from the establishment of FABs (2nd round SES Q) ... 247
Table 39: Position of participants on SES and the environment (2nd round SES Q) ... 248
Table 40: Factors affecting horizontal en route flight efficiency (2nd round SES Q) ... 250
Table 41: Factors affecting the Civil Military cooperation (2nd round SES Q) ... 251
Table 42: Factors contributing to emissions’ reduction (2nd round SES Q) ... 252
Table 44: Transaction costs categories (2nd round SES Q) ... 254
Table 45: Differences of EU ETS and SES questionnaire participants of opinions about the factors leading to carbon neutral growth ... 255
Table 46: Crosstab Groups positions on EU ETS ... 260
Table 47: Crosstab Groups points on allocation methods ... 265
Table 48: Crosstab Groups opinion on factors to be considered for linking different ETSs ... 266
Table 49: Crosstab Groups and factors leading to carbon neutral growth ... 268
Table 50: Crosstab Groups and Transaction Cost categories ... 271
Table 51: Crosstab Groups and importance of transaction costs ... 274
Table 52: Crosstab Areas benefitted from the establishment of FABs and Groups ... 274
Table 53: Crosstab Position of participants on SES and the environment and Groups... 279
Table 54: Crosstabs Factors affecting horizontal en route flight efficiency and Groups ... 281
Table 55: Crosstabs Factors affecting the Civil Military cooperation and Groups ... 284
Table 56: Crosstab Factors contributing to emissions’ reduction and Groups ... 287
Table 57: Crosstab Factors leading to carbon neutral growth and Groups ... 291
Table 58: Crosstab Transaction Costs in SES and Groups ... 294
Table 59: Sustainable Growth Sub-index in the 2014 Edition and Global Competitiveness Index 2015–2016 (based on WEF, 2014; WEF, 2015) ... 301
Table 60: Environment KPI #1: Horizontal en-route flight efficiency [%] (NM, 2016)... 309
ACRONYMS AND ABBREVIATIONS
A4A Airlines of America
AAIASB Air Accident Investigation and Aviation Safety Board
AAUs Assigned Amount Units
ACC Area Control Centre
ACCRI Aviation Climate Change Research Initiative
A-CDM Airport Collaborative Decision Making
ACE ATM Cost-Effectiveness Benchmarking Reports
ACR American Carbon Registry
ADS-B Automatic Dependent Surveillance – Broadcast
AEA Association of European Airlines
AER Annual Emissions Report
AGE Aviation-Grade Ethanol
AIC Aeronautical Information Circulars
AIM Aeronautical Information Management
AIP Aeronautical Information Publication
AIREG Aviation Initiative For Renewable Energy” In Germany
AIS Aeronautical Information Services
AMC Airspace Management Cell
ANSP Air Navigation Service Provider
AO Aircraft Operator
AOC Air Operator Certificate
AoR Area Of Responsibility
APP Approach Control Unit
APU Auxiliary Power Unit
ARN Airspace Route Network
ASA Air Services Agreement
ASKs Available Seat Kilometres
ASM Available Seats Miles
ASM Airspace Management
ASMA Arrival Sequencing And Metering Area
ATAG Air Transport Action Group
ATC Air Traffic Control
ATCEUC Air Traffic Controllers European Union’s Coordination
ATCO Air Traffic Controller
ATFCM Air Traffic Flow And Capacity Management
ATFM Air Traffic Flow Management
ATM Air Transport Management
ATM Air Traffic Management
ATS Air Traffic Service
ATSU Air Traffic Service Unit
BTL Biomass-To-Liquid
BULATSA Bulgarian Air Traffic Services Authority
CA Competent Authority
CAA Civil Aviation Authority
CAAFI Aviation Alternative Fuels Initiative
CAEP Committee On Aviation Environmental Protection
CAP Civil Aviation Publication
CARF Charges For Airports And Route Air Navigation Facilities
CBAs Cross-Border Areas
CCD Climb, Cruise And Descent
CCM Command And Control Measures
CCS Carbon Capture And Sequestration
CDA Continuous Descent Approach
CDM Clean Development Mechanism
CDM Collaborative Decision Making
CDO Continuous Descent Operations
CDR Conditional Route
CEC Carbon Emissions Calculator
CER Certified Emissions Reduction
CFIT Controlled Flight Into Terrain
CH 4 Methane
CJEU Court of Justice of the European Union
CLEEN Continuous Lower Energy, Emissions And Noise
CNS Communications, Navigation And Surveillance
CO Carbon Monoxide
CO2 Carbon Dioxide
COOPANS COOPeration between Air Navigation Services
CORSIA Carbon Offsetting and Reduction Scheme For International Aviation
COSIA Carbon Offsetting Scheme For International Aviation
CRCO Central Route Charges Office
CTL Coal-To-Liquids
CV Coefficient of Variation
DCs Deducted Costs
DCT Direct Routing
DEHSt German Emissions Trading Authority
DFS Germany - Deutsche Flugsicherung
DG CLIMA Directorate-General Climate Action
DNL Day-Night Average Sound Level
DoT Department Of Transport
DSNA Direction Des Services De La Navigation Aérienne
DUR Determined Unit Rate
EANS Estonian Air Navigation Services
EASA European Aviation Safety Agency
EC European Commission
ECAA European Common Aviation Area
ECAC European Civil Aviation Conference
ECCP European Climate Change Programmes
EEA European Economic Area
EEA European Environmental Agency
EEX European Energy Exchange
EFT European Transport Workers Federation
EIG Emissions Inventory Guidebook
EIT Economies In Transition
ELFA European Low Fares Airline Association
ENAC Italian Civil Aviation Authority
ENAV Ente Nazionale Di Assistenza Al Volo
EP European Parliament
ERA European Regions Airlines Associations
ERNIP European Route Network Improvement Plan
ERU Emission Reduction Unit
EU European Union
EU ETS European Union Emissions Trading Scheme
EUAAs Eu Aviation Allowances
FAA Federal Aviation Administration (Usa)
FAB Functional Airspace Block
FAF Final Approach Fix
FAIR STREAM
FABEC ANSPs and AIRlines in SESAR TRials for Enhanced Arrival Management
FDP Flight Data Processing
FEP Flight Efficiency Plan
FIAs FAB Improvement Areas
FIRs Flight Information Regions
FLOSYS Flight Optimisation System
FRAM Free Route Airspace Maastricht
FSNCs Full Service Network Carriers
FSTD Flight Simulation Training Device
FUA Flexible Use Of Airspace
GCAA General Civil Aviation Authority
GCD Great Circle Distance
GCI Global Competitiveness Index
GCM Global Climate Model
GCR Global Competitiveness Report
GDP Gross Domestic Product
GEF Global Environment Facility
GFAAF Global Framework For Aviation Alternative Fuels
GHG Green House Gas
GMBM Global Market Based Measures
GS Gold Standard
GTL Gas-To-Liquids
GWP Global Warming Potential
HAF/SAR Hellenic Air Force- Search and Rescue Service
HANSA Hellenic Air Navigation Supervisory Authority
HANSP Hellenic Air Navigation Service Provider
HCAA Hellenic Civil Aviation Authority
HCAA/REGS Hellenic Civil Aviation Authority – Regional Services
HEFA Hydroprocessed Esters And Fatty Acids
HFC Hydrofluorocarbons
HGCC High Level Group On International Aviation And Climate. Change
H-MANSOD Hellenic Military Air Navigation Services Oversight Division
HNMS Hellenic National Meteorological Service
HRJ Hydrogenated Renewable Jet Fuel
IAA Irish Aviation Authority
IATA International Air Transport Association
ICAO International Civil Aviation Organization
ICB Industry Consultation Body
ICCT International Council On Clean Transportation
IFR Instrument Flight Rules
ILS Instrument Landing System
IPCC Intergovernmental Panel On Climate Change
ISIS Implementation Of Single European Sky In South East Europe
ITAKA Initiative Towards Sustainable Kerosene For Aviation
ITC Institutional Transaction Costs
JI Joint Implementation
KEA Key Performance Environment Indicator Based on Actual Trajectory
KEP Key Performance Environment Indicator Based on Last Filed Flight Plan
KPA Key Performance Area
KRIs Key Result Indicators
LAQ Local Air Quality
LCA Life-Cycle Assessment
LCC Low Cost Carrier
LGS Latvijas Gaisa Satiksme
LR Liability Rules
LSSIP Local Single Sky Implementation
LTO Landing-Take Off
LULUCF Land Use, Land Use Change And Forestry
LVC The Netherlands Air Traffic Committee
LVNL Air Traffic Control The Netherlands
MAA Military Aviation Authority
MATS Malta Air Traffic Services
MB Marginal Benefit
MBM Market Based Measures
MEC Marginal External Cost
MEP Member Of European Parliament
MET Meteorological Services For Air Navigation
MFUR Most Frequent Used Route
MITaN Ministry of Infrastructure, Transport & Networks
MND Ministry of National Defence
MoD Ministry of Defence
MoI&M Ministry of Infrastructure and the Environment
MoU Memorandum Of Understanding
MP Monitoring Program
MPC Marginal Private Cost
MS Member State
MSC Marginal Social Cost
MSG Multi-Stakeholder Governance
MSR Market Stability Reserve
MUAC Maastricht Upper Area Control Centre
N2O Nitrous Oxyde
NADP Noise Abatement Department Procedure
NCP Nsa Coordination Platform
NGOs Non-Governmental Organisations
NM Network Manager
NMVOC Non-Methane Volatile Organic Compounds
NOTAM Notice To Airmen
NOx Nitrogen Oxides
NSA Navigation Service Authorities
O3 Ozone
OAG Official Airline Guide
OCC Operational Control Centres
OECD Organisation For Economic Co-Operation And Development
OLDI On-Line Data Interchange
Pax Passengers
PCA Prior Coordination Airspace
PCI Gross Domestic Product (GDP) Per Capita Income
PEL Planned Entry Level
PFC Perfluorinated Hydrocarbons
PI Performance Indicators
PKPs Passenger Kilometres Performed
PPP Private Public Partnership
PR Property Rights
PRB Performance Review Body
PRC Performance Review Commission
P-RNAV Precision-Area Navigation
PRU Performance Review Unit
PSO Public Service Obligation
QAS Quality Assurance Standard For Carbon Offsetting
R&D Research And Development
RAD Route Availability Document
RCA Reduced Coordination Airspace
RED Renewable Energy Directive
REDD+ Reduced Emissions From Deforestation And Degradation
RF Radiative Forcing
RIMS Ranging And Integrity Monitoring Station (GNSS-1/EGNOS)
RIs Result Indicators
RNLAF Royal Netherlands Air Force
ROMATSA Romanian Air Traffic Services Administration
RP Reference Period
RPKs Revenue Passenger Kilometres
RSD Relative Standard Deviation
RSO Route Per State Overflown
RVSM Reduced Vertical Separation Minimum
RVT Remote and Virtual Tower
SA Stakeholder Analysis
SAAM System For Traffic Assignment And Analysis At A Macroscopic Level
SAFUG Sustainable Aviation Fuel Users Group
SAM Supply Adjustment Mechanism
SAR Search And Rescue
SARPs Standards And Recommended Practices
SD Standard Deviation
SEA Strategic Environmental Assessment
SES Single European Sky
SESAR Single European Sky ATM Research
SF6 Sulfur Hexafluoride
SFC Specific Fuel Consumption
SID Standard Instrumental Departure
SLA State Level Agreement
SO2 Sulphur Dioxide
SOX Oxides Of Sulphur
SRA Safety Risk Assessment
SSC Single Sky Committee
SSP State Safety Programme
STAR Standard Terminal Arrival Route
SUA Special Use Airspace
SWAFEA Sustainable Ways for Alternative Fuels and Energy for Aviation
TC Transaction Cost
TCE Transaction Costs Economic
TEC Total Economic Cost
TED Total Environmental Degradation
TMA Terminal Manoeuvring Area
TOD Top-Of-Descent
TSU Terminal Service Unit
TWR Terminal Control
UHC Unburned Hydrocarbons
UIR Upper Information Region
UNDP United Nations Development Programme
UNECE United Nations Economic Commission For Europe
UNFCCC United Nations Framework Convention On Climate Change
USA United States Of America
USOAP Universal Safety Oversight Audit Programme
VCS Verified Carbon Standard
VCS Voluntary Carbon Standard
VER Voluntary Emission Reductions
VOC Volatile Organic Compounds
WCI Western Climate Initiative
WEF World Economic Forum
1 Introduction
The air traffic control is the mainstay of civil aviation. Aviation is a cross-border activity, yet
the air traffic management is organised in a fragmented way. This fragmentation impacts
safety, limits capacity, increases costs and slows down the decision-making process. The
airspace should therefore be organised according to the requirements of "Functional
Airspace Blocks" regardless of national borders. 'Functional Airspace Block' means an
airspace block based on operational requirements, reflecting the need for integrated
management of the airspace regardless the existing boundaries of Flight Information
Regions (FIR's) (EC 549/2004).
The fragmentation of European Union airspace into 27 national systems of air traffic gave
rise to a number of problems (EC, 2015). For this reason, the creation of a ‘Single
European Sky’ (SES) was promoted. The aim of this reform is to meet the needs for
improved capacity and safety. The main objectives are to restructure the European
airspace traffic, to create additional capacity and to increase the overall efficiency of the
Air Traffic Management (ATM) system. Its four pillars are: a) to achieve better performance
and more efficient response to environmental challenges, b) to increase the levels of flight
safety, c) to utilise new technology, and d) to increase airport capacity, efficiency and
safety.
Functional Airspace Blocks (FABs) are directly related to the Single European Sky and
environmental performance. The establishment of Functional Airspace Blocks was aimed
at the efficient use of airspace, improving system efficiency of air traffic management,
reducing costs, which would be achieved by saving fuel, reducing distances and improving
difficult and time-consuming, as it requires the consent of the countries concerned, as well
as civil and military cooperation.
An equally important issue is the air pollutant emissions. In 2009, the European Union
decided to include aviation in the EU Emissions Trading Scheme (EU ETS). By 2012, the
airline industry set out a CO₂ emission ceiling, initially set at 97% of 2005 emission levels
by 2013 and then at 95%. All carriers flying to and from the European Economic Area
(EEA) must pay an amount for each excess tonne of CO₂ emitted on a flight to and from
(and within) the EEA. Airspace users are required to monitor the annual emissions for
each flight. These data should then be aggregated to an annual emissions report to be
audited by an independent accredited verifier. The operator should provide the
corresponding number of allowances. If actual emissions are lower than the operator’s
rights/allowances, they can sell their excess allowances on the market or "bank" them to
cover future emissions. If they predict that their emissions will exceed their rights, they can
take action to reduce their emissions and/or buy additional rights/allowances. Airlines can
also buy emission credits from clean energy projects carried out in third countries under
the mechanisms of the Kyoto Protocol. The existence of a market in which these rights can
be traded allows businesses to manage their emissions in a cost-effective way.
1.1 Rationale of the research
Air transportation traffic from 1945 to 1973, which is the first oil crisis, grew at double-digit
rates according to IATA.org (2016a). Due to technological improvements and technical
innovation, mainly the introduction of turbo-propeller aircraft in the early 1950s,
transatlantic jets in 1958, wide-bodied aircraft and high by-pass engines from 1970
onwards, the air traffic grew even further. A number of factors, including higher speeds,
greater size, and better unit cost control offered more affordable air tickets, in combination
According to Oxford Economics (2011), air transport generates three distinct types of
economic benefit. Aviation creates jobs and tax revenues, contributes to Gross Domestic
Product (GDP). Air transportation is vital for remote regions. The increased connectivity
due to aviation represents an important infrastructure asset that enhances direct
investments, economic agglomeration and other spill over impacts on the production
capacity of an economy. For all those reasons, air transportation plays an extremely
important social role. It connects people. It connects core regions with periphery regions.
In 1948, there were 120 flights across the Atlantic per week, whereas nowadays there are
more than 1,200 flights per day in the North Atlantic airspace alone (ATAG, 2014).
Having said that, this traffic increase is not considered sustainable. The rapid air transport
growth has created a series of environmental problems from noise pollution to climate
change. The negative externalities caused by aviation are in parallel in proportion to the
traffic growth. Aviation produces around 2% of the world’s man-made emissions of carbon
dioxide (CO2), according to the United Nations Intergovernmental Panel on Climate
Change (IPCC). The IPCC (1999) forecasts that the aviation’s share of global man-made
CO2 emissions will increase to around 3% in 2050. According to the Aviation Environment
Federation (2016), aviation is one of the most energy- and carbon-intensive forms of
Figure 1: Estimated regional share of CO2 from international aviation in 2020 without a
regulatory intervention (Based on ICAO Doc 10018, 2013)
Climate change is affecting aviation operations in many ways according to a European
Aviation Environmental Report of 2016 (EASA, EEA and EUROCONTROL, 2016). Due to
climate change, there will be more frequent heavy rain in Northern Europe, reducing the
number of landings and take-offs at airports. The increase in the air temperatures affects
the performance of the aircraft as well as the airports’ surface areas. Storms can become
larger, more frequent and powerful leading to more flight delays or cancellations. Changes
in snow cover can, on the one hand, reduce the snow-related delays, but on the other
hand, there might be more severe snow-incurred incidents in areas previously
unaccustomed to such weather phenomena. The long-term rise of the sea level will affect
coastal airports. Finally, climate change leads to constant changes in the wind direction.
This increases runways crosswinds reducing airport capacity and increasing delays in
flight movements.
The second pillar of the lack of sustainable development is that the growth in traffic is not
paired with the necessary infrastructure development. The traffic is putting pressure to the Middle East , 6.70%
North America, 14.80%
South America, 6.70%
Asia/Pacific, 31% Europe, 36.60%
airports and to the Air Navigation Service Providers (ANSPs). The number of flights has
increased by 80% between 1990 and 2014, and is forecasted to grow by a further 45%
between 2014 and 2035 (EASA, EEA and EUROCONTROL, 2016). The number of the
airports though is not increasing at the same pace. In addition, the airspace size cannot be
increased.
Passenger arrivals constitute evidence of the increase in traffic over the last decades. The
number of airports, the available aircraft and the number of airlines are not always
considered representative indicators of the traffic growth. The number of USA airports in
1980 was 15,161. There were 4,814 public use airports and 10,347 private use airports. In
2014, there were 19,299 airports, out of which 5,145 were for public use and 13,863 were
private use airports, according to the Bureau of Transport Statistics of the Department of
Transportation (2016). The available airplanes for service (domestic and international) in
1960 were 2,135 operated by 55 carriers and, in 2006, there were 6,758 available
airplanes operated by 66 carriers. In 1960, there were 2,566 thousands of passenger
arrivals and in 2006 the same figure reached 62,951 thousands of passenger arrivals in
USA airports (DoT, 2016).
The USA case proves that the rate of growth in passenger traffic is not the same with the
rate of growth in the number of airports and airlines. The number of runways has
increased and qualitative improvements have been made, but this does not eliminate the
congestion in some airports. Nowadays, airplanes offer more Available Seats Miles (ASM),
since there are more wide-bodied aircraft available or two-deck airplanes, such as Airbus
A380 that offers around 550 seats. Due to competition, airlines experienced consolidation
through mergers and acquisitions. On the other hand, expanding or developing an airport
is considered a highly expensive investment, thus emphasis seems to be given to optimal
This is the problem that the aviation is facing nowadays: growth is not sustainable. The
question that arises is whether there is any solution to this. The solution is two-fold, supply
management policies and demand management policies. The supply chain management
focuses on time-efficient movement of resources and on the integration of the various
functions and pressures. Expansion in structural elements like buildings requires large
capital investments that are difficult to reverse (Bozarth, 2016). Building new airports might
be expensive but sometimes it is necessary. In the case of airspace though, expansion is
not an option. The only solution in this case is to optimise the use of the airspace.
From the demand management point of view, sustainable growth can be achieved by
revenue management or by taxation. In terms of revenue management, congestion pricing
or peak pricing can be a solution. Congestion pricing can be applied as charging more for
longer and complex routes. In terms of peak pricing, this can be applied as charging more
for routes operated during peak hours. Another alternative can be taxation on the fuel
consumption or economic incentives for better environmental performance, such as
Market Based Measures (MBM). All those demand management strategies aim to improve
the environmental performance of aviation.
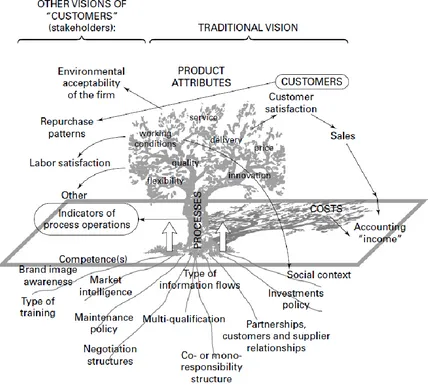
Performance is a complex concept that describes the capability of generating results.
Figure 2 depicts a causal model that links the outcome (often reduced to output and
results), the processes and the foundations. This model is portrayed as a tree to illustrate
how an organization goes through the process of performancing. The analogy to a tree
Figure 2: The performance tree (Source: Adapted from Lebas, l995 (Neely, 2004: 69)
Performance can be expressed as a set of variables or indicators that are complementary,
or occasionally contradictory. Performance measures can be classified as follows
(Parmenter, 2015):
1. Performance Indicators (PIs) express what needs to be achieved.
2. Key Performance Indicators (KPIs) express what needs to be achieved to
drastically improve performance.
3. Result Indicators (RIs) express what has already been achieved in general.
4. Key Result Indicators (KRIs) express what has been achieved according to a
Another approach of describing performance indicators is given by Samsonowa (2012). In
general, Performance Indicator (PI) can be described as an auxiliary metric that partially
reflects the performance of an organizational unit. Regulation 390/2013 considers
performance indicators as indicators used for the purpose of performance monitoring,
benchmarking and reviewing of performance schemes for air navigation services and
network functions.
Both supply management policies and demand management policies intent to address
sustainable development. They seek to achieve the same target through different means.
An important element is the possible cancelling-out and/or overlapping effects, that one
scheme can cause to the other. The aim should be to develop synergies between the two
policies and have a systemic approach to environmental problems.
Single European Sky (SES) focuses on the provision of Air Navigation Services (ANS)
related to the supply management. ANS include the following services: air traffic
management (ATM), communications, navigation and surveillance (CNS), meteorological
services for air navigation (MET), search and rescue (SAR) and aeronautical information
services/aeronautical information management (AIS/AIM), as stated in ICAO Document
9161 (2013). Air Navigation Service Providers are offering ANS to airlines during all
phases of operations, i.e. approach, aerodrome and en route. The European Commission
implemented SES to regulate ANS and improve the efficiency of ANSPs towards a more
sustainable growth. One of the Key Performance Areas (KPAs) SES is focusing on is the
Environment. Through the creation of Functional Airspace Blocks (FABs), the SES aims to
improve the airspace architecture and optimise its use by airspace users.
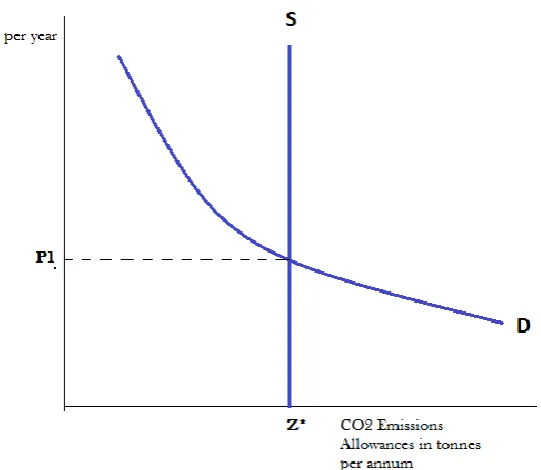
On the other hand, the inclusion of aviation in the European Union Emissions Trading
Scheme (EU ETS) is related to the demand management. EU ETS is a Market Based
'cap', or limit, is set on the total amount of certain greenhouse gases that can be emitted
by the airlines operating between aerodromes in the European Economic Area (EEA). The
cap is reduced over time so that total emissions decrease. Within the cap, airspace users
receive or buy emission allowances that they can trade with one another as needed. They
can also buy or sell limited amounts of international credits from emission-saving projects
around the world. The limit on the total number of allowances available ensures that they
have a value. As a result, airspace users in the European airspace are regulated through a
demand management policy. The regulator in EU ETS is the European Commission and
the Competent Authorities.
Both SES and EU ETS aim to tackle the negative externalities of aviation. The European
Commission (EC) in collaboration with the Member States regulates both regulatory
schemes. However, the problem that arises is that, although both schemes are centralised
to the EC, they are handled by different departments/directorates. The Commission is
divided into several departments and services. The departments are known as
Directorate-Generals (DGs). SES is regulated by Directorate-General Mobility and Transport (DG
MOVE) and EU ETS is regulated by Directorate-General Climate Action (DG CLIMA).
The research gap that can be detected in the schemes concerns the potential existence of
any cancelling-out and/or overlapping effects in the supply management, that is the SES,
and demand management, that is the EU ETS policies. Moreover, the rationale of the
present thesis is to research whether there is any governance failure in the full
implementation and efficiency of the schemes following a holistic view, by simultaneously
examining demand and supply management.
1.2 Research Aim and Research Questions
This study aims to analyse the aviation governance in terms of the environmental
effectiveness of the Single European Sky and European Union Emissions Trading Scheme
in the area of environment. Finally, this research seeks to uncover any implementation
issues for the Single European Sky and EU Emissions Trading Scheme reforms and
provide suitable recommendations for policy makers.
In order to achieve this aim the study will seek to provide answers to the following
research questions:
1. Are aviation operations sustainable and what are the factors leading to sustainable
growth?
2. How does the market environment and structure, in which the Single European Sky
(SES) and the European Union Emissions Trading Scheme (EU ETS) are
implemented, affect the efficiency of the schemes?
3. Can the inclusion of aviation in the European Union emissions Trading Scheme
and/or Single European Sky lead to carbon-neutral growth?
4. Can the effective implementation of SES render the EU ETS redundant and are the
environmental targets overlapping?
5. What do the research findings reveal about any issues the SES and the EU ETS
reforms are facing and how can these findings be used to improve the aviation
environmental performance and achieve a more sustainable growth?
To address the above research questions, it was necessary to examine the literature
review, to better understand the nature of the problem as well as the nature of the market.
Emphasis has been given to the theoretical overview and critical analysis of carbon trading
and airspace management and harmonisation (charges, operating benefits, conditions for
success, practical obstacles and addressing their legislative-regulatory framework,
economic and technical issues, etc.). In order to get a better insight into the management
EUROCONTROL is the Network Manager of SES and is responsible for Monitoring and
Reporting of EU ETS (aviation area). Additionally, experts from different countries were
interviewed and asked about their opinion on the efficiency of the schemes. This process
is described in detail in the Methodology Chapter.
1.3 Research Context
The first step for this study was to set the boundaries within which it would be carried out
by identifying the stakeholders involved in the reform of the European sky and the
regulation of the negative externalities. A stakeholder is defined as any entity with a
declared or conceivable interest or stake in a policy matter. Moreover, stakeholders are
those who are affected by the outcome or those who can affect the outcome of a proposed
development intervention (World Bank, n.d.). The range of stakeholders relevant to
consider for analysis varies according to the complexity of the area targeted. Stakeholders
can be of any form, size and capacity. They can be individuals, organisations or
unorganised groups. In most cases, stakeholders fall into one or more of the following
categories: international actors (e.g. EUROCONTROL), national or political actors (e.g.
legislators, governors), public sector agencies (e.g. EASA), interest groups (e.g. trade
unions, airline associations), commercial/private for-profit and non-profit organizations
(NGOs, foundations), civil society members, and users/consumers.
Moreover, aviation plays a crucial social role for a country or region. Aviation offers
connectivity to states with other states or periphery/semi-periphery regions to core regions.
After/Following the airlines’ liberalisation, the air transportation became widely available
due to lower ticket/fare prices. The passenger is one of the main stakeholders in aviation
and constitutes a central point of consideration in the regulations. The aviation is quite a
complex industry due to its multidimensional role. Aviation can act as a mechanism for a
state itself. The military dimension of aviation is different from one country to the other and
it depends by the geopolitical position of a state.
The current environment is highly deregulated and this has led to a very competitive
environment for the airlines. The role and value of airports is currently growing, as they
contribute to agglomeration and economic development of the destination and the
surrounding area. The Air Navigation Service Providers are the ones offering the
navigation services and one of the main players that will be discussed in this PhD thesis.
Furthermore, the regulators are one of the most important players in this ‘game’. The
regulators of aviation are the European Parliament and the European Council, the
European Commission and its supporting agencies. At national level, the regulators are
the Civil Aviation Authorities, the Ministries of Transport and the National Supervisory
Authorities. The employees in the aviation industry through the trade unions and the
passengers through their respective passenger associations also exercise influence over
the Parliament and the national authorities for passing regulations.
The International Civil Aviation Organisation (ICAO) is a specialised agency of the
United Nations (UN). It was created after the Convention on International Civil Aviation
(the Chicago Convention) of 1944 and it was ratified in 1947. ICAO together with its
Member States and a number of global aviation organisations develop international
Standards and Recommended Practices (SARPs).
The European Parliament is the EU's law-making body. EU voters directly elect the
parliament members every 5 years. The Parliament has three main roles: legislative,
supervisory and budgetary. The Parliament passes EU laws, together with the European
Council, based on European Commission proposals. The number of Members of the
European Parliament (MEPs) for each country is approximately proportionate to its
number cannot exceed 751 (750 plus the President). Moreover, MEPs are grouped based
on political affiliation, rather than nationality.
The European Commission (EC) was established in 1951. It is the executive body of the
European Union (EU), the only one that can propose legislation, and it is also responsible
for implementing decisions and upholding the EU treaties. The EC operates as a cabinet
government with 28 members (also called Commissioners). The EC is divided into 33
departments and services. The departments are known as Directorate-Generals (DGs).
The DG that deals directly with Aviation is Mobility and Transport (DG MOVE). The other
DGs are also related with the aviation sometimes, for instance, DG CLIMA is responsible
for the Emissions Trading Scheme.
The EC was set up from the beginning to act as an independent supranational authority
separate from governments; hence, it should act independently and remain neutral to
external influences. It should be noted though that the Commissioners are proposed by the
Member States’ governments. The EC proposes the legislation, the Council and
Parliament approve/pass the legislation and the EC is responsible to ensure, with the help
of Member States and EC Agencies (like EASA), that it is implemented.
The Civil Aviation Authorities (CAAs) is a generic term used in many countries, notably
the UK, and refers to national regulatory bodies responsible for aviation. The CAA
implements the ICAO SARPs in national legislation and are responsible for regulatory
oversight. On the other hand, the National Supervisory Authorities (NSAs) were
established by request of the EC. NSAs ensure the supervision of the regulatory
framework. Their main responsibilities include certifying and overseeing Air Navigation
Service Providers as well as preparing/drafting the national performance plans of the
Member States concerned (Reg. No 550/2004). In some states, the NSA is incorporated
independent from the ANSPs, in order to be allowed to have an effective oversight. Only in
4 out of 28 cases, a functional separation has been achieved, meaning that both NSA and
the ANSP are part of the same organisation, but are internally separated to ensure
independence of the NSA (SkyBrary, 2014). In order for NSAs to convene and discuss
issues pertinent to the SES, the NSA Coordination Platform (NCP) was established at
European level in 2009.
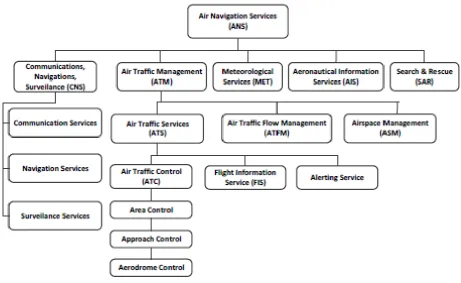
Airlines and airports rely on the Air Navigation Service Providers (ANSPs) for the
management of air traffic. Hence, Air Navigation Services (ANS) provision is considered
as a core element for air transportation. Air Navigation Services include five broad
categories of services provided to air traffic during all phases of operation (area control,
approach control and aerodrome control). These services are the following: Air Traffic
Management (ATM), Communication services, Navigation services and Surveillance
services (CNS), Meteorological services for air navigation (MET), Aeronautical Information
Figure 3: Air Navigation Services categories
Aeronautical Information Services (AIS) provide information on the availability of air
navigation services and their associated procedures necessary for the safety, regularity
and efficiency of air navigation (i.e. AIP, AIC, NOTAM, etc.). Communications, Navigation
and Surveillance (CNS) includes communication facilities, navigation services and
surveillance systems. Communication facilities have two main categories: aeronautical
fixed service and aeronautical mobile service.
In Europe, there are 37 ANSPs. Most of them are government-owned. NATS is a Private
Public Partnership (PPP). Nevertheless, according to Article 28 of the Chicago
Convention, the State is ultimately responsible for the provision and operation of air
navigation facilities and services
The European Organisation for the Safety of Air Navigation, commonly known as
EUROCONTROL, is an international organisation working to achieve safe and seamless
Single European Sky and is responsible for the Monitoring, Reporting and Verification
(MRV) of EU ETS.
The Performance Review Commission (PRC) was established in 1998 by the
Permanent Commission of EUROCONTROL. It advises EUROCONTROL’s Governing
Bodies and supports the effective management of European ANS through target-setting
and the establishment of a transparent and independent performance review system. This
system addresses all aspects of ANS, including policy and planning, safety management
at and around airports and in the airspace, as well as financial and economic aspects of
services rendered.
The PRC is responsible for enforcing implementation of the performance and target-setting
system throughout/in all EUROCONTROL’s Member States. The PRC reports directly to
the EUROCONTROL Permanent Commission through the Provisional Council on its
activities. These activities include providing advice on ANS performance issues, including
performance targets. The PRC deliverables include:
Annual performance review reports (PRR);
ATM Cost-effectiveness benchmarking reports (ACE);
Special reports on issues such as comparisons of ATM-related operational
performance in the United States and Europe.
The Performance Review Body (PRB) is composed of the 12 Members of the PRC, plus
the PRB Chairman, appointed by the European Commission. The PRB reports directly to
the European Commission. The purpose of the PRB is to assist the European Commission
in the implementation of the performance scheme and to assist the National Supervisory
Regulation No 691/2010 and Regulation No 390/2013. The PRB tasks include but are not
limited to the following:
collection, examination, validation and dissemination of performance-related data;
definition of new or adaptation of key performance areas and the related key
performance indicators;
setting up or revision of EU-wide performance targets;
consistency assessment of adopted performance plans, including performance
targets, with the EU-wide targets;
assessment of the revised performance targets or the corrective measures taken by
the EU Member States;
monitoring, benchmarking and reviewing of the performance of air navigation
services, at national or FAB and European Union level;
monitoring, benchmarking and reviewing of the performance of the network
functions;
assessment of the achievement of the performance targets;
assistance to NSAs with regards to national or functional airspace block
performance issues.
The Performance Review Unit (PRU) is the supporting Unit of the PRC and the PRB. In
terms of administration, it is part of the EUROCONTROL Agency’s Single Pan European
Sky Directorate. The PRU is responsible for monitoring and reviewing the performance of
the European ANS System. Based on its analysis, the PRU supports the PRC and the
PRB for performance improvements in the European ANS system (EUROCONTROL.int,
1.4 Research undertaken in aviation and the environment and research
gap
The PhD thesis aims to highlight and fill the literature gap in the area of the implementation
process and the problems associated with the policy design of the inclusion of aviation in
the European Union Emission Trading Scheme (EU ETS). ETS is well researched in the
energy industry but not in aviation. The focus of this thesis is aviation and the published
research around aviation limits on the effects of ETS for airlines. No in-depth research has
been previously undertaken regarding the implementation issues and no related
suggestions for policy makers have been made in the past.
Moreover, in the area of Single European Sky, the published research is even more
limited. Very few papers are published and those focus on general aspects of SES and not
on the environmental aspect. Table 1 lists the published papers on the area of this
research, i.e. aviation and EU ETS and SES and the environment. No published work is
found on the relation of SES and EU ETS.
Table 1: Research about Aviation and the environment
Author(s) and paper Focus Methodology
Aviation and EU ETS
Xu, J., Qiu, R. & Lv, C., 2016. Carbon emission allowance allocation with cap and trade mechanism in air passenger transport. Journal of Cleaner Production, 131, pp.308–320.
Government allocation
decisions and airlines aircraft selection decisions1
Theoretical economic model
1
The statement that the developed model has the ability to describe the interactions of multiple stakeholders and
balance their conflicts is not realistic since it addresses only the government authorities and the airlines with focus on
Author(s) and paper Focus Methodology
Zanin, M. et al., 2016. Towards a secure trading of aviation CO 2 allowance. Journal of Air Transport Management, 56, pp.3–11.
Secure Multi-party
Computation framework for confidential information in aviation emissions auction.
Conceptual model for cloud-based computational service
Meleo, L., Nava, C.R., Pozzi, C., 2016. Aviation and the costs of the European Emission Trading
Scheme: The case of Italy, Energy Policy, 88, pp. 138-147.
Calculation of the EU-ETS direct costs for Italian airlines and effects on airfares, revenues, and social costs
Theoretical economic model
Malavolti, E. and Podesta, M., 2015. Strategic Reactions of Airlines to the European Trading Scheme. Transportation Research Procedia,
8, pp.103-113.
Economic analysis difference between passengers carried without regulation and when the regulation is put in place. Emphasis given on the selection of aircraft
Theoretical economic model
Miyoshi, C., 2014. Assessing the equity impact of the European Union Emission Trading Scheme on an African airline. Transport Policy, 33(C), pp.56–64.
Equity issues by measuring the impact of the EU ETS on an African airline compared to airlines in an Annex I country.
Case study and BADA and logit models
Sheu, J.-B., 2014. Airline
ambidextrous competition under an emissions trading scheme – A
reference-dependent behavioral perspective. Transportation Research Part B: Methodological, 60(C), pp.115–145.
Airline fare adjustments due to EU ETS and consumers perceptions
Hotelling model with reference dependence theory
Barbot, C. et al., 2014. Trade-offs between environmental regulation and market competition: Airlines, emission trading systems and entry deterrence. Transport Policy, 33(C), pp.65–72.
Effects on potential airline competition and entry deterrence
Author(s) and paper Focus Methodology
Girardet, D. & Spinler, S., 2013. Does the aviation Emission Trading System influence the financial evaluation of new airplanes? An assessment of present values and purchase options. Transportation Research Part D: Transport and Environment, 20, pp.30–39.
Impact of the CO2 costs for short- and long-haul aircraft based on present values and on purchase options
Econometric model
Kopsch, F., 2012. Aviation and the EU Emissions Trading Scheme—
Lessons learned from previous emissions trading schemes. Energy Policy, 49(C), pp.770–773.
Brief discussion on design issues (allocation, liability, inter-temporal trade, trade barriers, hot spots)
Case studies
Malina, R. et al., 2012. The impact of the European Union Emissions Trading Scheme on US aviation. Journal of Air Transport
Management, 19(C), pp.36–41.
Economic impacts on US airlines due to EU ETS.
Emissions Prediction and Policy Analysis (EPPA) model (General Equilibrium Model) Preston, H., Lee, D.S. & Hooper,
P.D., 2012. The inclusion of the aviation sector within the European Union’s Emissions Trading Scheme:
What are the prospects for a more sustainable aviation industry? Environmental Development, 2, pp.48–56.
Whether the policy has the potential to significantly reduce aviation emissions and contribute to a
sustainable future for the industry in terms of climate change
Calculations with the Future Aviation Scenario Tool
Vespermann, J. & Wald, A., 2011. Much Ado about Nothing?-An analysis of economic impacts and ecologic effects of the EU-emission trading scheme in the aviation industry. Transportation Research
Ecologic and economic impacts of EU ETS and effects on competition structures
Author(s) and paper Focus Methodology
Part A: Policy and Practice, 45(10), pp.1066–1076.
Anger, A., 2010. Including aviation in the European emissions trading scheme: impacts on the industry, CO 2 emissions and
macroeconomic activity in the EU. Journal of Air Transport
Management, 16(2), pp.100–105.
Impacts on CO2 emissions and the macroeconomic activity in the EU
Energy– Environment– Economy Model (dynamic simulation model)
Scheelhaase, J., Grimme, W. & Schaefer, M., 2010. The inclusion of aviation into the EU emission
trading scheme-Impacts on
competition between European and non-European network airlines. Transportation Research Part D:
Transport and Environment, 15(1), pp.14–25.
Impacts on competition, operating costs, ticket prices and cargo rates for European and non-European aircraft operators
Model-based empirical estimations
Scheelhaase, J.D. & Grimme, W.G., 2007. Emissions trading for
international aviation: an estimation of the economic impact on selected European airlines. Journal of Air Transport Management, 13(5), pp.253–263.
The possibilities on how aviation could be included in existing emissions trading schemes and overview on the current political discussion2 and the impacts on operating costs and transport demand
Simple
mathematical module with 3 scenarios
Morrell, P., 2007. An evaluation of possible EU air transport emissions trading scheme allocation methods. Energy Policy, 35(11), pp.5562–
5570.
Methods of allocation of emissions permits
Case studies
Author(s) and paper Focus Methodology
Forster, P.M. de F., Shine, K.P. & Stuber, N., 2006. It is premature to include non-CO 2 effects of aviation in emission trading schemes.
Atmospheric Environment, 40(6), pp.1117–1121.
Non-CO2 effects, Radiative Forcing and global warming potential
Mathematical calculations
Single European Sky
Nava-Gaxiola, C.A. & Barrado, C., 2016. Performance measures of the SESAR Southwest functional
airspace block. Journal of Air Transport Management, 50, pp.21–
29.
Expected benefit in saving flight distance after
introducing the Free Route Airspace in Southwest FAB.
Traffic simulation
Baumgartner, M. & Finger, M., 2014. European air transport liberalization: Possible ways out of the single European sky gridlock. Utilities policy, 30, pp.29–40.
The process and the main actors' interests, and explains the current gridlock of the SES as a result of conflicting objectives among the main players3
Overview
Baumgartner, M. & Finger, M., 2014. The Single European Sky gridlock: A difficult 10 year reform process. Utilities Policy, 31, pp.289–
301.4
The process and the main actors' interests, and explains the current gridlock of the SES as a result of conflicting objectives among the main
Overview
3
The paper gives a rather confusing description of Single European Sky and references to three Key Performance
Areas whereas the Regulation 691/2010 refers to four areas. The identification of the stakeholders’ interests is
accurate.
4
This paper is