MULTI-PLAYER MICROTIMING HUMANISATION USING A MULTIVARIATE MARKOV
MODEL
Ryan Stables
DMT Lab,
Birmingham City University
Birmingham, UK
[email protected]
Satoshi Endo
Institute for Information-Oriented Control
Technische Universität München,
Munich, Germany
[email protected]
Alan Wing
SYMON Lab,
School of Psychology,
Birmingham University,
Birmingham, UK
[email protected]
ABSTRACT
In this paper, we present a model for the modulation of multi-performer microtiming variation in musical groups. This is done using a multivariate Markov model, in which the relationship be-tween players is modelled using an interdependence matrix (α) and a multidimensional state transition matrix (S). This method al-lows us to generate more natural sounding musical sequences due to the reduction of out-of-phase errors that occur in Gaussian pseu-dorandom and player-independent probabilistic models. We ver-ify this using subjective listening tests, where we demonstrate that our multivariate model is able to outperform commonly used uni-variate models at producing human-like microtiming variability. Whilst the participants in our study judged the real time sequences performed by humans to be more natural than the proposed model, we were still able to achieve a mean score of 63.39% naturalness, suggesting microtiming interdependence between players captured in our model significantly enhances the humanisation of group mu-sical sequences.
1. INTRODUCTION
In electronically produced music, humanisation algorithms are of-ten applied to percussive sequences in order to create a more nat-ural sounding expressive performance. This is particularly useful when access to performers or equipment is limited, as events can be programmed onto a quantised grid and then modulated by a music producer, without the requirement for human performance. This process is often applied during the point of music creation from within the digital audio workstation and allows for the in-corporation of sampled or synthesised instruments into a piece of music.
One of the main issues with current humanisation systems is that they do not necessarily represent the expressivity exhibited by a human agent, thus the process requires further editing in order to achieve a natural approximation of a human musician. Further-more, the systems are unable to model the characteristics of group performance when used in a multi-channel environment. These
problems are namely due to the fact that the majority of existing humanisation systems modulate the onset locations and respec-tive velocities of an event instantaneously, using a pseudorandom variate, selected from a Gaussian window. Therefore in simulated multi-player performance, phase error is often introduced between the channels. This can actually reduce the naturalness of the per-formance, rather than enhance it due to perceptually unrealistic cues, generated by multiple instances of the algorithm running in parallel.
1.1. Modelling Microtiming
In this study, we focus specifically on extracting and modulating microtiming offsets in musical performance, this can be defined as the subtraction of an event at timenfrom a corresponding point on a reference track, as illustrated in Figure 1. Here, the refer-ence grid represents a metronome running in parallel with the per-formed musical sequence. The challenge of the humanisation al-gorithm is to then estimate the distribution atn+ 1, written as
P(θn+1). This is usually done independently of all other events in the sequence, based on a distribution centred around thenthgrid point, characterised by the parametersµandσ.
θn = tn - tn
θn-1 = tn-1 - tn-1
t
t
P(θn+1) =
Figure 1:Representation of a player, following a metronome. The offset measurements from the metronome are shown asθn, where ˆ
tnis thenthmetronomic event andtnis thenthevent performed
Attempts have been made in previous studies to increase the naturalness of single-player humanisation systems by incorporat-ing some form of intelligent processincorporat-ing into the variate generation procedure. In [1] for example, fuzzy logic has been used to model strike velocity deviation in a humanisation system, based on sub-jective rules, derived from domain knowledge. Similarly, micro-timing deviation has been modelled using a number of different supervised machine learning techniques by [2]. These techniques are then used to apply the derived microtiming models to quantised sequences, in which they conclude the systems used to model per-cussive sequences significantly outperform the quantised version, when evaluated for natural expressivity. Microtiming for Brazil-lian Samba music is also estimated in [3] and [4], using a model based on the extraction of quarter-note patterns using K-Means clustering. Here, it is shown that the degree of expressive timing can be attributed to specific metrical positions, with examples in Samba music. This kind of information is omitted when pseudo-random models are applied, due to the variables being indepen-dently distributed for each event.
In previous work by Stables ([5], [6]), it has been shown that the process of stochastic humanisation can be improved using prob-abilistic temporal models to modulate a quantised sequence, based on microtiming measurements taken from professional musicians. Here, independently distributed variates(P(θn+1))were replaced by variates that were conditionally dependent in time(P(θn+1|θn)). In these studies it was shown that the measured sequences ex-hibited temporal patterns which could be synthesised using finite state machines. In both cases, the empirically developed models were shown to subjectively outperform quantised and Gaussian se-quences for both perceived naturalness and musicality.
2. GENERATIVE MULTIVARIATE MODEL
Whilst the models described in section 1.1 work particularly well with single-player sequences, phase error is still introduced in muti-channel performance models due to the lack of inter-performer dependence. This means that when a probabilistic humanisation algorithm is applied to more than one track in a given session, extensive manual correction is often required in order to create a sense of cohesion between the separate channels. It is therefore necessary to consider ways in which a group of musicians can be modelled in parallel, thus preserving the inter-performer timing characteristics of a musical group.
If we make the assumption that the performed musical signals are stylised stochastic processes (as in studies such as [7] and [8]), we can use a Markov chain to estimate a transition through a dis-crete state-spaceZ ={z1, z2, . . . , zK}, whereznrepresents the
nth
state of the system, providing the sequence being modelled, satisfies the Markov property given in Eq. 1.
P(θn+1=in+1|θ0=i0, θ1=i1, . . . , θn=in)
=P(θn+1=in+1|θn=in) (1)
Here,θnrepresents thenthevent andinrepresents the cor-responding state. Each state in the model can be described us-ing canonical form representation, consistus-ing of a binary vector of lengthK, wherePK
k=1(θn)k= 1and(θn)k∈ {0,1}. For exam-ple, in a 5-state model, if thenth
event is equal toz3, we can use the representationθn ={0,0,1,0,0}T. This allows us to define a single-player model using Eq. 2.
P(θn+1) =Sθn (2)
Here, S is a state transition matrix (STM), representing the probability of a transition fromθn = in to θn+1 = in+1 for
n ={1,2, . . . , N}, whereN is the number of events in the se-quence. We then considerP(θn) to be the Probability Density Function (PDF) representation ofθn. The canonical form ofθn+1 is then calculated using a rejection sampling technique, given here in Eq. 4.
(θn)i=
1, i=β
0, i6=β (3)
β=
γ1,k, [γ1,k, γ2,k]∈P(θn)
repeat, [γ1,k, γ2,k]∈/P(θn) (4)
Whereγ1,kandγ2,k are pair-wise stochastic variables, evaluated against thenth
state distribution andβis the state vector index. For situations such as grouped musical performance, in which there are two or more conditionally dependent sequences, we can use a Multivariate Markov Chain (MVMC) model. This consists of the univariate model, estimated acrossM sequences being per-formed concurrently, weighted by some measure of inter-player dependence, given in Eq. 5.
P(θ(i)n+1) = M
X
k=1
αi,kS(i,k)θ(k)n (5)
In the multivariate model,θn(i)represents the state distribution of streamiin canonical form and the matrixS(i,k)
gives the proba-bility of a transition from thenthstate in streami, to the(n+ 1)th state in streamk, as demonstrated in Eq. 6. Whenk = i, S
represents a standard univariate STM. The weights (αi,k) in the model represent the interdependence factor between streamsiand
k, which can be derived empirically.
2.1. Pulse Approximation
As demonstrated in Figure 1, the estimation of microtiming param-eters in the current model relies on an isochronous grid (ˆt) in order to calculate differentials (θ(i)) at any point in time (n). In single-player streams this model works particularly well if a single-player has performed the sequence to a click-track as we can use a metro-nomic grid to approximateˆt. However due to the nature of group performance, it is relatively unlikely that the individual performers will follow the same click track, unless the musicians are indepen-dently contributing material to the musical piece. This trait is very common in multitrack recording, but less common in group per-formance. Using a metronomic model, we can represent the grid using Eq. 8.
θ(i)n =t(i)n −ˆtn
where, ˆtn= (n−1) 60τ
(8)
S(i,k)=
p(θ(i)=z1|θ(k)=z1) p(θ(i)=z2|θ(k)=z1) . . . p(θ(i)=zK|θ(k)=z1)
p(θ(i)=z1|θ(k)=z2) p(θ(i)=z2|θ(k)=z2) . . . p(θ(i)=zK|θ(k)=z2) ..
. ... ... ...
p(θ(i)=z1|θ(k)=zK) p(θ(i)=z2|θ(k)=zK) . . . p(θ(i)=zK|θ(k)=zK)
(6)
i={1,2, . . . , M}, k={1,2, . . . , M} (7)
ˆ
τm= 1 M B M X i=1 B X n=1 (t0n)
(i)
−(t0n−1) (i)
(9)
Wheret0nrepresents an event that falls on a beat location andBis the number of beats in the bar. τˆmthen represents the estimated tempo for themth
bar. This is now an estimated dynamic mea-surement of temporal drift and is updated each time a new bar is performed. The micro timing offsets are then subtracted from this grid, using the technique defined in Eq. 8, replacingτwithˆτmand interpolated forn.
2.2. Inter-Player Dependence
We model the interdependence (αi,j) amongst performers in the group using lagged cross-correlation, in which playeri’s stream is lagged by a pre-defined number of events (n) and correlated with the stream of playerj. This allows us to estimate the amount of de-pendence that one player has on another. This technique has been demonstrated by [9] to be optimal at a single event, suggesting that players are highly receptive to short-term variations in accompani-ment. This measurement is demonstrated in Eq 10.
αi,j= 1
N
N−n−1
X
k=0
θk(i)θ(j)k+n (10)
Wherenis a non-negative integer representing the number of events to lag, set to 1 for this application.
3. EXPERIMENT: STRING QUARTET MODELLING
In order to evaluate the performance of the model, we analyse a professional quartet performing an excerpt from the4th
movement of Hayden’s String Quartet Op. 74 No. 1 in C-Major, the score for which is given in Figure 2. The quartet consisted of two violins, a viola and a cello, and the excerpt was chosen due to the number of notes being performed concurrently. The quartet have around 12 years experience performing together, and were shown by [9] to follow the lead violin player relatively closely. The excerpt, con-sisting of 12 bars was performed and recorded 15 times using the same equipment and the musicians were asked to perform using their natural expression. In total, each take contained 48 musical events, all of which were being performed by all members of the quartet at the same metrical positions in the bar.
Each player was recorded using an individual instrument mi-crophone (DPA 4061), positioned on the body of each instrument with a rubber mount in order to reduce bleed in the recordings. The onsets from each player were then extracted using a spectral-flux based technique, and adjusted manually to improve accuracy. To find the microtiming offsets, the pulse was estimated at the be-ginning of each bar using the method defined in Eq. 9 and the
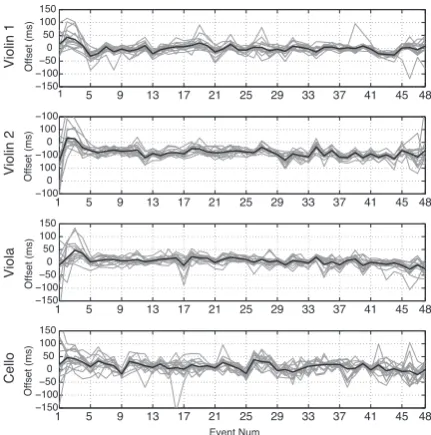
events were subtracted using the technique defined in Eq. 8. The mean tempo for the recordings was found to be 105.0 BPM, with a standard deviation of 6.49. Figure 3 illustrates offset measure-ments from all 15 takes, with the mean of the results represented in black. Here, deviations are shown across all four performers playing concurrently.
1 5 9 13 17 21 25 29 33 37 41 45 48
−150 −100 −50 0 50 100 150 Vi o lin 1
1 5 9 13 17 21 25 29 33 37 41 45 48
−100 0 100 −100 0 100 −100 Vi o lin 2
1 5 9 13 17 21 25 29 33 37 41 45 48
−150 −100 −50 0 50 100 150 Vi o la
1 5 9 13 17 21 25 29 33 37 41 45 48
−150 −100 −50 0 50 100 150 C e llo O ff se t (ms) O ff se t (ms) O ff se t (ms) O ff se t (ms) Event Num
Figure 3:A graphical representation of the microtiming deviation (θ) for all four performers. the measurements are taken across 15 takes of the same piece with the mean offset indicated in black, the vertical lines represent bar divisions.
3.1. Subjective Evaluation
To evaluate the perceived naturalness of the model, subjective lis-tening tests were conducted using a MUSHRA-based methodol-ogy [10]. The subjects were asked to rank each of the samples with a multi-stimulus interface and provide a rating between 0-100 for how naturally expressive each sample was perceived to be. Participants were informed that the experiments were based on professional musicians and were played an excerpt from a string quartet (not included in the stimuli) before the test began. In to-tal 20 people participated in the experiment, all of whom were all aged between 18-35 and had normal hearing. All participants had some experience in performing or producing music.
Figure 2:The score of the excerpt taken from Hayden’s Quartet Op. 74 No. 1 in C Major, in which 4 separate instrument parts are shown.
Quartet Op. 74 and synthesised using a string ensemble pre-set from the Logic Studio 9 plug-in: EXS24 (Apple, CA, USA). The sequences were compiled by generating MIDI note-on messages and importing them into a sequencer. The MIDI was generated using 5 different techniques, these can be categorised as follows1.
• Quantised: The note-on messages were quantised to a fixed grid, thus exhibiting no temporal variation.
• Gaussian: Each of the note-on messages were modulated using an independent Gaussian window.
• MC: The note-on messages for each channel were modu-lated using a conditionally independent Markov chain.
• MVMC: The note-on messages are modulated using the MVMC model presented in Eq. 5.
• Human: The onsets are taken from a dataset of human per-formers.
In order to isolate microtiming deviation, other parameters such as note-off and velocity were fixed to constant variables. The length of each event was fixed to 1/4-note length and the global tempo was varied across samples, bounded by measurements from the dataset. To control the mean and variance of the micro tim-ing deviations across conditions, theµandσparameters used to characterise the distributions in the Gaussian method were derived from the dataset of human performers. This meant that all tech-niques were able to produce a similar range ofθvalues.
4. RESULTS
4.1. Performance Analysis
From our observations of a string quartet performing 15 iterations of a 12-bar of a piece in 4/4, we can identify characteristics of the musical group by performing analysis on the data. Firstly, the max-imum microtiming deviation was measured to be 198.02ms and the minimum was -202.48ms. Overall the mean was 6.51ms, with a SD of 2.65ms. As the mean tempo was observed to be 105BPM, in 4/4 time signature, the maximum deviation was around 35.4% and the mean deviation was around 1.2% of the inter-onset interval (IOI).
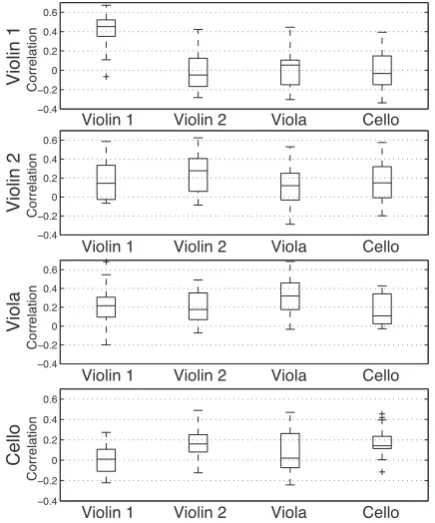
The dependencies between each performer in the group are summarised in Eq. 11 and also shown using boxplots in Figure 4. Both of these diagrams represent the variableαin the model.
α=
0.410 0.009 0.026 0.001 0.177 0.257 0.113 0.147 0.217 0.203 0.320 0.175 0.007 0.151 0.072 0.181
(11)
1Stimuli can be found at http://www.ryanstables.co.uk/data/dafx14
−0.4 −0.2 0 0.2 0.4 0.6
Violin 1 Violin 2 Viola Cello
Violin 1 Violin 2 Viola Cello
Violin 1 Violin 2 Viola Cello
Violin 1 Violin 2 Viola Cello
Vi
o
li
n
1
C
o
rre
la
ti
o
n
C
o
rre
la
ti
o
n
C
o
rre
la
ti
o
n
C
o
rre
la
ti
o
n
−0.4 −0.2 0 0.2 0.4 0.6
Vi
o
li
n
2
−0.4 −0.2 0 0.2 0.4 0.6
Vi
o
la
−0.4 −0.2 0 0.2 0.4 0.6
C
e
ll
o
Figure 4:Boxplot representation of inter-player dependence mea-sured over 15 takes. This is measured using a lagged cross-correlation function.
Here it is evident that the most highly correlated measurements taken from the data are based on lagged autocorrelation. This pro-motes the use of Markov chains in musical performance modelling as it suggests there is a strong relationship between an event (xn) and it’s predecessor (xn−1) within the same stream. Generally, the 1stviolin has very low correlation scores with the other musicians in the group with a mean of 0.012 and a very high auto-correlation measurement. This suggests that they have adopted the role of lead performer. The other musicians in the group are generally more positively correlated with each other. Here, both the 2nd Violin and the viola player are following the lead violin, whilst the Cello is following the 2nd violin. We can calculate a leadership metric (lα) for each player by taking the column-wise means, excluding the autocorrelation measurements at cellαijwherei=j. This is illustrated in Eq. 12.
lα=
0 10 20 30 40 50 60 70 80 90 100
Quantised Gaussian MC MVMC Human
Mean
Su
b
je
ct
ive
R
a
ti
n
g
Figure 5:A boxplot showing subjective listening test results taken from 20 subjects. The stimuli consisted of 5 samples taken from 5 categories (25 in total).
Here, it is evident that the 1st Violin has the highest degree of lead-ership, reinforcing the suggestion that the performer has a leading role within the group.
4.2. Model Evaluation
In order to evaluate the naturalness of the model, we performed subjective tests to identify the similarity between the generated se-quences and the performed sese-quences. The results from the subjec-tive tests are illustrated in Figure 5. Here, it is evident that the mi-crotiming sequences sampled from real musicians performed bet-ter than any of the synthetic samples with a mean score of 77.59%. The lowest scoring categories were Gaussian and Quantised mod-els, which scored 22.33% and 21.42% respectively. The samples that were generated using the proposed multivariate model scored relatively highly with 63.39%, this was 21.94% higher than the closest category, which was the univariate model suggested in [5]. This result shows that the multivariate model performs slightly less favourably than using onsets taken directly from human per-formers, however it outperforms all existing methods for univariate modulation.
5. DISCUSSION
5.1. Model Performance
From the analysis of the string quartet, it is evident that the per-formers all seem to have stronger lagged autocorrelation scores (αij, wherei = j), than cross-correlation scores (i 6= j). This would suggest that the internal representation of time held by each player takes priority over the external timings of group perfor-mance. Whilst these autocorrelation scores are significantly higher than the cross-correlation measurements, the performers still pro-duce a sufficient amount of microtiming offset to cause potentially audible phase errors in the piece. This suggests the model’s de-pendence matrix (α) is a significant factor as both the univariate model and the normally distributed model (with equivalentµand
σparameters) underperform at producing timing sequences with natural expressivity. Subjectively, the multivariate model tends to produce much more confluent sequences than any of the univariate models running in parallel across multiple channels.
Whilst the subjective listening tests show an increased mean score for the multivariate model, suggesting the model is able to produce realistic musical sequences, there is a much higher vari-ance than in other categories. This means there is uncertainty within the results, with some participants rating the system as low as 7/100. This is acceptable to an extent due to the relative uncer-tainty in the human samples, however it suggests there is room for improvement due to the inconsistency in results.
5.2. Implementation
Whilst we have demonstrated that the univariate models running in parallel do not perform particularly well for this application, the model allows for the conversion between univariate and mul-tivariate methods by convertingαto an identity matrix, imposing conditional independence on all streams. Similarly, we can alter the dependencies inαto change the characteristics of the musi-cal group. If for example, the performance requires the group to closely follow Violin 1, the values in column 1 can be incremented, thus increasing the performers’ leadership score (lα). From an im-plementation standpoint, this is relatively simple to parameterise as users of the system can input values into the dependence matrix directly or via some mapping function.
Another key aspect to producing natural sounding rhythmic performance is tempo variation. In our listening tests, this was based on existing templates taken from our dataset. In most hu-manisation systems, this is ignored as control is generally main-tained by the host application. For systems that wish to include this attribute, another variable can be added directly to the sum in Eq. 5, derived using the technique defined in Eq. 8. In the performances measured for this study, the tempo variation has a particularly high standard deviation due to the expressive nature of the music. In other genres such as pop-music, this may not be as important due to the prominence of quantisation and click-tracks.
6. CONCLUSION
In this paper, we have presented a model for the synchronous mod-ulation of multiple streams of onsets using a multivariate Markov model. The model derives parameters from a user-defined cor-pus of multi-performer musical data and probabilistically applies modulation to a group of concurrent sequences. We can estimate the inter-player dependencies using lagged cross-correlation met-ric and approximate the pulse of the group using the bar-wise mean of all performers. The model is designed to alleviate the phase is-sues that arise when humanisation algorithms are applied to mul-tiple sequences simultaneously.
the interdependence in multi-player musical performance that re-quires further attention.
7. REFERENCES
[1] L. O’Sullivan and F. Boland, “Towards a Fuzzy Logic Ap-proach To Drum Pattern Humanisation,” inProc. of the 13th Itl. Conference on Digital Audio Effects (DAFx-10), Graz, Austria, Sept. 19-21, 2010.
[2] M. Wright and E. Berdahl, “Towards machine learning of expressive microtiming in Brazilian drumming,” in Interna-tional Computer Music Conference, 2006.
[3] Fabien Gouyon, “Microtiming in samba de roda - prelim-inary experiments with polyphonic audio,” inSimpósio da Sociedade Brasileira de Computação Musical, 2007. [4] Luiz Alberto Naveda, Fabien Gouyon, Carlos Guedes, and
Marc Leman, “Multidimensional microtiming in samba mu-sic,” in 12th Brazilian Symposium on Computer Music. SBCM, 2009, pp. 1–12.
[5] Ryan Stables, Jamie Bullock, and Ian Williams, “Perceptu-ally relevant models for articulation in synthesised drum pat-terns,” inAudio Engineering Society Convention 131. Audio Engineering Society, 2011.
[6] Ryan Stables, Cham Athwal, and Rob Cade, “Drum pattern humanization using a recursive bayesian framework,” in Au-dio Engineering Society Convention 133, Oct 2012. [7] Kevin Jones, “Compositional applications of stochastic
pro-cesses,” Computer Music Journal, vol. 5, no. 2, pp. 45–61, 1981.
[8] M. Kaliakatsos-Papakostas, M.G. Epitropakis, and M.N. Vrahatis, “Weighted markov chain model for musical com-poser identification,” inApplications of Evolutionary Com-putation. 2011, vol. 6625 ofLecture Notes in Computer Sci-ence, p. 334–343, Springer.
[9] Alan M Wing, Satoshi Endo, Adrian Bradbury, and Dirk Vor-berg, “Optimal feedback correction in string quartet synchro-nization,”Journal of The Royal Society Interface, vol. 11, no. 93, pp. 20131125, 2014.