Article
Port Waste Management in the Baltic Sea Area:
A Four Port Study on the Legal Requirements,
Processes and Collaboration
Irina Svaetichin and Tommi Inkinen *
Department of Geosciences and Geography, University of Helsinki, 00014 Finland; irina.svaetichin@gmail.com
* Correspondence: tommi.inkinen@utu.fi
Abstract: The cruise ship industry has become a well-implemented industry in the Baltic Sea area, and each year, the number of cruise ship passengers rises steadily. Efficient waste management in cruising ports around the Baltic Sea is a crucial element in minimizing environmental impacts. This research involves the four selected ports of Copenhagen, Helsinki, Stockholm and Tallinn. The study applies statistics and interview data to the analysis of waste management systems for cruise ship-generated waste. The interview data involves 14 executives and professionals responsible for environmental issues and decision making in their respective ports. The interviews highlighted the need for standardized environmental legislation and related procedures, which would result in coherent measurement systems. These systems would enable transparent environmental monitoring, thus maintaining the ports’ competitiveness. A common environmental legislation would support the emerging waste management system for the whole Baltic Sea area. We suggest that ports should focus on handling specific types of wastes and collaborate as a spatial network. Specialization to allow discharge of certain fractions of waste is essential. The paper concludes by addressing demands for future research, particularly vessel- and customer behavior focused studies.
Keywords: ports, waste management, baltic sea, cruise ships, sea environment, recycling
1 Introduction
Maritime transportation trends have changed rapidly during the last decade, facing numerous green port challenges (Johnson 2002; Bell et al. 2015). The number of passengers rises steadily, by almost 250% from 2000 to 2014 (Dowling & Vasudavan 2010; Cruise Baltic Statistics 2015). The cruise ship market has grown worldwide, and has consequently ‘introduced a unique set of environmental pressures that need to be addressed and investigated, particularly those pertaining to waste management’ as Butt (2007: 592) observes. Three trends are identifiable in the Baltic maritime transportation: 1) an increased intensification of shipping; 2) a change in the structure of transported goods (steady increase of liquid bulk) and 3) ports aiming to improve their operations using numerous developments and programs.
• How cruise ship-generated waste is handled in the Baltic Sea area, and what quantities are involved?
• Are individual ports already specialized in specific types of waste handling management and how does this reflect on the “No special fee” -system?
• Could collaboration between the specified four ports be improved to better handle waste from cruise ships, and can certain fractions be discharged in ports specialized in specific types of waste?
Logistics and the cruise ship industry go hand-in-hand with environmental impacts (e.g., Wild & Dearing 2000; Notteboom & Winkelmans 2001; Inkinen & Tapaninen 2009; Kersten et al. 2013). Environmental impacts are managed by minimizing unnecessary transportations, maximizing shipment loads, and by cutting down transportation speeds, simultaneously minimizing the usage of fuel and production of air emissions. Although occurring seldom, the environment can be significantly affected by accidents. Accidents may result in oil spills from the ship itself or from its cargo. Other relevant issues include the use of energy and natural resources; the areas used for the ports; erosion; and other health- and environmental hazards produced by the off- and on-loading of goods (Rodrigue et al. 2013). Waste streams are considered unevenly distributed, although laws and regulations state otherwise. The Baltic Sea is a relatively small area with special environmental characteristics and business potential for ports (see Andersson et al. 2016; Canfield 2006; Notteboom & Wouter 2011). The cruising ports are also close to each other. This indicates that vessels do not need to hold on to produced waste for extended times.
The cruise ship industry is steadily growing, with more than 22 million people cruising annually worldwide, and 55 new ships to be launched between 2015 and 2020 worldwide (CLIA 2015a; 2015b). The impact of these waste streams will vary due to laws and regulations, port receptions facilities and waste management plans onboard individual cruise ships (also Diakomihalis & Stefanidiki 2011). Extensive research on waste streams has mainly been accomplished in the USA, the UK and parts of Europe and South-Korea (see Adams 2010; Blas & Carjaval-Trulijjo 2014; Canoves et al. 2014; Chang et al. 2015; Dawson et al. 2015; Gui & Rosso 2011; McCarthy 2003).
2 Maritime transport, ports, and waste management
2.1 Cruise ship waste streams and the ‘No Special Fee’ system
The International Maritime Organization (IMO) is a specialized agency of the United Nations and the global regulator of shipping. The Baltic Sea region is a designated special area in the International Convention for the Prevention of Pollution from Ships (MARPOL). The convention was first adopted in 1973 at IMO and later updated by amendments. The MARPOL protocol is one of the major international agreements relevant to cruise ship pollution (also Avellaneda et al. 2011; Dragović et al. 2015). Regulation by six technical Annexes prevent and minimize pollution from ships, both accidental pollution and that from routine operations (IMO 2015). The most important regulation to this study is the Annex V on pollution by garbage from ships (see Appendix 1). According to this Annex, plastics and all other garbage, including paper products, rags, glass, metal, bottles, crockery, dunnage, lining and packing materials are prohibited from being discharged into the sea. The only exceptions to discharging overboard relate to safety or the release of garbage due to damage. The vessels need to have a garbage record-keeping book on board, to record all discharge operations, including accidental loss or escape of any garbage, and completed incineration at port and at sea. The Port Authority of each port is also obliged to ensure the provision of port reception facilities, without causing undue delay to vessels. (IMO 2011: 241–246).
the volume of waste generated by vessels calling to the ports (also Carpenter & MacGill 2005). National policies govern the countries’ waste handlings. The EMSA report (Ohlenschlager and Gordini 2012) maintains that a majority of European ports facilitate the collection of sewage. Few ships request the use of the service, however, as ships can still legally discharge sewage into the sea. To protect the Baltic Sea environment, Helsinki Commission (HELCOM) introduced the NSF-system in 1998. The NSF-NSF-system encourages ships to deliver waste ashore, thereby avoiding undesirable waste streams between ports, and preventing discharges into the sea. New recommendations have since been established, and the definition and explanation of the system used here refer to the HELCOM recommendation 28E/10 (2007), superseding recommendations 19/8, 26/1 and 28/1. The four ports of this study have implemented the system.
The NSF system requires every ship to pay for the reception, handling and disposal of oil residues, sewage and garbage at any calling port. The fee involved covers waste collection, handling and processing, including infrastructure, and is usually counted on the basis of a ship’s gross tonnage. Moreover, the waste management fee does not cause financial profit to the port. The fee only covers investments in reception facilities, operation of reception facilities, repair and maintenance costs of such facilities and the costs of handling, treatment and final disposal of received wastes. Hence, the system should not be economically competitive amongst the ports. As ships are required to leave any waste generated from their last port of call at the following port, waste streams ought to be evenly distributed. Consequently, waste management is a complex problem because of the environmental, economic and social aspects that must be considered (Zuin et. al 2009).
Per EU waste legislation and policy, the prevention of waste production is closely linked to manufacturing methods and also influences a consumer’s demands. The EU Directive 2008/98/EC (2008: 4) states ‘The first objective of any waste policy should be to minimize the negative effects of the generation and management of waste on human health and the environment. Waste policy should also aim at reducing the use of resources, and favor the practical application of the waste hierarchy.’ The directive particularly states that waste management should be carried out without risking water, air, soil, plants or animals; without causing nuisance through noise or odors; or negatively affecting either the countryside or places of interest. A waste hierarchy (from prevention to disposal in five steps) was first introduced in 1997 by the European Council. Thus, the minimization and recycling of waste has already been a hot topic for two decades.
2.2 Laws and regulations on ship waste management
An average cruise ship sailing the Baltic Sea has approximately 2000 to 3000 passengers and 800 workers. People, both passengers and workers, and different on-board activities produce different types of wastes, including wastewater, oily waste, solid waste, hazardous waste and food waste (also Klein 2011). A minimum of 1 kg of solid waste, two bottles and two cans per passenger and an amount of 50 ton of black water (sewage) is generated by an average cruise ship per day (Sweeting & Wayne 2003; Butt 2007). A new type of waste called scrubber waste has also been created, resulting from new legislation (Directive 2012/33/EC) on sulfur emissions introduced on 1st of January 2015. The new legislation, amending Directive 1999/32/EC, states that the sulfur content of fuel mass cannot be more than 0.10%. For satisfactory waste handling, the fractions need to be sorted on board a ship (e.g., Rozmarynowska 2015).
less than 12 nautical miles from the nearest land (also Polglaze 2003). Food should be comminuted or ground and it should fit through a screen with openings no greater than 25 mm.
Another international directive with implications for the cruise ship- and port business is the EU Directive 2000/59/EC on port reception facilities (PRF) for ship-generated waste and cargo residues, adopted by the European Community in 2000. By improving the use and availability of PRFs, the Directive aims to reduce illegal discharges from ships, thereby enhancing the protection of the marine environment. This directive pursues the same aim as the MARPOL 73/78 Convention, focusing on ship operations in European Union ports. The Directive (2000: 82) further announces that ‘in order to reconcile the interest of the smooth operation of maritime transport with the protection of the environment, exceptions to this requirement should be possible taking into account the sufficiency of the dedicated storage capacity on board, the possibility to deliver at another port without risk of discharge at sea and specific delivery requirements adopted in accordance with international law.’ This allows ships to keep wastes of particular standards on board, and grants ports more accurate waste handlings and better recycling methods and opportunities. Garbage that can be recycled and reused should not be defined as waste.
3 Study ports and context
The Baltic Sea is a very sensitive maritime area as a cruising destination network (Marcussen 2016). It is the second largest brackish water basin after the Black Sea, and covers the Gulf of Finland, the Gulf of Bothnia, the Gulf of Riga, the Baltic proper and the Belt Sea (also Hilmola 2011; 2012). The Baltic Sea water changes slowly because of shallow water, the lack of tides, low salinity and its location on a tectonic plate. The Danish Strait is the only connection with the open seas. Therefore, harmful substances brought to the Baltic Sea will stay there for a long time. Consequently, the area is highly sensitive to all environmental impacts. Eutrophication of the Baltic Sea is a severe threat and algal blooming is an annual phenomenon.
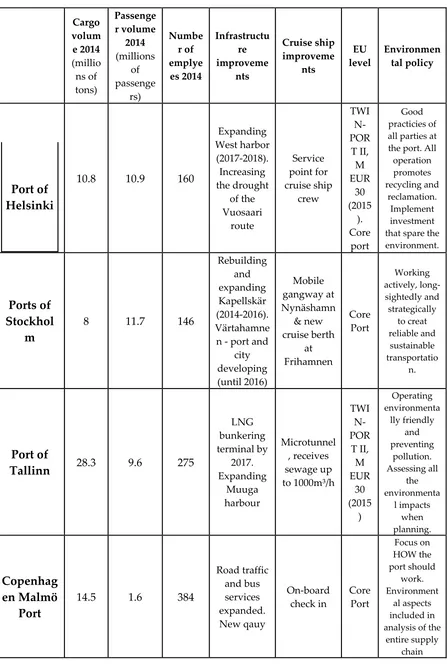
All four ports have ISO 9001:2008 Quality Management System and ISO 14001:2004 Environmental Management System certificates (also Lam & Notteboom 2014). Furthermore, all ports follow the MARPOL 73/78 convention, the EU directive 2000/59/EC and have introduced the NSF-system (see Hrvoje 2016). Each port is expanding its port area, as seen in Table 1. The Port of Helsinki was granted an exceptional permit for the West Harbor in 2014, in accordance with the original plan.
Table 1. Summary of the study port characteristics. Cargo volum e 2014 (millio ns of tons) Passenge r volume 2014 (millions of passenge rs) Numbe r of emplye es 2014 Infrastructu re improveme nts Cruise ship improveme nts EU level Environmen tal policy
Port of
Helsinki
10.8 10.9 160
Expanding West harbor (2017-2018). Increasing the drought of the Vuosaari route Service point for cruise ship crew TWI N-POR T II, M EUR 30 (2015 ). Core port Good practicies of all parties at the port. All operation promotes recycling and reclamation. Implement investment that spare the environment.
Ports of
Stockhol
m
8 11.7 146
Rebuilding and expanding Kapellskär (2014-2016). Värtahamne n - port and
city developing (until 2016) Mobile gangway at Nynäshamn & new cruise berth at Frihamnen Core Port Working actively, long-sightedly and strategically to creat reliable and sustainable transportatio n.
Port of
Tallinn
28.3 9.6 275LNG bunkering terminal by 2017. Expanding Muuga harbour Microtunnel , receives sewage up to 1000m³/h TWI N-POR T II, M EUR 30 (2015 ) Operating environmenta lly friendly and preventing pollution. Assessing all the environmenta l impacts when planning.
Copenhag
en Malmö
Port
14.5 1.6 384
Road traffic and bus services expanded. New qauy On-board check in Core Port Focus on HOW the port should work. Environment al aspects included in analysis of the
entire supply chain
The methodology is mainly qualitative, although we also apply available statistics collected by statistical offices and port authorities in their respective countries. We used various channels, but mainly the operators of waste management provided waste management statistics. The statistics provide the port context for each case, and semi-structured interviews deepen the focus on the processes and specifics of each port. The selection of candidates to interview was based on management and control of the environment and waste handlings of international cruise ships in each port. All interviews were conducted in the mother tongues of the interviewee: interviews held in Stockholm and Copenhagen were in Swedish; in Tallinn, they were in English; and in Helsinki they were in Finnish (see Annex 1 for the list of interviewee).
The interviews were held at each port with one, two or three participants at a time. In total, 12 persons were interviewed on nine occasions. As the interviews were designed to be in the form of discussions and social interaction, it was possible to have interviews with multiple persons at a time. All interviews took place with permission. Each interview lasted between half an hour and one hour, and all of the interviews were transcribed to enable coding and analysis of the discussions (e.g. Flowerdew & Martin 2005).
The interviews were carefully structured: most of the questions were designed to lead into a discussion with open answers, and the overall interview had five main themes. The themes were set up to cover the waste reception from cruise ships at port, how the port itself is functioning and cooperating with other ports regarding reception and other environmental issues. The five themes were 1) port reception facilities; 2) cruise ship-generated waste; 3) cooperation with the other ports; 4) national legislation and 5) sustainable development and the future. The analysis of the interviews was made through the transcribed material.
The quality of the semi-structured thematic professional interviews was verified at an early stage, through meticulous framing of the interviews. The frame was designed thoughtfully and with additional tacit knowledge obtained from the Port of Helsinki and the University of Helsinki. The statistical data should be reliable, as they involve the official numbers used both in the annual reports (of the ports) and official national statistics. The results of this research can be compared and applied to similar research on other geographical areas.
5 Results
5.1 Distribution of waste among the ports
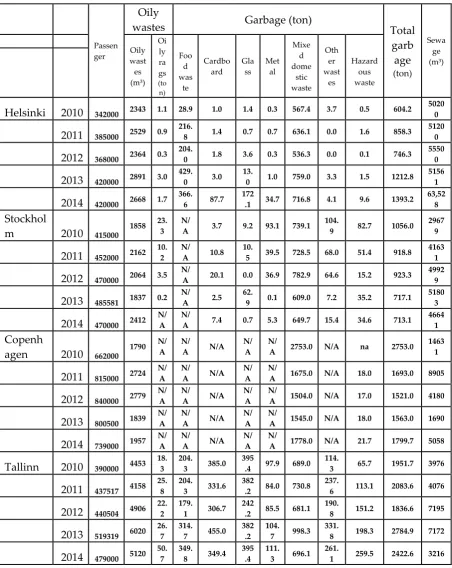
Table 2. Passenger and waste amounts obtained from the study ports as the data was available.
Passen ger
Oily
wastes Garbage (ton) Total
garb age (ton) Sewa ge (m³) Oily wast es (m³) Oi ly ra gs (to n) Foo d was te Cardbo ard Gla ss Met al Mixe d dome stic waste Oth er wast es Hazard ous waste
Helsinki 2010 342000 2343 1.1 28.9 1.0 1.4 0.3 567.4 3.7 0.5 604.2
5020 0
2011 385000 2529 0.9
216.
8 1.4 0.7 0.7 636.1 0.0 1.6 858.3
5120 0
2012 368000 2364 0.3
204.
0 1.8 3.6 0.3 536.3 0.0 0.1 746.3
5550 0
2013 420000 2891 3.0
429.
0 3.0
13.
0 1.0 759.0 3.3 1.5 1212.8
5156 1
2014 420000 2668 1.7
366.
6 87.7
172
.1 34.7 716.8 4.1 9.6 1393.2
63,52 8
Stockhol
m 2010 415000
1858 23.
3 N/
A 3.7 9.2 93.1 739.1
104.
9 82.7 1056.0
2967 9
2011 452000 2162
10. 2
N/
A 10.8
10.
5 39.5 728.5 68.0 51.4 918.8
4163 1
2012 470000 2064 3.5
N/
A 20.1 0.0 36.9 782.9 64.6 15.2 923.3
4992 9
2013 485581 1837 0.2
N/
A 2.5
62.
9 0.1 609.0 7.2 35.2 717.1
5180 3
2014 470000 2412
N/ A
N/
A 7.4 0.7 5.3 649.7 15.4 34.6 713.1
4664 1
Copenh
agen 2010 662000
1790 N/
A N/
A N/A
N/ A
N/
A 2753.0 N/A na 2753.0
1463 1
2011 815000 2724
N/ A
N/
A N/A
N/ A
N/
A 1675.0 N/A 18.0 1693.0 8905
2012 840000 2779
N/ A
N/
A N/A
N/ A
N/
A 1504.0 N/A 17.0 1521.0 4180
2013 800500 1839
N/ A
N/
A N/A
N/ A
N/
A 1545.0 N/A 18.0 1563.0 1690
2014 739000 1957
N/ A
N/
A N/A
N/ A
N/
A 1778.0 N/A 21.7 1799.7 5058
Tallinn 2010 390000 4453
18. 3
204.
3 385.0
395
.4 97.9 689.0
114.
3 65.7 1951.7 3976
2011 437517 4158
25. 8
204.
3 331.6
382
.2 84.0 730.8
237.
6 113.1 2083.6 4076
2012 440504 4906
22. 2
179.
1 306.7
242
.2 85.5 681.1
190.
8 151.2 1836.6 7195
2013 519319 6020
26. 7
314.
7 455.0
382 .2
104.
7 998.3
331.
8 198.3 2784.9 7172
2014 479000 5120
50. 7
349.
8 349.4
395 .4
111.
3 696.1
261.
1 259.5 2422.6 3216
Wastewater discharge is the most unevenly distributed fraction. Here again, the amount of wastewater produced on board a cruise ship is in direct correlation with the number of passengers. Figure 1 shows the number of passengers and the amount of the received wastewater in each port between 2010 and 2014. In the Port of Helsinki and the Ports of Stockholm, the amount of received wastewater is remarkably higher than the number of passengers; in Copenhagen Malmö Port and Port of Tallinn, the opposite is true. The decline in Copenhagen Malmö Port can most likely be explained by the restriction put on the amount of discharged wastewater.
cruise ships directly to the municipal wastewater systems. As a result, a vessel can discharge wastewater for as long as it is at berth. Copenhagen Malmö Port and the Port of Tallinn have already installed improvements in wastewater facilities and there are more to come. No exact data is available on treated discharged wastewater into the Baltic Sea.
Figure 1. The uneven distribution of discharged wastewater in the ports 2010–2014.
The Port of Tallinn receives notably more amounts of oily wastes than the other ports (Table 2). As seen in Table 3, the Port of Tallinn and the Ports of Stockholm are the only ports without a restriction on the quantity of oily wastes discharge allowed. The wastewater distribution among the ports is more unevenly distributed than the garbage. The port receiving the largest amounts of wastewater is clearly the Port of Helsinki, followed by the Ports of Stockholm. The other two ports, Port of Tallinn and Copenhagen Malmö Port receive remarkably less wastewater. The amount of wastewater at the Ports of Stockholm has risen, except for 2014, when it declined slightly. The Port of Tallinn is specialized in receiving and handling oily wastes, and has the necessary facilities for this. It received 42% of all oily wastes between 2010 and 2014. The port’s daughter company, Green Marine Ltd., processes oily wastes to produce recycled new products.
5.2 Waste management in the ports of the study
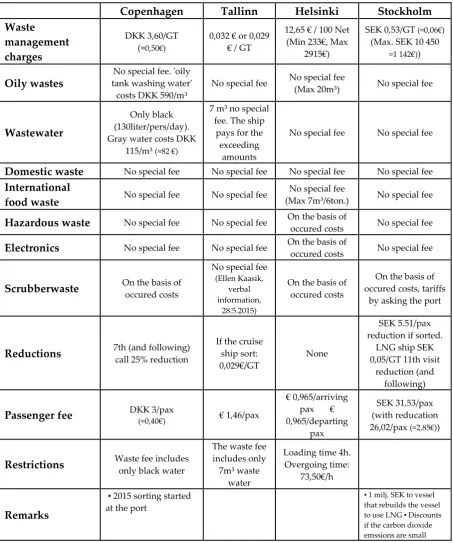
Waste management procedures in the four ports under study differ slightly from each other. The national laws on waste management in each country also vary. Table 3 shows the waste management charges. The ports have implemented the NSF-system, and Table 3 presents the basis for the tariff calculation. It also shows the similarities and differences of the ports, and the various possibilities and abilities to handle different waste fractions involved in the second study question.
amounts per se. Furthermore, each port as an independent business runs on slightly different grounds (also De Langen & Nijdam 2007).
Table 3. The study ports and their No special fee -tariffs in 2015.
Copenhagen Tallinn Helsinki Stockholm
Waste
management charges
DKK 3,60/GT (≈0,50€)
0,032 € or 0,029 € / GT
12,65 € / 100 Net (Min 233€, Max
2915€)
SEK 0,53/GT (≈0,06€)
(Max. SEK 10 450
≈1 142€))
Oily wastes
No special fee. 'oily tank washing water'
costs DKK 590/m³
No special fee No special fee
(Max 20m³) No special fee
Wastewater
Only black (130liter/pers/day). Gray water costs DKK
115/m³ (≈82 €)
7 m³ no special fee. The ship
pays for the exceeding
amounts
No special fee No special fee
Domestic waste No special fee No special fee No special fee No special fee
International
food waste No special fee No special fee
No special fee
(Max 7m³/6ton.) No special fee
Hazardous waste No special fee No special fee On the basis of
occured costs No special fee
Electronics No special fee No special fee On the basis of
occured costs No special fee
Scrubberwaste On the basis of occured costs
No special fee
(Ellen Kaasik, verbal information,
28.5.2015)
On the basis of occured costs
On the basis of occured costs, tariffs
by asking the port
Reductions 7th (and following) call 25% reduction
If the cruise ship sort: 0,029€/GT
None
SEK 5.51/pax reduction if sorted.
LNG ship SEK 0,05/GT 11th visit
reduction (and following)
Passenger fee DKK 3/pax (≈0,40€) € 1,46/pax
€ 0,965/arriving pax € 0,965/departing
pax
SEK 31,53/pax (with reducation 26,02/pax (≈2,85€))
Restrictions Waste fee includes only black water
The waste fee includes only 7m³ waste
water
Loading time 4h. Overgoing time:
73,50€/h
Remarks
▪ 2015 sorting started at the port
▪ 1 milj. SEK to vessel that rebuilds the vessel to use LNG ▪ Discounts if the carbon dioxide emssions are small
In Copenhagen Malmö Port, all the new quays can receive wastewater directly into the municipal wastewater system. The old quays do not have this ability, therefore Copenhagen Malmö Port has decided to limit wastewater quantities received. The port receives some amounts of black water free of charge, whereas grey water always has a fee.
charge, however, they must pay for grey water. But if they declare everything as black water they can leave it… And some vessels do.’ (Manager Strategy & Planning, Copenhagen)
Ships are given reductions if they run on LNG (Liquefied Natural Gas) or have small nitric oxide emissions. A ship that is rebuilt to use LNG will receive a reward of 1 million Swedish crowns. The Port of Stockholm is a forerunner in tempting shipping companies to become more environmentally friendly. The Port of Helsinki will give reductions to cruise ship discharging wastewater at the port from the year 2016 onwards (Port of Helsinki 2015).
Cruise vessels are obliged to send a form to the port clarifying the types of waste being discharged and in what quantities. This allows the port to order the right kind of containers and trucks to receive the fractions. As the numbers are usually estimates, however, the actual fractions may vary.
‘Of course, we are flexible. If the ship has already arrived at the quay and they have some other fractions and amounts of waste, we will come up with a solution to receive it. They [the ship] always notify the amounts in cubic meters which is only an estimation. These numbers are just indicative; sometimes there might be large differences. Sometimes the amounts might be less but usually it is more.’ (Harbor Master, Helsinki)
It is in the port’s interest to ensure that vessels calling at the ports are running according to the associated laws and regulations. However, the port cannot function as an authority. Additionally, the interviews had a common trend: the waste fee payable by cruise ships needs to break even with the expenditure on waste management at the ports.
5.3 Sorting, recycling and reusing of cruise ship generated waste
Recycling and reusing of waste is commonplace today. If they are sorted properly, most garbage subgroups can be reused or recycled. For example, oily wastes can be processed into a new oil product. The reception and recycling of cruise ship-generated waste in the ports of the Baltic Sea are well established although not very long-standing (approximately ten years). Every port stated that they recycle over 50% of all cruise ship-generated waste.
In all study ports, most of the cruise ship-generated waste is recycled. Thus, quantities of hazardous waste also go to treatments plants, where the waste is handled. To get a clear and measurable estimate of the best practice to use, a life cycle assessment (LCA) of waste management throughout the whole chain is required . Zuin et. al (2009) present a LCA on ship generated-waste at the port of Koper and conclude, among other things, that the use of disposal in landfill should be avoided; the use of electricity minimalized; and the production of waste on board cruise ships reduced. LCA methodology on waste management should be produced separately at all four ports; consequently, research on costs and (environmental) benefits would determine the best practice (also Del Borghi et al. 2015).
Referring to Zuin et. al (2009: 3037) ‘an integrated management of ship-generated waste will be achieved through the provisions of adequate reception facilities that encourage the disposal of waste in ports and terminals, through the adoption of recycling or reuse systems, and by removing any incentives for illegal discharges at sea.’ This can be interpreted in the Baltic Sea as sharing the burden of waste management between the closely located ports. Adequate reception facilities are not needed at each of the ports.
‘I think a system like this could work; if it is put into action in a good way. If the ports would specialize in some fractions the cooperation would most likely also improve.’ (Deputy Harbor Master, Stockholm)
was rejected. Scrubber waste is a new fraction of waste resulting from the sulfur directive enforced in January 2015. The Port of Tallinn is the only port to interpret this fraction as belonging to the NSF-system, and has therefore chosen to receive scrubber waste without extra charges. Scrubber waste is an expensive waste fraction and in the other ports, vessels will be charged per amounts of scrubber waste discharged.
Interview data provides answers to the third research question. The four ports work together and also search for new ideas and solutions together, in particular regarding environmentally friendly solutions. This outcome complies with Kunnaala-Hyrkki et. al (2015) that sharing best practices will allow ports to choose the most cost-effective measure to decrease their environmental impact. It is important to remember that these ports have the same customers, as the Manager Cruise and Ferry & Deputy Harbor Master states in his interview. The Head of Quality and Environmental Management at Tallinn also explained the cooperation:
‘We [the ports] are all together in many different organizations through which we meet many times a year. We can all easily call or send an email to each other and ask whatever we want’ (Head of Quality and Environmental Management, Tallinn)
The environmental section of the ports does not yet yield substantial economic benefits, but the experts interviewed considered that it will in the long term. The ports’ images are highly dependent on their environmental achievements. Current environmental discussions indicate that environmentally friendly innovative solutions will be profitable in the long run (also Makkonen et al. 2013). If an updated waste management system is introduced to the Baltic Sea, it is not only the responsibility of the ports. We noticed throughout the interviews that communication between the port, ship owner and the vessel itself is sometimes slow. Communication between the port and ship owner tends to run smoothly, but it takes time before information reaches the vessel.
6 Conclusions and the future research
The studied ports have quite similar environmental measurements, but there are also clear differences. A unified legislation for all EU ports would erase this variation. The ports would all have the same environmental legislation and procedures, and therefore also the same measurement systems. This would result in better environmental protection and maintain the ports competitiveness on an equal basis. Common environmental legislation is expected to support the proposed waste management system.
The first research question dealt with the quantities of cruise ship-generated waste handled in the Baltic Sea area today. The cruise ships sort their waste, and each of the four ports of the study handle different waste fractions. This study show, as per Butts (2007), that due to the growth of the cruising market, the laws and regulations, port reception facilities and waste management plans onboard individual cruise ships, the impact of waste streams varies. The Port of Tallinn, Ports of Stockholm and since 2016, the Port of Helsinki, all give special reductions on their waste fee if cruise ships follow their guidelines. This reduction means it will be cheaper to discharge wastewater at the port than into the sea. Copenhagen Malmö Port started receiving sorted fractions only in 2015. These reductions are incentives by the ports to encourage better waste handling by cruise ships.
receiving oily wastes. Its daughter company, Green Marine Ltd., is specialized in processing oily wastes and can even create a new oil product from oily wastes.
The third research question involved the collaboration between the four studied ports (also Verhoeven 2009). Regulations state that a ship needs to discharge any waste produced on board after the last port of call. There are exceptions: a ship may hold onto waste, if it can prove there is enough storage space on board. These regulations are designed to improve waste distribution between the ports and, most importantly, to reduce dumping waste into the sea. Our research indicates deficiencies in the plan.
Cruise lines have their own varying environmental objectives and targets. Therefore, strategies in finding optimal practices for waste handling, suitable to the current economy, also vary. Cruise lines cannot be quoted as one entity. Zuin et al. (2009: 3037) argues that `a responsible and integrated management of ship-generated waste will be achieved through the provision of adequate reception facilities that encourage the disposal of waste in ports and terminals, through the adoption of recycling or reuse systems, and by removing any incentives for illegal discharges at sea’. Collaboration between the ports, encouraging cruise ships to leave certain fractions in the specific port specialized in that fraction, will result in better waste handling management and, through that, a better environment (also Hall 2007; Hall et al. 2013; Lemmetyinen 2009). Waste should not be defined as waste if it can be reused or recycled. This would be the most sustainable solution for the entire Baltic Sea if cruise ships are able to hold on to waste, not discharging it to the sea but only at the port having the best reception facilities and high standards of reusing and recycling. The four ports considered this a good suggestion, if the cruise ship itself has the opportunity to hold on to the particular wastes (that is, if it has enough storage space).
Directions for the future research
A number of questions concerning waste management in the Baltic Sea ports emerged from this study. Research concerning cruise ship-generated waste from a vessel’s point of view is both desirable and necessary. An extensive study of cruise ships using interviews and surveys is desirable, for example, passenger attitudes and decisions provide a potential platform for future research (also Han et al. 2016). In addition, the prevention of production of waste itself needs to be addressed. An LCA of the waste chain, from the port to the end-station, would give an estimate of impacts (e.g., emissions, energy, incineration) deriving from the management. The assessment could be done on all fractions in all four ports as per Zuin et. al (2009).
Cruise ships are the vessel type discharging the largest amount of wastewater. The amount of wastewater produced by other vessel types is considerably lower, as they do not have as many passengers and crew members. Whether or not the ships themselves could do something to reduce the amount of waste produced is a vital question. It mainly concerns cruise companies, however, as ports have a limited influence on this. The ports of this study have good environmental policies and management, but an updated system with closer cooperation is needed. The interviewed experts in each harbor agreed that the ports cooperate satisfactorily, but there is also room for an improvement. As environmental image and environmental expertise among ports are important elements of the ports’ business, they need to pursue new innovative solutions.
Author Contributions: For research articles with several authors, a short paragraph specifying their individual contributions must be provided. The following statements should be used “X.X. and Y.Y. conceived and designed the experiments; X.X. performed the experiments; X.X. and Y.Y. analyzed the data; W.W. contributed reagents/materials/analysis tools; Y.Y. wrote the paper.” Authorship must be limited to those who have contributed substantially to the work reported.
be declared in this section. If there is no role, please state “The founding sponsors had no role in the design of the study; in the collection, analyses, or interpretation of data; in the writing of the manuscript, and in the decision to publish the results”.
Appendix 3. Interview questions (thematic expert interviews)
Person(s) interviewed: Status:
Port of: Date & time:
Do all cruise ships leave their waste at the port?
Does any cruise ship have a permit to NOT to leave their waste?
Who/what organization handles the waste?
What substances do you recycle?
Theme I: PRF
1. Do the ships leave ALL their waste at the port?
2. How does a ship inform the port about the waste to be left at the port?
3. Does the port have a “No special fee” system implemented?
- A good and equal system for ports in the Baltic Sea? Describe difficulties and advantages
4. Have any ships left scrubber waste at the port? If yes, how does the port deal with it?
- Has research been done on waste generated from scrubbers?
Theme II: Cruise ship-generated waste
1. How much of cruise ship-generated waste is recycled?
2. Is it possible to recycle 100 % of cruise ship-generated waste at the port?
3. How does the port deal with international food waste?
Theme III: Cooperation with the other ports (Helsinki, Tallinn, Stockholm and Copenhagen)
1. According to you, what works well and what does not in the ports’ cooperation? How could the cooperation be improved?
2. Could a system be introduced to the Baltic Sea area, whereby these four ports would cooperate fully and particular types of wastes would mainly be recycled in one port? What type of waste would be sent to which port and why?
Theme IV: National legislation on waste
1. Please give a short description of your country’s legislations.
2. Does each country’s waste legislation match the waste handling process at each port?
3. Difficulties and advantages with the national legislations and cruise ship generated waste.
1. Please describe future environmental strategies and developments. Why have they been designed in this way?
2. What are the ports’ motives in improving the recycling of ship-generated waste?
References
1. Adams, A. (2010). Planning for cruise ship resilience: A approach to managing cruise ship impacts in Haines, Alaska. Costal Management, 38:6, 654–664.
2. Andersson, K., Granhag, L. & Wilewska-Bien, M. (2016). The nutrients load from food waste generated onboards hips in the Baltic Sea. Marine Pollution Bulletin, 105:1, 359–366.
3. Avellaneda, P., Babcock, E. A., Brand, L., Englehardt, J. D., Lirman, D., Olascoaga, J., Rogge, W. F., Solo- Gabriele H. & Tchobanoglous, G. (2011). Relative risk Assessment of cruise ships biosolids disposal alternatives. Marine Pollution Bulletin, 62:10, 2157–2169.
4. Bell, M., Davarzani, H., Fahimnia, B. & Sarkis, J. (2015, in press). Greening ports and maritime logistics: A review. Transportation Research Part D: Transport and Environment. DOI:10.1016/j.trd.2015.07.007
5. Blas, S. S. & Carvajal-Trulijjo, E. (2014). Cruise passengers’ experiences in a Mediterranean port of call. The case study of Valencia. Ocean & Costal Management, 102:A, 307–316.
6. Brida, J. G. & Zapata, S. (2010). Cruise tourism: economic, socio-cultural and environmental impacts.
International Journal of Leisure and Tourism Marketing, 1:3, 205–226.
7. Brunila, O. (2013). The environmental status of the Port of Haminakotka. Publications of the centre for maritime studies. University of Turku, Turku. A69.
8. Butt, N. (2007). The impact of cruise ship generated waste on home ports and ports of call: A study of Southampton. Marine Policy, 31:5, 591–598.
9. Canfield, J. L. (2006). Independent Baltic State ports: the outlook for commercial viability. Maritime Policy & Management, 20:2, 133–152.
10. Canoves, G., Garay, L. & Prat, J. M. (2014). Barcelona, a leader destination in cruise passenger tourism: Keys, impacts and facts. International Journal of Tourism Sciences, 14:1, 23–49.
11. Carpenter, A. & Macgill, S. M. (2005). The EU Directive on port reception facilities for ship-generated waste and cargo residues: The result of a second survey on the provision and uptake of facilities in North Sea ports. Marine Pollution Bulletin, 50, 1541–1547.
12. Chang, Y-T., Park, H., Liu, S-M. & Roh, Y. (2015). Economic impact of cruise industry using input-output analysis: a case study of Incheon. Maritime Policy & Management, 43:1, 1–18.
13. CLIA (2015a). 2014 CLIA annual report. Cruise Line International Association. 10.5.201 http://www.cruising.org/about-the-industry/clia-annual-report
14. CLIA (2015b). Baltic Sea - Cruise Lines International Association. 6.5.2015. <http://www.cruising.org/regulatory/issues-facts/environment/baltic-sea>
15. Cruise Baltic Statistics (2015). Passengers, calls and turn-arounds per destination 2000–2015. 5.5.2015 https://www.cruisebaltic.com/media/52838/cruise-baltic-statistics 2000-2015.pdf
16. Dawson, J., Johnson, M. & Stewart, E. (2015). Risks and opportunities associated with change in the cruise tourism sector: community perspectives from Arctic Canada. The Polar Journal, 5:2, 403–427.
17. De Langen, P. W. & Nijdam, M. N. (2007). Charging systems for waste reception facilities in ports and level playing field: A case from north-west Europe. Coastal Management, 36:1, 109–124.
18. Del Borghi, A., Gallo, M., Manariti, R., Missanelli, E. & Strazza, C. (2015). Investigation of green practices for paper use reduction on board a cruise ship – a life cycle approach. The International Journal of Life Cycle Assessment, 20:7 982–993.
19. Diakomihalis, M. & Stefanidiki, E. (2011). Cruise ship supply chain: a field study on outsourcing decisions. International Journal of Decision Science, Risk and Management, 3:3/4, 369–383.
20. Directive 2000/59/EC (2008). On port reception facilities for ship-generated waste and cargo residues. 12.8.2015 http://eurlex.europa.eu/resource.html?uri=cellar: 15945efb-a7e8-4840-ab4d-0535f12692a8.0004.02/DOC_1&format=PDF
21. Directive 2008/98/EC (2008). On waste and repealing certain Directives. 12.8.2015 http://eur-lex.europa.eu/legalcontent/EN/TXT/PDF/?uri=CELEX:32008L0098 &from=EN 22. Directive 2012/33/EC (2012). Amending Council Directive 1999/32/EC as regards the sulphur content of marine
23. Dowling, R. K & Vasudavan, T. (2000). Cruising in the new millennium. Tourism Recreation Research, 25:3, 17–27.
24. Dragović, B., Meštrović, R., Tselentis, V., Tzannatos, E. & Škurić, M. (2015, in press). Ship emissions and their externalities in cruise ports. Transportation research Part D: Transport and Environment.
DOI:10.1016/j.trd.2015.11.007
25. Ducruet, C., Jacobs, W., Monios, J., Ng, A. K. Y., Notteboom, T., Rodrigue, J-P., Slack, B., Tam, K-C. Wilmsmeier, G. (2014). Port geography at the crossroads with human geography: between flows and spaces. Journal of Transport Geography, 41, 84–96.
26. European Commission (2015a). Transport & Environment - Emission from Maritime Transport. 3.12.2015 http://ec.europa.eu/environment/air/transport/ships.htm
27. European Commission (2015b). Scandinavian-Mediterranean Core Network Corridor -Transport. 3.12.2015 http://ec.europa.eu/transport/themes/infrastructure/ten-t-guidelines/corridors/scan-med_en.htm
28. European Commission (2015c). North Sea-Baltic Core Network Corridor - Transport. 3.12.2015 http://ec.europa.eu/transport/themes/infrastructure/ten-t-guidelines/corridors/northsea-baltic_en.htm 29. Flowerdew, R. & Martin, D. (2005). Methods in human geography. 366 p. 2nd edition, Prentice Hall, New
York.
30. Gui, L. & Russo, A. P. (2011). Cruise ports: a strategic nexus between regions and global lines – evidence from the Mediterranean. Maritime Policy & Management, 38:2, 129–150.
31. Hall, P. V. (2007). Seaports, Urban Sustainability, and Paradigm Shift. Journal of Urban Technology, 14:2, 87–101.
32. Hall, P.V, O’Brien, T. & Woudsma, C. (2013). Environmental innovation and the role of stakeholder collaboration in West Coast port gateways. Research in Transportation Economics, 42, 87–96.
33. Han, H., Hwang, J. & Jae, M. (2016). Cruise travellers’ environmentally responsible decision-making: An integrative framework of goal-directive behaviour and norm activation process. International Journal of Hospitality Management, 53, 94–105.
34. Hilmola, O-P. (2011). Container sea ports and network connections within the Gulf of Finland.
International Journal of Business Performance and Supply Chain Modelling, 3:4, 316–334.
35. Hilmola, O-P. (2012). The competitiveness of short sea shipping raking into account environmental, infrastructure and oil costs. A case study of the Tallinn- Warsaw route. International Journal of Ocean Systems Management, 1:3/4, 384–394.
36. Hrvoje, C. (2016). Challenges and prospects of valuation – cruise ship pollution case. Journal of Cleaner Production, 111:B, 487–498.
37. IMO (2011). MARPOL Consolidated Edition 2011. International Maritime Organization. 447 p. 5th edition, Polestar Wheatons Ltd, Exeter.
38. IMO (2015). International Convention for the Prevention of Pollution from Ships (MARPOL). 15.4.2016 http://www.imo.org/About/Conventions/ListOf Conventions/Pages/International-Convention-for-the-Prevention-of-Pollution-from-Ships-(MARPOL).aspx
39. Inkinen, T. & Tapaninen, U. (2009). Finnish-Russian transport and business expectations. World Review of Intermodal Transportation Research, 2:4, 279–295.
40. Johnson, D. (2002). Environmentally sustainable cruise tourism: a reality check. Marine Policy, 26, 261–270. 41. Kersten, W., Lorentz, H. & Ojala, L. (2013). Transport and logistics developments in the Baltic Sea region
until 2025. Journal of East-West Business, 19: 1-2, 16–32.
42. Klopott, M. (2013). Restructuring of environmental management in Baltic ports: case of Poland. Maritime Policy & Management, 40:5, 439–450.
43. Knudsen, O. F. (2009). Large oil tankers and the Baltic marine environment: A statistical survey. WMU Journal of Maritime Affairs, 8:2, 145–172.
44. Klein, R. A. (2011). Responsible Cruise Tourism: Issues of cruise tourism and sustainability. Journal of Hospitality and Tourism Management, 18, 107–116.
45. Kunnaala-Hyrkki, V., Brunila, O., Nygren, P. & Hämäläinen, E. (2015). Management of ports environmental effects - A comparative review. Publications of the Centre for Maritime Studies. University of Turku, Turku. A72.
46. Lam, J. S. L. & Notteboom, T. (2014). The greening of ports: A comparison of port management tools used by leading ports in Asia and Europe. Transport reviews, 34:2, 169–189.
48. Makkonen, T., Inkinen, T. & Saarni, J. (2013). Innovation types in the Finnish maritime cluster. WMU Journal of Maritime Affairs, 12:1, 1–15.
49. Marcussen, C. H. (2016). Visualising the network of cruise destinations in the Baltic Sea – a multidimensional scaling approach. Scandinavian Journal of Hospitality and Tourism, 1–15.
50. McCarthy, J. (2003). The cruise industry and port city regeneration: The case of Valletta. European Planning Studies, 11:3, 341–350.
51. MEPC (2011). 201(62): Amendments to the Annex of the protocol of 1978 relating to the international convention
for the prevention of pollution from ships, 1973 - Revised MARPOL Annex V. Adopted on 15 July 2011.
15.8.2015 http://www.imo.org/blast/blastData.asp?doc_id=14211&filename=201%2862%29.pdf
52. Notteboom, T. & Winkelmans, W. (2001). Structural changes in logistics: How do port authorities face the challenge? Maritime Policy and Management, 28:1, 71–89.
53. Notteboom, T. & Wouter, J. (2011). An evolutionary perspective on regional port systems: the role of windows of opportunity in shaping seaport competition. Environment and Planning A, 43, 1674–1692. 54. Ohlenschlager, J.P. & Gordiani, G. (2012). EMSA study on the delivery of ship-generated waste and cargo
residues to port reception facilities in EU ports. Final report. European Maritime Safety Agency, Copenhagen. 55. Polglaze, J. (2003). Can we always ignore ship-generated food waste? Marine Pollution Bulletin, 46, 33–38.
56. Port of Helsinki (2015a). Annual Report 2014. 10.6.2015
http://www.portofhelsinki.fi/instancedata/prime_product_julkaisu/helsinginsatama/embeds/helsinginsat amawwwstructure/37090_Vuosikertomus_englanti.pdf
57. Rodrigue, J., Comtois, C. & Slack, B. (2013). The geography of transportation system. 416 p. 3rd edition, Routledge, New York.
58. Rozmarynowska, M. (2015). SECA is real now - A short report on implementing the EU Sulphur Directive and the first market reactions. BPO, Baltic Ports Organization. Gdynia.
59. Sweeting, J. & Wayne, S. (2003). Interim Summary Report. A shifting tide - Environmental challenges and cruise industry responses. The center for environmental leadership in business, Washington.
60. Verhoeven, P. (2009). European ports policy: meeting contemporary governance challenges. Maritime Policy & Management, 36:1, 79–101.
61. Wild, P. & Dearing, J. (2000). Development of and prospects for cruising in Europe. Maritime Policy & Management, 27:4, 315–333.
62. Zuin, S., Belac, E. & Marzi, B. (2009). Life cycle assessment of ship-generated waste management of Luka Koper. Waste Management 29:12, 3036–3046.