Article
1
Pedestrian Injury Severity Analysis in Motor Vehicle
2
Crashes in Ohio
3
Majbah Uddin 1,* and Fahim Ahmed 2
4
1 Department of Civil and Environmental Engineering, University of South Carolina, Columbia, SC 29208,
5
USA; muddin@cec.sc.edu
6
2 Department of Civil and Environmental Engineering, University of South Carolina, Columbia, SC 29208,
7
USA; ahmedf@cec.sc.edu
8
* Correspondence: muddin@cec.sc.edu; Tel.: +1-803-447-4445
9
10
Abstract: Background: According to the National Highway Traffic Safety Administration, 116
11
pedestrians were killed in motor vehicle crashes in Ohio in 2015. However, no study to date has
12
analyzed crashes in Ohio exploring the factors contributing to the pedestrian injury severity
13
resulting from motor vehicle crashes. This study fills this gap by investigating the crashes
14
involving pedestrians exclusively in Ohio. Materials and Methods: This study uses the crash data
15
from the Highway Safety Information System, from 2009 to 2013. The explanatory factors include
16
the pedestrian, driver, vehicle, crash, and roadway characteristics. Both fixed- and
random-17
parameters ordered probit models of injury severity (where possible outcomes are major, minor, and
18
possible/no injury) were estimated. Results: The model results indicate that being older pedestrian
19
(65 and over), younger driver (less than 24), driving under influence (DUI), being struck by truck,
20
dark-unlighted roadways, six-lane roadways, and speed limit of 40 mph and 50 mph were
21
associated with more severe injuries to the pedestrians. Conversely, older driver (65 and over),
22
passenger car, crash occurring in urban locations, daytime traffic off-peak (10 AM to 3:59 PM),
23
weekdays, and daylight condition were associated with less severe injuries. Conclusion: This
24
study provides specific safety recommendations so that effective countermeasures could be
25
developed and implemented by the policy makers, which in turn will improve overall highway
26
safety.
27
Keywords: Pedestrian safety; Crash severity; Crash factors; Ordered probit model; Random
28
parameter model
29
30
1. Introduction
31
In the United States, 5,376 pedestrians were killed and 70,000 were injured in traffic crashes in
32
2015; this number of fatality is the highest since 1996 [1]. Every 1.6 hours a pedestrian was killed
33
and every 7.5 minutes a pedestrian was injured in traffic crashes, on average [1]. These fatalities
34
accounted for about 15 percent of total fatalities occurred on highways in the U.S. [2]. According to
35
the National Highway Traffic Safety Administration, 116 pedestrians were killed in motor vehicle
36
crashes in Ohio in 2015 [1]. These large number of fatalities and injuries of pedestrians from motor
37
vehicle crashes highlight the necessity of the analysis of such crashes. For that reason, several
38
studies have been undertaken by the researchers in the past investigating different crash factors
39
related to pedestrian-vehicle crashes, such as pedestrian, driver, roadway, environmental, vehicle,
40
crash, and land-use characteristics [3–16]. However, no study has analyzed crashes in Ohio
41
exploring the factors influencing injury severity of pedestrians. Hence, there is a need to investigate
42
the crashes involving pedestrians exclusively in Ohio.
43
Numerous research efforts have been published addressing pedestrian safety. The critical
44
aspects of pedestrian-vehicle crash investigation include finding contributing factors, employing a
45
variety of methodological techniques, level of spatial analysis (aggregation or disaggregation) and
46
mitigation strategies. Lee and Abdel-Aty [11] studied vehicle-pedestrian crashes at intersections
47
using 1999 to 2002 Florida crash data. The study concluded that pedestrian characteristics (e.g.,
48
older pedestrian, intoxicated), vehicle type (e.g., larger than passenger car), environment (e.g.,
dark-49
lighted condition) and adverse weather were the factors that contributed to injury severity.
Pour-50
Rouholamin and Zhou [14] studied single-vehicle single-pedestrian highway patrol reported crash
51
data from 2010 to 2013 in Illinois. They found that older and pedestrian without contrasting cloths,
52
pick-up truck, SUV, bus, divided highways, multilane highways, dark-unlighted condition, and
53
summer season were the factors contributing to injury severities. Abdul-Aziz et al. [3] studied
54
pedestrian-vehicle crash data (combined from several data sources) from 2002 to 2006 in New York
55
City and conducted a spatially disaggregated borough-based analysis on the built environment. The
56
study found that factors contributing to the injury severities were: roadway characteristics (e.g.,
57
number of lanes, grades, light condition, road surface), traffic attributes (e.g., signal control, type of
58
vehicle), and land-use characteristics (e.g., parking facilities, commercial area, industrial area). Kim
59
et al. [9] studied injury severity from single-vehicle single-pedestrian crash data from 1997 to 2000 in
60
North Carolina (NC). The contributing factors found in the study were the age of pedestrian, male
61
and intoxicated drivers, SUV, truck, two-way divided highway, off-roadway, freeway, turning
62
vehicle, speeding, dark-lighted condition, dark-unlighted condition, and commercial areas. Using
63
the same data Ulfarsson et al. [16] explored the fault assignment of pedestrian-motor vehicle crashes
64
in NC. Drivers were found at-fault in maneuvering act (e.g., turning, backing, merging) while
65
pedestrians were at-fault in case of unattentively crossing streets or walking along the streets. Both
66
pedestrian and driver were found at-fault in case of intoxication and in poorly lit environments.
67
Islam and Jones [8] analyzed injury severity of highway patrol reported pedestrian at-fault crash
68
data from 2006 to 2010 in Alabama. They found that the contributing factors differ in different
69
locations: urban location (e.g., female, pedestrian age, crash location, day of the week, winter and
70
summer season) and rural location (e.g., pedestrian age). Contributing factors not affected by
71
locations were dark-lighted conditions, two-lane roadways, and pedestrian of 12 years age or
72
younger. Ballesteros et al. [5] studied the association of pedestrian injury with vehicle type by
73
combining data from highway patrol reported crash, trauma registry and autopsy data from 1995 to
74
1999 in Maryland. The study found that SUV and pick-up trucks have a higher contribution to
75
injury severity than others. Moudon et al. [13] examined the pedestrian injury severity using crash
76
data on state routes from years 1999 to 2004 and city streets from years 2000 to 2004 in King County,
77
Washington. The contributing factors of injury severity for state routes include older pedestrian,
78
intersections without signals, vehicle speed while in city routes, middle-aged and younger
79
pedestrian, and number of residential streets. Zajac and Ivan [17] investigated the injury severity of
80
pedestrian crashes in rural Connecticut using 1989 to 1998 data from the Connecticut Department of
81
Transportation. They found that the factors that influence injury severities were older and
82
intoxicated pedestrian, intoxicated drivers, vehicle type, village, downtown fringe, and low-density
83
residential area.
84
All of the aforementioned studies have found influencing factors for injury severity of
85
pedestrians using data from different states in the U.S. These studies used various explanatory
86
variables, data sources and methodological techniques for the investigation of the crash data. Due
87
to the ordinal nature of the injury severity (i.e., fatality, disabling injury, evident injury, possible
88
injury, and no injury), this study uses ordered probit model to analyze vehicle,
single-89
pedestrian crash data in Ohio. Furthermore, underreporting of crashes and injury severity levels of
90
pedestrians are not uncommon in the highway patrol reported crash databases. To address this
91
unobserved heterogeneity issue, the standard fixed-parameters ordered probit model is also
92
extended to include random parameters in the model specification. Additionally, average direct
93
pseudo-elasticities of the estimated parameters are computed to determine the impact of factors on
94
2. Materials and Methods
96
The data used in this study, extracted from the Highway Safety Information System database,
97
consist of five years of single-vehicle, single-pedestrian crash records (2009 to 2013) in the state of
98
Ohio. After eliminating the crash observations with missing data in variables, a total of 3,184
99
observations of pedestrian injury severity was considered in the final dataset for model estimation.
100
Each observation records the injury severity of the pedestrian involved in the crash, along with
101
pedestrian, driver, vehicle, crash, and roadway characteristics. The final dataset consisted of 211 (6.6
102
percent) fatality, 749 (23.5 percent) disabling injury, 1,212 (38.1 percent) evident injury, 738 (23.2
103
percent) possible injury, and 274 (8.6 percent) no injury to the pedestrians. To ensure sufficient
104
observation in each injury severity level, following the approach used by other researchers [8,18,19],
105
the five injury severity levels were consolidated into three levels—major injury (fatality and disabling
106
injury), minor injury (evident injury) and possible/no injury (possible and no injury). Hence, the
107
dependent variable is the injury severity of a pedestrian from a single-vehicle crash where the
108
severity could be major, minor or possible/no injury. The data analysis was started with univariate
109
analysis [20]. Table 1 presents the descriptive statistics of the explanatory variables (i.e., crash
110
factors) considered in this study. All the variables are indicator variables (with values 0 and 1) and
111
the mean values represent the proportion of the variables. The mean value of the variable “day of
112
week” is 0.793, meaning that 79.3% of the pedestrian were involved in crashes during weekdays and
113
20.7% of the pedestrians were involved in crashes on weekends.
114
Due to the ordered nature of the crash injury severity level, several researchers used the ordered
115
logit/probit models to examine the relationship between crash factors and injury severity outcomes
116
[15,19,21]. With this in mind, this study models the pedestrian injury severity as follows: 0 for major
117
injury, 1 for minor injury, 2 for possible/no injury. The dependent variable ∗ is specified as
118
follows, which is a latent and continuous measure of pedestrian injury severity of each observation
119
[22].
120
∗= + (1)
where = vector of crash parameters to be estimated, = vector of explanatory variables (e.g.,
121
pedestrian, driver, vehicle, crash, and roadway characteristics), and = random error term, which is
122
assumed to be normally distributed with mean 0 and variance 1.
123
The observed injury severity data for each observation can be represented as follows under
124
the probit modeling framework and by using Eq. (1) [22].
125
= 0 if − ∞ ≤ ∗≤
= 1 if ≤ ∗≤
= 2 if ≤ ∗≤ ∞ (2)
where = parameters or thresholds to be estimated between two adjacent injury severity levels that
126
define .
127
The ordered probit model is defined as follows [22].
128
( = 0) = Φ(− )
( = 1) = Φ( − ) − Φ(− )
( = 2) = 1 − Φ( − )
(3)
where ( = 0) is the probability that observation has the least order of injury severity (i.e.,
129
major injury) given a crash occurred and Φ(⋅) = standard normal cumulative distribution function.
130
To account for the unobserved heterogeneity, the fixed-parameters ordered probit model is
131
extended to include random-parameters as follows [23], where error term is correlated with the
132
unobserved factors in .
133
= + (4)
where = randomly distributed term (e.g., normal, lognormal, triangular) corresponding to -th
134
explanatory variable. The random-parameters estimation is done using Halton sequence approach
135
Table 1. Descriptive statistics of the explanatory variables
137
Explanatory Variable Mean SD
Pedestrian Characteristics Age
Less than 18 (1 if less than 18 years old; 0 otherwise) 0.225 0.417 18–24 (1 if between 18 and 24 years; 0 otherwise) 0.156 0.363 25–54 (1 if between 25 and 54 years; 0 otherwise) 0.427 0.495 55–64 (1 if between 55 and 64 years; 0 otherwise) 0.104 0.305
Over 65 (1 if over 65 years; 0 otherwise) 0.088 0.284
Gender (1 if female; 0 otherwise) 0.415 0.493
Driver Characteristics Age
Less than 24 (1 if less than 24 years old; 0 otherwise) 0.190 0.393 25–54 (1 if between 25 and 54 years; 0 otherwise) 0.526 0.499 55–64 (1 if between 55 and 64 years; 0 otherwise) 0.147 0.354
Over 65 (1 if over 65 years; 0 otherwise) 0.137 0.344
Gender (1 if female; 0 otherwise) 0.437 0.496
DUI driving (1 if yes; 0 otherwise) 0.074 0.261
Restraint use (1 if seat belt; 0 otherwise) 0.868 0.338
Vehicle Type
Passenger car (1 if passenger car; 0 otherwise) 0.549 0.498
Truck (1 if truck; 0 otherwise) 0.048 0.213
Minivan (1 if minivan; 0 otherwise) 0.064 0.245
SUV (1 if SUV; 0 otherwise) 0.178 0.393
Pickup truck (1 if pickup truck; 0 otherwise) 0.127 0.332
Crash Characteristics
Crash location (1 if urban; 0 otherwise) 0.875 0.331
Time of day
7 AM–9:59 AM (1 if between 7 AM and 10 AM; 0 otherwise) 0.119 0.324 10 AM–3:59 PM (1 if between 10 AM and 4 PM; 0 otherwise) 0.302 0.459 4 PM–6:59 PM (1 if between 4 PM and 7 PM; 0 otherwise) 0.227 0.418 7 PM–6:59 AM (1 if between 7 PM and 7 AM; 0 otherwise) 0.352 0.478
Day of week (1 if weekday; 0 otherwise) 0.793 0.405
Lighting Condition
Daylight (1 if daylight; 0 otherwise) 0.557 0.497
Dark-unlighted (1 if dark without street light; 0 otherwise) 0.117 0.321 Dark-lighted (1 if dark with street light; 0 otherwise) 0.268 0.443
Weather condition (1 if adverse weather; 0 otherwise) 0.176 0.381
Roadway Characteristics Number of lanes
Two lanes (1 if two lanes roadway; 0 otherwise) 0.290 0.454
Four lanes (1 if four lanes roadway; 0 otherwise) 0.585 0.493
Six lanes (1 if six lanes roadway; 0 otherwise) 0.087 0.282
Speed limit
≤ 35 mph (1 if ≤ 35 mph roadway; 0 otherwise) 0.698 0.459
40 mph (1 if 40 mph roadway; 0 otherwise) 0.113 0.317
50 mph (1 if 50 mph roadway; 0 otherwise) 0.121 0.326
≥ 60 mph (1 if ≥ 60 mph roadway; 0 otherwise) 0.068 0.251
To estimate the impact of variables on the likelihood of each injury severity level, elasticities are
139
often used. For a binary indicator variable (has value 0 or 1), the direct pseudo-elasticities are
140
computed as follows [9], which measures the change in estimated probability percentage of injury
141
severity when the dummy variable is switched between 0 and 1.
142
= [given = 1] − [given = 0]
[given = 0] (5)
where = probability of injury severity level for observation as defined in Eq. (3) and is
143
the -th explanatory variable associated with injury severity level for observation .
144
3. Results and Discussion
145
To validate the crash data, a two-thirds random sample was generated from the master dataset.
146
The injury severity was selected for strata so that the proper proportioning is ensured. A
random-147
parameters ordered probit model was then estimated using the two-thirds sample. Then the model
148
is compared using the holdout sample (i.e., remaining one-third sample). It was found that the
149
coefficients decreased relative to the population size. That means the dataset is valid for the
150
modeling approach [24].
151
Fixed-parameters ordered probit model was estimated using maximum likelihood method and
152
random-parameters ordered probit model was estimated using simulated maximum likelihood
153
method. Five hundred Halton draws were used and it was assumed that random parameters are
154
normally distributed. The variables in both models were included in the model specifications when
155
they were statistically significant at 90% confidence level. Furthermore, to avoid the inclusion of
156
highly correlated variables in the model, a correlation matrix was estimated and the results indicate
157
that none of the variables have a correlation value of more than ±0.20 [19,25]. In addition, the
158
Variance Inflation Factor (VIF) values were estimated for all explanatory variables. The VIF values
159
were less 10, which suggest that there is no need to concern about multicollinearity in the model.
160
Table 2 presents the model estimation results along with the average direct pseudo-elasticity values.
161
Note that elasticity values are calculated from the random-parameters model results. A likelihood
162
ratio test was performed, following the methodology articulated in Washington et al. [22], to compare
163
the fixed- and random-parameters models.
164
= −2[ ( ) − ( )] (6)
where ( ) = log-likelihood at the convergence of the fixed-parameters model (-3,336.07) and
165
( ) = log-likelihood at the convergence of the random-parameters model (-3,318.15). The
Chi-166
square test statistic with seven degrees of freedom resulted in a value greater than 99.99% confidence
167
limit, which indicates the validity of the random-parameters model over the corresponding
fixed-168
parameters model. Seven parameters, older pedestrian, older driver, DUI driving, truck, urban
169
location, dark-unlighted condition, and six lane roadways, were found to be random with statistically
170
significant standard deviations at 90% confidence level.
171
With regard to the pedestrian characteristics, only older pedestrian (age 65 and over) was found
172
as statically significant. The parameter is random that is normally distributed with mean -0.39 and
173
standard deviation of 1.00. Given these values, 65.2 percent of the observations have parameter
174
values less than 0 and 34.8 percent greater than 0. For the majority of the observations, older
175
pedestrians were found to be involved in more severe injuries. The elasticities demonstrated a 43.1
176
percent increase in major injuries, 5.1 percent decrease in minor injuries and 59.4 percent decrease in
177
possible/no injuries for older pedestrians. One possible explanation could be the fact that the older
178
individuals may have less injury sustaining capability. Kim et al. [9,10] also found that with the
179
increase in pedestrian age the probability of sustaining severe injury increases.
180
As for the driver characteristics, younger (less than 24) and older driver (65 and over), and
181
driving under influence (DUI) were found as statistically significant. It was determined that when
182
a pedestrian is struck by a young driver, the probability of major injuries sustained by the pedestrian
183
injuries by 21.1 percent. This may be because older drivers are more cautious while driving
185
compared to young drivers as well as they drive more on lower speed roads. The older driver
186
variable was found to be random and normally distributed with mean 0.23 and standard deviation
187
1.03. With these estimates, 41.5 percent of the observations have parameter values less than 0 and
188
58.5 percent greater than 0. This implies that slightly less than half of the observations result in
189
severe injuries to pedestrians and slightly more than half result in less severe injuries. The variable
190
DUI was found as random and normally distributed with mean -0.80 and standard deviation 1.07.
191
The estimates suggest that for 77.3 percent of the observations the parameter values were less than 0.
192
That means for the majority of the cases, where the driver was intoxicated, resulted in more severe
193
injuries to the pedestrians. Specifically, intoxicated drivers were found to increase the probability
194
of major injuries by 95.2 percent. This effect is the highest among other variables.
195
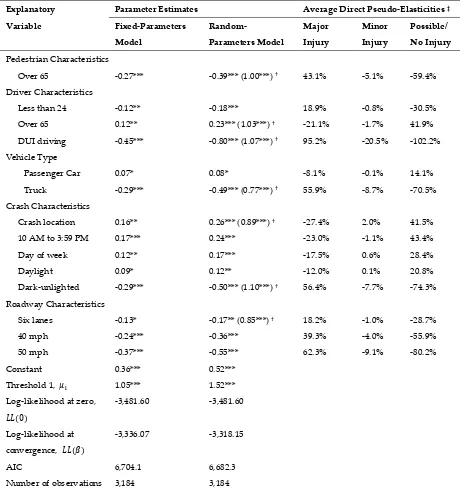
Table 2. Parameter estimates and elasticities
196
Explanatory
Variable
Parameter Estimates Average Direct Pseudo-Elasticities ‡
Fixed-Parameters
Model
Random-Parameters Model
Major
Injury
Minor
Injury
Possible/
No Injury
Pedestrian Characteristics
Over 65 -0.27*** -0.39*** (1.00***) † 43.1% -5.1% -59.4%
Driver Characteristics
Less than 24 -0.12** -0.18*** 18.9% -0.8% -30.5%
Over 65 0.12** 0.23*** (1.03***) † -21.1% -1.7% 41.9%
DUI driving -0.45*** -0.80*** (1.07***) † 95.2% -20.5% -102.2%
Vehicle Type
Passenger Car 0.07* 0.08* -8.1% -0.1% 14.1%
Truck -0.29*** -0.49*** (0.77***) † 55.9% -8.7% -70.5%
Crash Characteristics
Crash location 0.16** 0.26*** (0.89***) † -27.4% 2.0% 41.5%
10 AM to 3:59 PM 0.17*** 0.24*** -23.0% -1.1% 43.4%
Day of week 0.12** 0.17*** -17.5% 0.6% 28.4%
Daylight 0.09* 0.12** -12.0% 0.1% 20.8%
Dark-unlighted -0.29*** -0.50*** (1.10***) † 56.4% -7.7% -74.3% Roadway Characteristics
Six lanes -0.13* -0.17** (0.85***) † 18.2% -1.0% -28.7%
40 mph -0.24*** -0.36*** 39.3% -4.0% -55.9%
50 mph -0.37*** -0.55*** 62.3% -9.1% -80.2%
Constant 0.36*** 0.52***
Threshold 1, 1.05*** 1.52***
Log-likelihood at zero,
(0)
-3,481.60 -3,481.60
Log-likelihood at
convergence, ( )
-3,336.07 -3,318.15
AIC 6,704.1 6,682.3
Number of observations 3,184 3,184
*** Statistically significant at α = 0.01; ** statistically significant at α = 0.05; * statistically significant at α =
197
0.1; † the value in parenthesis represents the standard deviation of the random parameter; ‡ average direct
198
In terms of the vehicle type, the analysis results showed that passenger car and truck were the
200
statistically significant type. Being struck by a passenger car is found to decrease the likelihood of
201
major injuries by 8.1 percent and increase the likelihood of possible/no injuries by 14.1 percent. The
202
variable “truck” was found to be random that is normally distributed with mean -0.49 and standard
203
deviation of 0.77. This indicates that for 73.8 percent of the observations involving a truck
204
experienced more severe injuries, whereas 26.2 percent experienced less severe injuries.
205
Furthermore, being struck by a truck was found to increase the likelihood of major injuries by 55.9
206
percent and decrease the likelihood of possible/no injuries by 70.5 percent. Trucks are heavier than
207
other vehicle types, which leads to greater momentum and consequently more severe injuries.
208
Similar results have been reported in the works by Abdul-Aziz et al. [3], Kim et al. [9,10], and Lee
209
and Abdel-Aty [11].
210
With respect to the crash characteristics, crash location, crash time and day, and lighting
211
condition were found as statistically significant. Crash occurring in urban locations were found as
212
random and normally distributed with mean 0.26 and standard deviation 0.89. This implies that
213
38.5 percent of the observations have parameter values less than 0 and 61.5 percent greater than 0.
214
The majority of the observations have less severe injuries to the pedestrians when the crash occurred
215
in urban locations. Specifically, crash in urban locations is associated with lower likelihood of major
216
injuries (27.4 percent) and a higher likelihood of possible/no injuries (41.5 percent) compared to that
217
of rural locations. One possible explanation could be the fact that emergency response time is faster
218
in urban areas. When pedestrian-vehicle crashes occurred between 10 AM and 3:59 PM (daytime
219
traffic volume off-peak), the likelihood of major injuries decreased by 23.0 percent and the likelihood
220
of possible/no injuries increased by 43.4 percent. This may be due to the lower traffic during the
off-221
peak hour and consequently lower chance of being involved in crashes in general. Crashes occurred
222
during weekdays were found to decrease the likelihood of major injuries by 17.5 percent and increase
223
the likelihood of possible/no injuries by 28.4 percent. Typically, during weekdays traffic volume is
224
higher than weekend, which in turn results in lower travel speed. Hence, the risk of a pedestrian
225
being involved in high impact speed reduces and consequently the chance of major injuries decreases.
226
The findings from the analysis for lighting condition variables are intuitive. The elasticity results
227
indicate that the probability of major injuries was found to decrease under daylight condition (12.0
228
percent), whereas the probability of major injuries was found to increase under dark-unlighted
229
condition (56.4 percent). Under dark conditions, roadway visibility is lower, which may lead to
230
more severe injuries to the pedestrians. These findings related to lighting variable are consistent to
231
that prior pedestrian-vehicle safety studies [3,8–10,16]. Furthermore, the parameter for the
dark-232
unlighted condition was found to be random and normally distributed with mean -0.50 and standard
233
deviation 1.10. Given these estimates, 67.5 percent of the observations under dark-unlighted
234
conditions were found to be involved in more severe injuries and 32.5 percent in less severe injuries.
235
As for the roadway characteristics, six-lane roadways, speed limit being 40 mph and 50 mph
236
were found to be significant in explaining pedestrian-vehicle crash injury severity. The variable
237
indicating six-lane roadways was found to be random and normally distributed with mean -0.17 and
238
standard deviation 0.85. This indicates that slightly more than half of the observations (57.9 percent)
239
where crashes occurred on six-lane roadways experienced more severe injuries and slightly less than
240
half experienced less severe injuries. The probability of major injuries sustained by pedestrians was
241
found to increase by 18.2 percent when crashes occurred on six-lane roadways and the probability of
242
possible/no injuries was found to decrease by 28.7 percent. A possible reason could be the fact that
243
six-lane roadways carry higher traffic; hence, the chance of pedestrians being involved in crashes
244
increases. In terms of the speed limit, higher speed was found to increase the likelihood of major
245
injuries: 39.3 percent in case of 40 mph and 62.3 percent in case of 50 mph. These findings are
246
reasonable since higher speed impact results in more severe injuries.
247
In summary, this study is the first to use both fixed- and random-parameters ordered probit
248
modeling approach to pedestrian vehicle crash data in a U.S. state. It investigated the crash factors
249
and determined which factors are influencing injury severity of pedestrians from motor vehicles
250
2, some of the variables were found as not significant in explaining the injury severity. However,
252
some of those variables were found as significant by other studies from different U.S. states. For
253
instance, Kim et al. [9] found that in North Carolina male pedestrians are 1.2 times more vulnerable
254
to major injuries compared to female pedestrians. Islam and Jones [8] demonstrated that in Alabama
255
female pedestrians are about 3 percent more likely to involved in major injuries compared to their
256
male counterparts. Conversely, Pour-Rouholamin and Zhou [14] found that pedestrian gender is
257
not significant for the injury severity in Illinois. This study found the pedestrian gender as not
258
significantly related to the injury severity in Ohio. A similar pattern is present among the studies
259
for the SUV. This current study did not found SUV as significant in explaining injury severity. Lee
260
and Abdel-Aty [11] reported similar finding for the pedestrians in Florida. However, Ballesteros et
261
al. [5] indicated that SUVs were associated with more severe injuries in Maryland.
Pour-262
Rouholamin and Zhou [14] reported that SUVs increases the probability of being involved in severe
263
injuries by 8.6 percent. The above further validates the disaggregated pedestrian vehicle crash data
264
analysis in Ohio.
265
4. Conclusions and Recommendations
266
This study employed fixed- and random-parameters ordered probit models to analyze pedestrian,
267
driver, vehicle, crash, and roadway factors associated with the injury severity of pedestrians from
268
pedestrian-vehicle crashes in the state of Ohio using crash data from 2009 to 2013. The injury
269
severity of pedestrians was defined as major injury, minor injury, and possible/no injury.
270
Likelihood ratio test suggested that random-parameters model is appropriate to investigate
271
pedestrian crash data due to the unobserved heterogeneity (i.e., unobserved factors) coming from
272
underreporting of the pedestrian severity level. It was found from the analysis that being older
273
pedestrian (65 and over), younger driver (less than 24), driving under influence (DUI), being struck
274
by truck, dark-unlighted roadways, six-lane roadways, and speed limit of 40 mph and 50 mph were
275
associated with more severe injuries to the pedestrians. In contrast, older driver (65 and over),
276
passenger car, crash occurring in urban locations, daytime traffic off-peak (10 AM to 3:59 PM),
277
weekdays, and daylight condition were associated with less severe injuries. The method and findings
278
from the study would help policy makers in state departments of transportation to identify critical
279
crash factors and to develop safety countermeasures to reduce pedestrian injuries.
280
Based on the findings, a number of practical policy implications can be made. First, it is
281
recommended to use marked crosswalks along with a traffic signal or stop sign where older
282
pedestrian crashes are higher [26]. These older pedestrians need special attention since the
283
population aged 65 and over from 2000 to 2010 in Ohio has increased by 7.6 percent [27]. Second,
284
for young drivers, stricter traffic rules and regulations could be enforced. Third, driver intoxication
285
was found as a factor having the highest effect on pedestrian injury severity and the probability of
286
major injuries increased by about 73 percent when the driver hitting the pedestrian was intoxicated.
287
Hence, it is highly recommended to enforce stricter rules and fines in case of DUI. Fourth, the impact
288
of a pedestrian being hit by a heavier vehicle is significantly higher than that of a passenger car.
289
Hence, based on the number of the pedestrian fatalities and injuries caused by trucks, local and state
290
authorities may consider restricting truck traffic from certain segments of the roadways with high
291
pedestrian activities and during peak pedestrian hours. Fifth, the difference in the effect of lighting
292
on pedestrian injury severity is observed from the analysis; daylight condition was associated with
293
less severe injuries and dark condition was associated with more severe injuries. Hence, it is
294
recommended to increase the level of lighting (i.e., installing street lights) at the roadway segments
295
where the chance of pedestrian crashes is higher during nighttime. Sixth, the probability of a
296
pedestrian sustaining more severe injury was higher from crashes occurring on six-lane roadways.
297
Having six lanes in a roadway segment implies longer crossing distance for pedestrians and higher
298
traffic volume. Pedestrian signals are recommended to be installed if it is warranted by pedestrian
299
volume. Also, grade-separated pedestrian crossings could be installed. Lastly, pedestrian-vehicle
300
a pedestrian being involved in major injuries. In areas with high pedestrian activities and with crash
302
history, as a safety countermeasure, speed limit could be reduced.
303
Acknowledgments: The authors acknowledge the Highway Safety Information System Laboratory for their help
304
in providing data for this study.
305
Author Contributions: Both authors performed all the tasks equally in data analyses and writing of the paper.
306
Conflicts of Interest: There is no conflict of interest.
307
References
308
1. National Highway Traffic Safety Administration. Traffic Safety Facts 2015 Data. Available online:
309
crashstats.nhtsa.dot.gov/Api/Public/ViewPublication/812375 (accessed on 5 March 2018).
310
2. Bureau of Transportation Statistics. Transportation Fatalities by Mode. Available online:
311
https://www.bts.gov/content/transportation-fatalities-mode (accessed on 5 March 2018).
312
3. Abdul-Aziz, H.M.; Ukkusuri, S.V.; Hasan, S. Exploring the determinants of pedestrian–vehicle crash
313
severity in New York City. Accid. Anal. Prev. 2010, 50, 1298–1309, DOI: 10.1016/j.aap.2012.09.034.
314
4. Anderson, R.W.G.; McLean, A.J.; Farmer, M.J.B.; Lee, B.H.; Brooks, C.G. Vehicle travel speeds and the
315
incidence of fatal pedestrian crashes. Accid. Anal. Prev. 1997, 29, 667–674, DOI:
10.1016/S0001-316
4575(97)00036-5.
317
5. Ballesteros, M.F.; Dischinger, P.C.; Langenberg, P. Pedestrian injuries and vehicle type in Maryland, 1995–
318
1999. Accid. Anal. Prev. 2004, 36, 73–81, DOI: 10.1016/S0001-4575(02)00129-X.
319
6. Davis, G. Relating severity of pedestrian injury to impact speed in vehicle-pedestrian crashes: Simple
320
threshold model. Transp. Res. Rec. 2010, 1773, 108–113, DOI: 10.3141/1773-13.
321
7. Garder, P.E. The impact of speed and other variables on pedestrian safety in Maine. Accid. Anal. Prev. 2004,
322
36, 533–542, DOI: 10.1016/S0001-4575(03)00059-9.
323
8. Islam, S.; Jones, S.L. Pedestrian at-fault crashes on rural and urban roadways in Alabama. Accid. Anal. Prev.
324
2014, 72, 267–276, DOI: 10.1016/j.aap.2014.07.003.
325
9. Kim, J.-K.; Ulfarsson, G.F.; Shankar, V.N.; Kim, S. Age and pedestrian injury severity in motor-vehicle
326
crashes: A heteroskedastic logit analysis. Accid. Anal. Prev. 2008, 40, 1695–1702, DOI:
327
10.1016/j.aap.2008.06.005.
328
10. Kim, J.-K.; Ulfarsson, G.F.; Shankar, V.N.; Mannering, F.L. A note on modeling pedestrian injury severity
329
in motor vehicle crashes with the mixed logit model. Accid. Anal. Prev. 2010, 42, 1751–1758, DOI:
330
10.1016/j.aap.2010.04.016.
331
11. Lee, C.; Abdel-Aty, M. Comprehensive analysis of vehicle–pedestrian crashes at intersections in Florida.
332
Accid. Anal. Prev. 2005, 37, 775–786, DOI: 10.1016/j.aap.2005.03.019.
333
12. Matsui, Y. Effects of vehicle bumper height and impact velocity on type of lower extremity injury in
334
vehicle–pedestrian accidents. Accid. Anal. Prev. 2005, 37, 633–640, DOI: 10.1016/j.aap.2005.03.005.
335
13. Moudon, A.V.; Lin, L.; Jiao, J.; Hurvitz, P.; Reeves, P. The risk of pedestrian injury and fatality in collisions
336
with motor vehicles, a social ecological study of state routes and city streets in king county, Washington.
337
Accid. Anal. Prev. 2011, 43, 11–24, DOI: 10.1016/j.aap.2009.12.008.
338
14. Pour-Rouholamin, M.; Zhou, H. Investigating the risk factors associated with pedestrian injury severity in
339
Illinois. J. Safety Res. 2016, 57, 9–17, DOI: 10.1016/j.jsr.2016.03.004.
340
15. Sasidharan, L.; Menedez, M. Partial proportional odds model—An alternate choice for analyzing
341
pedestrian crash injury severities. Accid. Anal. Prev. 2014, 72, 330–340, DOI: 10.1016/j.aap.2014.07.025.
342
16. Ulfarsson, G.F.; Kim, S.; Booth, K.M. Analyzing fault in pedestrian–motor vehicle crashes in North
343
Carolina. Accid. Anal. Prev. 2010, 42, 1805–1813, DOI: 10.1016/j.aap.2010.05.001.
344
17. Zajac, S.S.; Ivan, J.N. Factors influencing injury severity of motor vehicle-crossing pedestrian crashes in
345
rural Connecticut. Accid. Anal. Prev. 2003, 35, 369–379, DOI: 10.1016/S0001-4575(02)00013-1.
346
18. Uddin, M.; Huynh, N. Truck-involved crashes injury severity analysis for different lighting conditions on
347
rural and urban roadways. Accid. Anal. Prev. 2017, 108, 44–55, DOI: 10.1016/j.aap.2017.08.009.
348
19. Uddin, M.; Huynh, N. Factors influencing injury severity of crashes involving HAZMAT trucks. Int. J.
349
Transp. Sci. Tech. 2018, 7, 1–9, DOI: 10.1016/j.ijtst.2017.06.004.
350
20. Huynh, N.; Uddin, M.; Minh, C.C. Data analytics for intermodal freight transportation applications. In
351
K.; Elsevier Science: Cambridge, MA, USA, 2017; pp. 241–262; ISBN: 9780128097151; DOI:
10.1016/B978-0-353
12-809715-1.00010-9.
354
21. Abdel-Aty, M. Analysis of driver injury severity levels at multiple locations using ordered probit models.
355
J. Safety Res. 2003, 34, 597–603, DOI: 10.1016/j.jsr.2003.05.009.
356
22. Washington, S.P.; Karlaftis, M.G.; Mannering, F.L. Statistical and Econometric Methods for Transportation Data
357
Analysis. 2nd ed.; Chapman & Hall/CRC: Boca Raton, FL, USA, 2011; ISBN: 9781420082852.
358
23. Greene, W. Econometric Analysis. 3rd ed.; Macmillan: New York, USA, 1997; ISBN: 9780023466021.
359
24. Anderson, J.; Hernandez, S. Roadway classifications and the accident injury severities of heavy-vehicle
360
drivers. Anal. Methods Accid. Res. 2017, 15, 17–28, DOI: 10.1016/j.amar.2017.04.002.
361
25. Pai, C.-W.; Saleh, W. Modelling motorcyclist injury severity by various crash types at T-junctions in the
362
UK. Safety Sci. 2008, 46, 1234–1247, DOI: 10.1016/j.ssci.2007.07.005.
363
26. Koepsell, T.; McCloskey, L.; Wolf, M.; Moudon, A.V.; Buchner, D.; Kraus, J.; Patternson, M. Crosswalk
364
markings and the risk of pedestrian-motor vehicle collisions in older pedestrians. JAMA 2002, 288, 2136–
365
2143, DOI: 10.1001/jama.288.17.2136.
366
27. U.S. Census Bureau. The Older Population: 2010. Available online:
367