Article
1
On Predicting the Seismic Response of
Acceleration-2
Sensitive Non-Structural Components in Buildings
3
Carmine Lima 1 and Enzo Martinelli 2,*
4
1 Department of Civil Engineering, University of Salerno, Fisciano (SA), Italy; [email protected]
5
2 Department of Civil Engineering, University of Salerno, Fisciano (SA), Italy; [email protected]
6
* Correspondence: [email protected]; Tel.: +39-089-964098
7
8
Abstract: This paper is intended at highlighting the main mechanical parameters controlling the
9
behavior of the so-called "acceleration-sensitive" Non-Structural Components (NSCs). In the first
10
part a short review of the current state of knowledge and the critical issues related to the prediction
11
of the seismic response of NSCs is reported. Then, the paper presents the results of a numerical
12
parametric analysis intended to capture the key features of the dynamic response of a
two-degree-13
of-freedom (2DOF) system which is supposed to be representative of both the main structure and
14
the "non-structural" component (NSC). Particularly, it allows to simulate the coupled behaviour of
15
both main structure and NSC and evaluating their response. The main parameters controlling the
16
dynamic response of NSCs emerge from this study, which could pave the way towards formulating
17
more mechanically consistent relationships for evaluating the maximum accelerations induced by
18
seismic shakings on NSCs.
19
Keywords: seismic analysis; non-structural components; nonlinear analysis; 2DOF; maximum
20
acceleration
21
22
1. Introduction
23
Significant research efforts have been produced in the last decades in order to formulate sound
24
criteria for the design of structures in seismic areas resulting in the current generation of seismic
25
codes and guidelines [1,2]. Such codes provide designers with consistent performance-based
26
approaches for designing and assessing structures against earthquake-induced actions. However, a
27
series of critical issues, which are not completely assessed by the current code provisions, emerge by
28
analyzing damages suffered from existing structures in recent earthquake events [3]. Specifically, the
29
most evident critical issues are related to the not accurate prediction of the seismic response of
“non-30
structural components” (NSCs) [4-6] as it emerges in the aftermaths of the event occurred in Emilia
31
Region, Italy [7], where several precast buildings mainly suffered damage related to inadequate
32
design of connections between structural members and NSCs [8,9]. Therefore, predicting the seismic
33
response of NSCs is perceived as one of the most important challenges in the seismic engineering
34
community [10,11].
35
Several definitions for the very wide class of objects often referred to as NSCs are available in
36
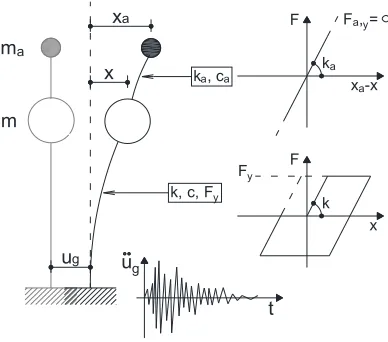
the scientific literature and recent seismic codes [2]. As a general definition any “object” which does
37
not contribute to support both gravity and seismic actions in the model considered in structural
38
analysis is considered a “non-structural” or “secondary” element. As matter of fact, partitions,
39
masonry infill, suspended ceilings, finishing, as well as specific equipment are the most common
40
NSCs in buildings.
41
Moreover, recent scientific researches and technical codes introduced further definitions and
42
classifications of NSCs: a review of these definitions is available in the literature [12]. Generally, they
43
are based on different aspects, such as the component's purpose or function, its connection to the
44
main structure and the sensitivity to particular aspects of the dynamic response (acceleration,
45
displacement, and so on).
46
Over the classification of NSCs, the main objective of various seismic codes in force in
47
earthquake-prone countries (e.g., [1,13-16]) is to evaluate the maximum acceleration, and thus the
48
maximum inertial force, on NSC induced by the expected seismic shaking. However, rules and
49
relationships provided with this purpose are generally simple (and often simplistic) and disregard
50
fundamental parameters which could significantly affect the dynamic response of NSCs.
51
As matter of principle, rules and relationships currently provided involve few parameters
52
dealing with the intensity of the expected earthquake, the elastic properties of both the main structure
53
and the NSC and the position in height of the NSCs within the main structure. A thorough discussion
54
about the limitation of code formulations has been recently proposed [12]; specifically, it emerges
55
that the analyzed code-provisions either disregard or not explicitly consider the nonlinear behavior
56
of the main structure which may clearly affect the excitation of the NSCs by “filtering” the seismic
57
signal [17].
58
Therefore, this paper presents a wide parametric analysis based on a two-degree-of-freedom
59
(2DOF) system used for simulating the dynamic response of a general structure equipped with a
60
NSC. The study is aimed at quantifying the inertial forces induced on NSCs. The key results of the
61
parametric analysis are summarized in section 3 which demonstrate what are the relevant parameters
62
which affect the prediction of the maximum seismic actions induced on NSCs and their variations.
63
2. Parametric Investigation
64
The interaction which affect the dynamic response of the main structure and the NSC connected
65
to the main structure itself is investigated considering a two-degree-of-freedom (2DOF) system. It is
66
considered as a simple possible representation of the main structure directly shaken by the
67
earthquake ground motion and the NSC. The system considered in this study is schematically
68
represented in Figure 1.
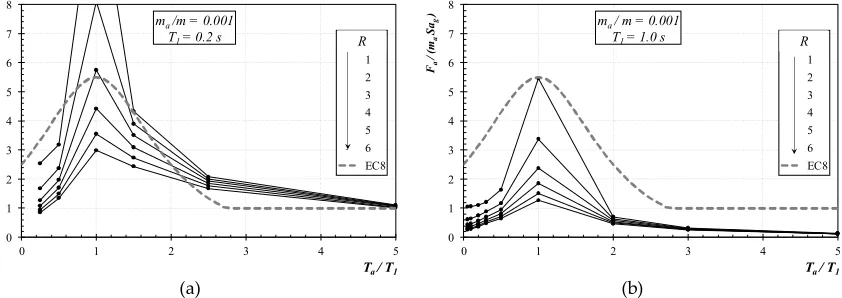
69
Figure 1. The 2DOF system considered in the Nonlinear Time-History Analyses.
70
An elastic-perfectly-plastic behaviour is supposed for the main structure which is denoted in
71
Figure 1 by the mass m. It is characterised by elastic stiffness k, viscous damping c and yielding force
72
Fy (Figure 1). The parameters x and x denote the relative displacement and velocity of the main
73
structure with respect to the ground, respectively. The NSC is represented by its mass ma and it is
74
connected to the main structure by an elastic element with stiffness ka. The relative displacement of
75
the NSC with respect to the ground is denoted with xa. The viscous damping coefficient ca, which
76
relates the viscous force with the relative velocity xa of the NSC with respect to the ground,
77
completes the description of the 2DOF system under investigation.
78
k xa-x
Fy
Fa,y=
ka
k, c, Fy
F
x F
t
x ka, ca
xa
ma
ug m
However, nonlinear behavior is not considered for the NSC in this study, since it is mainly
79
devoted at evaluating the maximum forces induced on secondary components without covering
80
aspects related to displacements.
81
The system represented in Figure 1 allows to consider the coupled behaviour of the main
82
structure and NSC and can result more appropriate than systems generally adopted in similar studies
83
which are often based on the dynamic analysis of two uncoupled single-degree-of-freedom (SDOF)
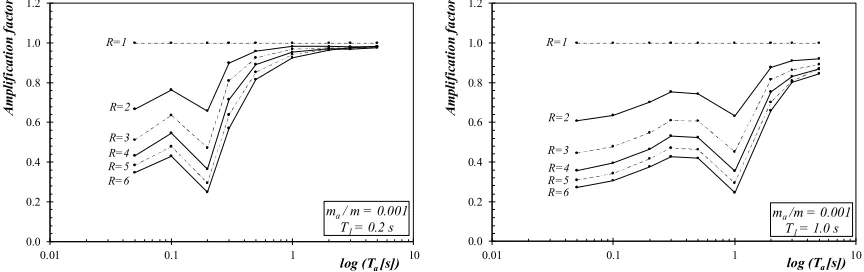
84
systems in series [18,19]. As matter of fact, the latter systems are based on the simulation of a SDOF
85
system representing the main structure whose response is, subsequently, considered as the ground
86
motion for the secondary SDOF system which simulates the NSC. Such a study can result in accurate
87
prediction if the NSC-to-structure mass ratio is quite small (i.e., ma/m→0) and thus the mass ma does
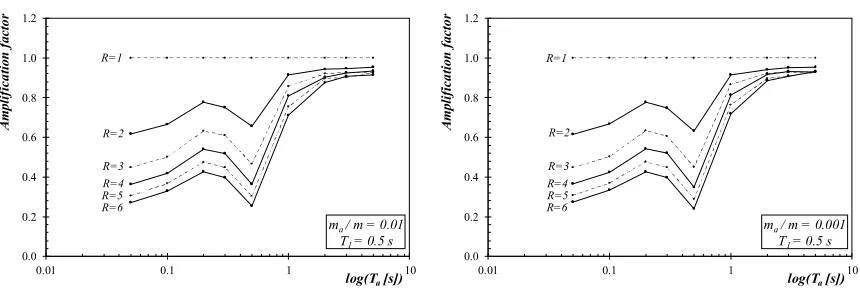
88
not influence the dynamic response of the main structure. For sake of generality, the present study
89
does not consider this approximation and a system of coupled equilibrium equations is actually
90
solved by means of a piecewise approach based on the Beta-Newmark numerical algorithm [20]. Such
91
an algorithm is used in order to handle nonlinearities in the dynamic response of the following
92
system:
93
; ,
a a a a r y g
a a a a a a a g
mx cx c x x k x x F x k F mu
m x c x x k x x m u
(1)
In eq. (1) the reaction Fr(x,k,Fy) is the unique nonlinear part which includes both the relative
94
displacement x of the main structure and its stiffness k and yielding force Fy (Figure 1).
95
A set collecting 264 natural records has been employed as ground motion in the nonlinear
time-96
history analyses of the 2DOF system described above carrying out a very wide parametric analysis.
97
Such a set is based on the seismic events and records considered in an important study investigating
98
the nonlinear response of SDOF systems [21].
99
The main parameters that govern the dynamic response of the 2SDOF system representing the
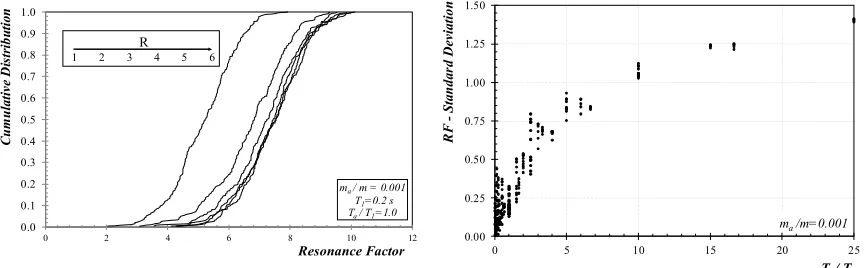
100
main structure and NSC (Figure 1) can be easily derived from eq. (1). As matter of fact, the mass ratio
101
ma/m, as well as other parameters usually considered for describing the response of SDOF oscillators
102
can be identified as key parameters which control the response of both the main structure and the
103
NSC.
104
- Main structure: T12 m
k ; 2
c
km ; (2)
- Non-structural component: a 2 a
a m T
k ; 2
a a
a a
c
k m . (3)
The elastic period T and the damping ratio ξ [20] defined in eqs. (2) and (3) for the main structure
105
and the NSC, respectively, completely control the response of the 2DOF system in the linear-elastic
106
range. Thus, a linear time-history analysis performed for a given seismic record the allows to evaluate
107
both the maximum inertial force on the main structure Fel and the one induced on NSC Fa,el. Then, the
108
elastic threshold Fy denoting the yielding of the main structure (Figure 1) can be easily defined as a
109
further parameter of interest for the present parametric analysis as it corresponds in principle to a
110
given value of the force reduction factor R:
111
el
y
F F
R . (4)
However, the yielding force of the NSCs could be defined in a completely similar way, but it is
112
omitted in this study as the response of the NSC is kept in the linear range. Finally, the parameters
113
defined above have been changed within the range of variation defined below:
114
mass ratio ma/m {0.01; 0.001};
115
main structure period T1 [0.2 s; 2.0 s];
secondary period Ta [0.1 s; 5.0 s];
117
force-reduction factor R [1; 6].
118
Otherwise, both damping ratios ξ and ξa referred to the main structure and NSC have been
119
assumed constant and equal to 0.05. As one can see, the considered mass ratios refer to a class of
120
NSCs (such as systems, ceilings, etc.) whose mass is significantly lower (and fairly negligible) with
121
respect to the structural one. The values of period T1 are intended to cover the whole range of
low-122
medium rise buildings, either made of steel or concrete, meanwhile, the values assumed for Ta are
123
intended to cover a wide spectrum of NSCs and their connections to the main structures, ranging
124
from very stiff (and rigidly connected) components to fairly soft (or flexibly connected) ones. Finally,
125
the values of R range from non-dissipative structures (R=1) up to highly dissipative ones (R=6,
126
simulating high ductility steel frames).
127
3. Results of the Parametric Analysis
128
The parametric analysis has been performed considering the 264 seismic signals mentioned in
129
section 2 [21] and the range of variation of the relevant parameters listed in the previous section. As
130
a result, 142560 nonlinear time-history analyses have been carried out on 2DOF systems considering
131
five values of T1 (ranging between 0.2 s and 2.0 s) and nine for Ta (between 0.1 s e 5.0 s). Two mass
132
ratios (0.01 and 0.001) and six values of the force-reduction factor R (from 1 to 6) have been also
133
considered.
134
Figure 2 depicts the behaviour of the ratio between the maximum absolute acceleration Fa/ma of
135
NSC and the corresponding peak ground acceleration (PGA=S·ag=·Sg) against the period ratio Ta/T1.
136
The reduction factor R ranges from 1 to 6 and each point is the average of the results obtained from
137
the 264 seismic signals considered in the parametric study. Furthermore, the response of the code
138
provision reported in EC8 [1] is also depicted resulting in a unique trend as such code formulation
139
does not depends from the inelastic behaviour of the main structure which is simulated by R in this
140
study. Specifically, Figure 2,a refers to the case of main structures characterised by short period of
141
vibration (T=0.2 s) and demonstrates that the force reduction factor R significantly affect the
142
maximum ratios Fa/ma·S·ag corresponding to the resonance condition (Ta=T1), while the effect of R
143
results less important for long periods of NSC (Ta/T1>2). Moreover, the simplified code provision
144
reported in EC8 [1] miss this effect resulting in good agreement with numerical experiments only in
145
the case of R≈3÷4, which is the range of values of the q-factor generally adopted for a large majority
146
of new RC structures.
147
(a) (b)
Figure 2. Maximum absolute acceleration on the structural components (T1=0.2 s and T1=1.0 s).
148
A similar response is observed in Figure 2,b in which the case of a medium-to-long-period of the
149
main structure is represented. Furthermore, the maximum values of the ratio Fa/ma·S·ag, obtained for
150
medium-to-long period structures (Figure 2,b) are lower than the corresponding ones evaluated for
151
short-period structures represented in Figure 2,a. This effect is due to the reduction in the acceleration
152
induced on the main structure for long periods. However, the force reduction factor still affects
153
0 1 2 3 4 5 6 7 8
0 1 2 3 4 5
Fa
/
(m
a
S
ag
)
Ta / T1
ma /m = 0.001
T1 = 0.2 s
1 2
3 4 5 6
EC8 R
0 1 2 3 4 5 6 7 8
0 1 2 3 4 5
Fa
/
(m
a
S
ag
)
Ta / T1
ma / m = 0.001
T1 = 1.0 s
1 2
3 4 5 6
significantly the dynamic response of the NSC for ratios of periods Ta/T1< 2, while the prediction
154
based on EC8 [1] results too conservative especially for high values of R.
155
Moreover, the results obtained for the mass ratio ma/m=0.01 overlap the ones obtained for
156
ma/m=0.001, pointing out that, in this range of values, the mass ratio has a negligible influence on the
157
resulting response. Therefore, the results for ma/m=0.01 are omitted hereinafter for sake of brevity.
158
As a final remark, easily supported by elementary mechanical intuition, Figure 2 shows that the
159
two parameters T1 and R play a fundamental role in determining the maximum absolute acceleration
160
Sa of NSCs and should be considered as key parameters in order to improve the relationships
161
currently available for evaluating the dynamic response of non-structural components [1] which
162
generally does not take into account the effect of the force reduction factor R.
163
3.1. Definition of relevant response parameters
164
The results reported Figure 2 and, specifically, the comparison with the simplified formula
165
adopted in EC8 [1] point out the significant lack of predictive capability affecting the aforementioned
166
seismic code. As matter of fact, a wider number of parameters should be considered with the aim of
167
enhancing the accuracy of formulations currently available. Moreover, more consistent response
168
parameters can also be defined for describing the dynamic response of NSCs. For this purpose, [18,19]
169
defined the following two parameters:
170
- the Amplification Factor:
1 1
1 1
; , / , / ; ,
1; , / , / ; ,
a a a a
a a a a
F R T T T m m
AF
F R T T T m m ; (5)
- the Resonance Factor:
1 1
1 1
; , / , / ; ,
; , / , / ; ,
a a a a a
r a a a
F R T T T m m m
RF
F R T T T m m m . (6)
The AF is the ratio of the maximum total acceleration in the non-structural member evaluated
171
for an inelastic main structure and the corresponding one derived by considering an elastic behaviour
172
of the latter, while the RF is the ratio between the maximum total acceleration of the NSC and the
173
maximum value of the total acceleration in the main structure.
174
In the following two subsections, the variation of the aforementioned parameters is deeply
175
analyzed against the properties which fully describe the dynamic response of the system.
176
3.1.1. The Amplification Factor
177
The amplification factor AF is analysed and plotted against the period of the NSC for values of
178
the factor R ranging from 1 to 6 and a given period T1. Specifically, Figure 3 reports this diagram for
179
the case of ma/m=0.001 for two values of T1 (namely, 0.2 and 1.0 s) and confirms the non-monotonic
180
shape of the curves already described in the literature [19]. Moreover, it highlights once again the key
181
role played by the factor R (especially in the case of NSCs with low period of vibration) which is
182
completely neglected by the current code formulations.
183
Figure 3. Amplification factor vs. the Ta (T1=0.2 s; T1=1.0 s).
184
0.0 0.2 0.4 0.6 0.8 1.0 1.2
0.01 0.1 1 10
A
m
p
li
fi
ca
ti
o
n
f
a
ct
o
r
log (Ta [s])
ma / m = 0.001
T1 = 0.2 s
R=1
R=2
R=3 R=4 R=5 R=6
0.0 0.2 0.4 0.6 0.8 1.0 1.2
0.01 0.1 1 10
A
m
p
li
fi
ca
ti
o
n
f
a
ct
o
r
log (Ta [s])
ma /m = 0.001
T1 = 1.0 s
R=1
R=2
Figure 4. Amplification factor vs. the Ta (ma/m=0.01; ma/m=0.001).
185
Moreover, Figure 4 consists of two diagrams reporting AF for the same fundamental period
186
T1=0.5 s and two different mass ratio ma/m. It confirms that mass ratio is almost irrelevant for the
187
resulting response, at least if it is kept lower than 0.01.
188
3.1.2. The Resonance Factor
189
The Resonance Factor allows to obtain a more compact and representative representation of the
190
huge amount of numerical results obtained in the parametric analysis herein performed. As shown
191
in eq. (6), the denominator of RF is clearly related to the elastic spectral pseudo-acceleration of the
192
main structure for the period T1 and the damping ratio , thus the possible analytical description of
193
RF in terms of the other relevant parameters would straightforwardly lead to the quantification of Fa
194
which is the numerator in eq. (6).
195
The following figures report the trend obtained for RF by the NLTH analyses. It is worthy to
196
note that each point represents the average of 264 values derived by considering the set of seismic
197
signals considered.
198
Figure 5. Mean value of RF vs. period ratio Ta/T1 for ma/m=0.001 (T1=0.2 s and T1=0.5 s).
199
Figure 5 reports the (mean) values of RF for the cases of T1{0.2 s; 0.5 s} and mass ratio equal to
200
0.001. As a result of the short period of the main structure and the range of variation of the secondary
201
system periods (see section 2) the Ta/T1 ratio spans in a rather wide range. Therefore, the curves (one
202
for each value of the R factor) clearly highlight the following key features of RF:
203
all curves stem out from the unit at Ta/T1=0, as a clear consequence of the definition of RF;
204
an almost linear branch connects the unit with the maximum value of RF (denoted as RFmax,
205
in the following) which depend on a resonance condition between the two components and
206
is almost unaffected by R (at least for R>2);
207
a decreasing branch follows the resonance point and describes the behaviour of RF which
208
clearly vanishes as Ta/T1→ꝏ.
209
Similar shapes are represented in Figure 6 for longer periods and in Figures 7 and 8 which report
210
the same results for the higher mass ratio ma/m=0.01.
211
0.0 0.2 0.4 0.6 0.8 1.0 1.2
0.01 0.1 1 10
A
m
p
li
fi
c
a
ti
o
n
f
a
c
to
r
log(Ta[s])
ma / m = 0.01
T1 = 0.5 s
R=1
R=2
R=3 R=4 R=5 R=6
0.0 0.2 0.4 0.6 0.8 1.0 1.2
0.01 0.1 1 10
A
m
p
li
fi
c
a
ti
o
n
f
a
c
to
r
log(Ta[s])
ma / m = 0.001
T1 = 0.5 s
R=1
R=2
R=3 R=4 R=5 R=6
0 1 2 3 4 5 6 7 8
0.0 5.0 10.0 15.0 20.0
R
es
o
n
a
n
c
e
fa
ct
o
r
Ta/ T1
ma / m = 0.001
T1 = 0.2 s
6 5 4 3 2 1 R
0 1 2 3 4 5 6 7 8
0.0 2.0 4.0 6.0 8.0 10.0
R
es
o
n
a
n
c
e
fa
ct
o
r
Ta/ T1
ma / m = 0.001
T1 = 0.5 s
Figure 6. Mean value of RF vs. period ratio Ta/T1 for ma/m=0.001 (T1=1.0 s and T1=2.0 s).
212
Figure 7. Mean value of RF vs. period ratio Ta/T1 for ma/m=0.01 (T1=1.0 s and T1=2.0 s).
213
Figure 8. Mean value of RF vs. period ratio Ta/T1 for ma/m=0.01 (T1=1.0 s and T1=2.0 s).
214
Figure 9. Typical distribution of RF for the considered seismic signals and its Standard Deviation
215
against the period ratio Ta/T1.
216
0 1 2 3 4 5 6 7 80.0 1.0 2.0 3.0 4.0 5.0
R es o n a n c e fa ct o r
Ta/ T1
ma / m = 0.001
T1 = 1.0 s
6 5 4 3 2 1 R 0 1 2 3 4 5 6 7 8
0.0 0.5 1.0 1.5 2.0 2.5
R es o n a n c e fa ct o r
Ta/ T1
ma / m = 0.001
T1 = 2.0 s
6 5 4 3 2 1 R 0 1 2 3 4 5 6 7 8
0.0 5.0 10.0 15.0 20.0
R e so n a n c e f a c to r
Ta/ T1
ma / m = 0.01
T1 = 0.2 s
6 5 4 3 2 1 R 0 1 2 3 4 5 6 7 8
0.0 2.0 4.0 6.0 8.0 10.0
R e so n a n c e f a c to r
Ta/ T1
ma / m = 0.01
T1 = 0.5 s
6 5 4 3 2 1 R 0 1 2 3 4 5 6 7 8
0.0 1.0 2.0 3.0 4.0 5.0
R e so n a n c e f a c to r
Ta/ T1
ma / m = 0.01
T1 = 1.0 s
6 5 4 3 2 1 R 0 1 2 3 4 5 6 7 8
0.0 0.5 1.0 1.5 2.0 2.5
R e so n a n c e f a c to r
Ta/ T1
ma / m = 0.01
T1 = 2.0 s
6 5 4 3 2 1 R 0.0 0.1 0.2 0.3 0.4 0.5 0.6 0.7 0.8 0.9 1.0
0 2 4 6 8 10 12
C u m u la tiv e D is tr ib u tio n Resonance Factor
ma / m = 0.001
T1=0.2 s
Ta / T1=1.0
1 2 3 4 5 6
R 0.00 0.25 0.50 0.75 1.00 1.25 1.50
0 5 10 15 20 25
R F -S ta n d a rd D e v ia ti o n
Finally, since only the mean values of the key numerical results have been reported in the
217
previous figures, further aspects dealing with the record-to-record variability of the RF need to be
218
addressed. Therefore Figure 9 reports both cumulative distribution and standard deviation of the RF
219
obtained for the structural systems analysed in this study. As for the former, the curves plotted in
220
Figure 9 shows that the R only influences the median value of RF. As for the latter, the standard
221
deviation is mainly controlled by the period ratio Ta/T1.
222
4. Concluding remarks
223
This paper addressed the issue of determining the maximum actions induced in NSCs of
224
structures under earthquake excitation. The results of the wide parametric analysis reported in this
225
paper can be summarized as follows:
226
the available code provisions lack in predicting the seismic response of NSCs often
227
neglecting relevant parameters which control the dynamic response of such
228
components;
229
the nonlinear behavior of the main structure, although neglected in the current code
230
provisions, significantly affect such a response;
231
the definition of the "resonance factor" RF is a key step in quantifying the maximum
232
seismic-induced actions;
233
the relationship between RF and the other parameters clearly emerged by the
234
parametric analysis; specifically, the main period T1, the ratio Ta/T1 and the reduction
235
factor R are key quantities which influence the average value of RF determined in
236
the nonlinear time history analyses carried out on a wide set of recorded seismic
237
signals;
238
the standard deviation of RF is basically affected by the period ratio Ta/T1.
239
Although further and more accurate calibrations might be proposed in the future, in the
240
Author’s opinion, relating the non-structural response to the structural one is the key conceptual
241
contribution of this study.
242
Acknowledgments: This study is part of the DPC-ReLUIS 2014-2018 Research Project whose financial support
243
is gratefully acknowledged. Moreover, the Author wishes to acknowledge the contribution of Mr. Claudio
244
Malangone who worked on the numerical analyses reported in this paper within the framework of his M.Sc.
245
Thesis in Civil Engineering at the University of Salerno.
246
References
247
1. Comité Européen de Normalisation. EN 1998-1 (2005). Eurocode 8 - Design of structures for earthquake
248
resistance. Part 1: General rules, seismic actions and rules for buildings. Brussels (BE), 2005.
249
2. Federal Emergency Management Agency. FEMA 356 (2000). Prestandard and commentary for the seismic
250
rehabilitation of buildings, 1st edition. Washington (USA), 2000.
251
3. Verderame, G.M.; Iervolino, I.; Ricci, P. Report on the damages on buildings following the seismic event of
252
6th April 2009 time 1:32 (UTC) - L’Aquila M = 5.8. ReLUIS Report 2009. Available online: www.reluis.it.
253
(accessed on 28 Feb 2018).
254
4. Earthquake Engineering Research Institute. EERI (1984). Nonstructural Issues of Seismic Design and
255
Construction. Berkeley (USA), 1984.
256
5. National Institute for Educational Policy Research. Educational Facilities Research Center. EFRC (2005) -
257
Case Studies of Seismic Nonstructural Retrofitting in School Facilities. Tokyo (JP), 2005.
258
6. De Sortis, A.; Di Pasquale, G.; Dolce, M.; Gregolo, S.; Papa, S.; Rettore, G.F. Linee guida per la riduzione
259
della vulnerabilità di elementi non strutturali arredi e impianti. Presidenza del Consiglio dei Ministri
260
Dipartimento della Protezione Civile (in Italian), 2009.
261
7. Parisi, F.; De Luca, F.; Petruzzelli, F.; De Risi, R.; Chioccarelli, E.; Iervolino, I. Field inspection after the May
262
20th and 29th 2012 Emilia-Romagna earthquakes. 2012. Available online: www.reluis.it (accessed on 28 Feb
263
8. Magliulo, G.; Ercolino, M.; Petrone, C.; Coppola, O.; Manfredi, G. The Emilia Earthquake: Seismic
265
Performance of Precast RC Buildings. Earthquake Spectra, 2018, Vol. 30(2), 891-912.
266
9. Belleri, A.; Brunesi, E.; Nascimbene, R.; Pagani, M.; Riva, P. Seismic performance of precast industrial
267
facilities following major earthquakes in the Italian territory. ASCE Journal of Performance of Constructed
268
Facilities, 2015, Vol. 29(5).
269
10. Sullivan, T.J.; Calvi, P.M.; Nascimbene, R. Towards improved floor spectra estimates for seismic design.
270
Earthquakes and Structures, 2013, Vol. 4(1), 109-132.
271
11. Filiatrault, A.; Sullivan, T. Performance-based Seismic Design of Nonstructural Building Components: The
272
Next Frontier of Earthquake Engineering. Earthquake Engineering and Engineering Vibration, Special Issue on
273
the State-of-the-Art and Future Challenges of Earthquake Engineering, 2014, Vol. 13(1) Supplement:17-46.
274
12. Martinelli, E.; Faella, C. An overview of the current code provisions on the seismic response non-structural
275
components in buildings. Applied Mechanics and Materials, 2015, Vol. 847, 273-280.
276
13. Swiss Society of Engineers and Architects 261. SIA (2003) - Actions on Structures. Zurich (CH), 2003.
277
14. Western States Seismic Policy Council. International Code Council. Seismic Provisions of the 2006
278
International Building Code (IBC). Reno Nevada (USA), 2007.
279
15. Canadian Commission on Building and Fire Codes and National Research Council of Canada. NBCC (2005)
280
- National Building Code of Canada. Montreal, Ottawa (CA), 2005.
281
16. Standards Association of New Zealand. NZS (1992) - Code of practice for general structural design and
282
design loading for buildings, Volume 1: Code of Practice. Wellington (NZ), 1992.
283
17. Villaverde, R.; Chauduri, S.R. Effect of Building Nonlinearity on Seismic Response of Nonstructural
284
Components: A Parametric Study. ASCE Journal of Structural Engineering, 2008, Vol. 134(4), 661-670.
285
18. Oropeza, M.; Favez, P.; Lestuzzi, P. Seismic response of nonstructural components in case of nonlinear
286
structures based on floor response spectra method. Bulletin of Earthquake Engineering, 2010, Vol. 8(2),
387-287
400.
288
19. Lin, J.; Mahin, S.A. Seismic Response of Light Subsystems on Inelastic Structures. ASCE Journal of Structural
289
Engineering, 1985, Vol. 111(2), 400–417.
290
20. Clough, R.W.; Penzien, J. Dynamics of Structures, 2nd Edition. McGraw-Hill Book Co., Singapore, 1993.
291
21. Miranda, E. Inelastic Displacement Ratios for Structures on Firm Sites. ASCE Journal of Structural
292
Engineering, 2000, Vol. 126(10), 1150-1158.
293