a.SCatch: Semantic Structure
for Architectural Floor Plan Retrieval
Markus Weber1,2, Christoph Langenhan3, Thomas Roth-Berghofer1,2, Marcus Liwicki1,2, Andreas Dengel1,2, and Frank Petzold3
1 Knowledge Management Department,
German Research Center for Artificial Intelligence (DFKI) GmbH Trippstadter Straße 122, 67663 Kaiserslautern, Germany
2 Knowledge-Based Systems Group, Department of Computer Science,
University of Kaiserslautern, P.O. Box 3049, 67653 Kaiserslautern
3
Chair of Architectural Informatics Faculty of Architecture Technical University of Munich Arcisstrasse 21, 80333 Munich, Germany
{firstname.lastname}@dfki.de,{lastname}@tum.de
Abstract. An architect’s daily routine involves working with drawings. They use either a pen or a computer to sketch out their ideas or to do a drawing to scale. We therefore propose the use of a sketch-based approach when using the floor plan repository for queries. This enables the user of the system to sketch a schematic abstraction of a floor plan and search for floor plans that are structurally similar. We also pro-pose the use of a visual query language, and a semantic structure as put forward by Langenhan. An algorithm extracts the semantic structure sketched by the architect on DFKI’s Touch& Write table and compares the structure of the sketch with that of those from the floor plan repos-itory. The a.SCatch system enables the user to access knowledge from past projects easily. Based on CBR strategies and shape detection tech-nologies, a sketch-based retrieval gives access to a semantic floor plan repository. Furthermore, details of a prototypical application which al-lows semantic structure to be extracted from image data and put into the repository semi-automatically are provided.
Key words: semantic building design, architecture, image understand-ing, case based reasonunderstand-ing, graph theory
1
Introduction
The a.vista concept suggested by Langenhan [1]concerns geometrical search strategies rather than today’s keyword-based search methods. The configuration of space and the relations between physical structures are hard to represent us-ing keywords, in fact transformus-ing these structural configurations into verbally expressed typologies tends to produce fuzzy and often imprecise descriptions of architecture. The project investigates the limits of architectural spaces repre-sented in drawings. By recording space boundaries in a database, information about the specific project is transferred to both the descriptive world of ar-chitecture and the computer. Every building in the database features a digital fingerprint, which shows the architectural situation of the building in terms of its space boundaries and their characteristics. By providing a sketch of the required architectural configuration, the user creates a digital search fingerprint for the query. The search fingerprint can then be compared with the fingerprints in the database.
The a.vista concept includes a semantic structure describing the fingerprint of a floor plan within a graph representation. This formal representation is the foundation of the a.SCatch system. In Section 2 we discuss related work and current methods. Section 3 discusses the semantic structure used to formalize the content of a floor plan and Section 4 describes the a.SCatch system and how the semantic structure is used for similarity-based retrieval. In Section 6 we compare the results to existing projects and concepts. Section 6 presents an evaluation of the visual query language. Possible future developments and a summary can be found in Section 7.
2
Related Work
Since the middle of the 1990s the approach of applying Case-Based Reasoning (CBR) to design and architectural tasks has been known as Case-Based De-sign (CBD). The case-base contains information on buildings that have already been built or designed, enabling the computer to adapt solutions accordingly, on its own or with help from the architects. Two studies have been published by Heylighen in 2001 [2] and by Richter et al. in 2007 [3].
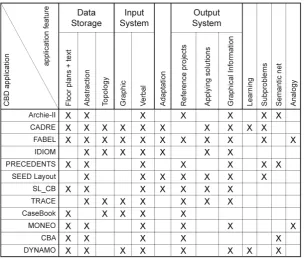
Table 1 gives an overview of CBD systems from the past 15 years of research activity in the field of Case-Based Design. The table concentrates on the de-velopment of different CBD applications with regards to the features supported by the software. The marked fields show whether the appropriate feature was realized in the application.
Table 1: Overview Case-Based Design systems
The PRECEDENTS[10] project can be seen as a counter example to these concepts. As the name already indicates, the architect is to be helped in finding reference projects. This approach is conceptually close to classical verbally driven architectural databases. However the graphic inputs of CaseBook [11] appear to be more suitable to formulating the retrieval query due to the visual way architects work.
the design process and leaves the reasoning process to the user. A semantic data representation can be found in CBA [15].
3
Methods
The use of metadata enhancing digital floor plans with additional information offers the opportunity to create smart objects that allow users to have easier access to the planning material. Enriching geometrical data with semantic in-formation allows the application and hence the user to identify rooms, doors or chairs. Today we are looking at semantic models to describe this data represen-tation. Examples of semantic models are BIM, IFC and the digital fingerprint. When transferring data from one format to another (interoperability), it is much easier to have smart objects than just lines or points.
When it comes to enhancing CAD models of buildings with semantic informa-tion, one of the major approaches in architecture is that of Building Information Modeling (BIM). Charles Eastman documented it in his books [16, 17], and Jerry Laiserin made it popular and declared it to be an industry standard [18]. Ac-cording to Eastman et al. [17], BIM is the process of generating and managing building information in an interoperable and reusable way. A BIM system is a system or a set of systems that enables users to integrate and reuse building information and domain knowledge throughout the life cycle of a building.
Furthermore, they emphasize that 3D knowledge-rich parametric modeling systems are central to BIM and in the life cycle of a building. As buildings are composed of geometric components, geometric information forms a substantial part of BIM. In addition, further domain knowledge is added to the BIM, such as project information, light analyses, or quantities and properties of building com-ponents and so forth. BIM is considered to have several stakeholders: architects, engineers, project managers and building-owners.
Modern architectural design is done using Computer Aided Design (CAD) software. Several vendors, such as Autodesk (Revit Architecture), Graphisoft (ArchiCAD) and Nemetschek (Allplan) offer software packages with their own data formats to store information about the building. However, according to BIM interoperability is important in reducing costs and supporting all stakeholders.
The International Alliance for Interoperability (IAI) [19] eestablished an open specification that is not controlled by a single vendor. The file format Industry Foundation Classes (IFC) is an interoperable BIM standard for CAD applica-tions.
Langenhan [1]’s proposed semantic structure, the digital fingerprint, is a spa-tial, functional, semantic structure and is used to formalize the structure of a floor plan. Langenhan introduces four main concepts to describe housing con-struction spaces and their relations, following the paradigm of incremental space:
1. Room- the most atomic structure in a formal representation,
3. Unit- groups zones and also has a functional meaning, such as ’apartment’ or ’terrace’,
4. Level- the current floor level of the building.
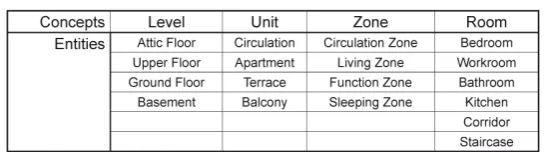
A building and its corresponding floor plan are separated into levels. Each level is divided into multiple units, which could be an apartment or a terrace, for instance. Units can be further divided into zones. Examples of zones are the ’living zone’ the ’sleeping zone’ and the ’function zone’. A zone groups together different rooms which are the most atomic part of the structure.
Today however, there is not always a strict division of the function that spaces can serve. A single physical space can therefore have several functions and be a combination of multiple functional spaces, such as a living room combined with a kitchen. Table 2 provides an overview of some structural entities.
But today there is not always a strict division of the function that spaces can serve. Thus a single physical space can have several functions and thus be a combination of multiple functional spaces, such as a living room combined with a kitchen. An overview of some structural entities is illustrated in Table 2.
Table 2: Taxonomy - Example of entities
After having introduced the different concepts, the connections between them need to be discussed. The instances of a concept with the same type can have either a direct, adjacent or no relation. If two spaces have a common wall and a door which links the spaces, this is defined as a connection. An adjacent relation is indicated by a shared wall without an alley.
A floor plan contains the level of a building, the root node always is a level node. The level will be hierarchically divided into units, zones and rooms via
part-of relations. The resulting structure could be represented as a tree, but as already discussed, structural concepts of a layer either have a direct, adjacent, or no connection. This means that there are three different types of vertexes. Section 4.3 will discuss the graph structure in more details.
4
The a.SCatch System
applications intuitively. Appropriate metaphors and devices must be used to allow fast and easy interaction.
Architects prefer to sketch in their initial design phase. A pen gives them more freedom than using a mouse with Computer Aided Design (CAD) software. Using the Touch&Write pen device to draw in a digital environment allows more immediate interaction, and the architects benefit from the digital representation of their drawings.
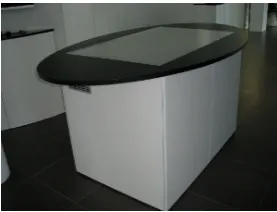
As the pen and touch paradigm is more intuitive for an architect to use, a prototype is being implemented for the Touch&Write table [20] developed at DFKI. The Touch&Write table, illustrated in Fig. 1, combines the paradigms of multi-touch input devices and a pen input device. The table is a novel rear-projection tabletop which detects touching by using frustrated total internal reflection (FTIR) proposed by Han [21] and a high resolution pen technology offered by Anoto Group AB.
Fig. 1: The Touch&Write table
The a.SCatch system offers user interfaces for:
– Manual editing of the automatic extraction results,
– Sketch-Based retrieval.
For Sketch-Based Retrieval, a visual query language was proposed by Lan-genhan [1]. This is an abstract representation of floor plans and will be described in Section 4.2. The results of the semantic retrieval are represented as graphical information and the touch interaction is a suitable way of interacting with this kind of information. The architect is able to interact with the graphical infor-mation using simple and intuitive gestures to zoom or navigate within the floor plan.
The aim of the a.SCatch project is to implement a system that takes advan-tage of the a.vista concept proposed by Langenhan [1] and the work environment of the Touch&Write table [20]. A semantic search is realized by sketching a con-cept of an architectural problem and triggering a search for similar projects from the past.
1. Semi-automatic extraction of the semantic structure from older floor plans, 2. Extraction of the semantic structure from the architect’s hand drawing, 3. Comparison of the sketch fingerprint’s graph structure with graph structures
in the floor plan repository,
4. Visualization of the results and the interaction with the user interface.
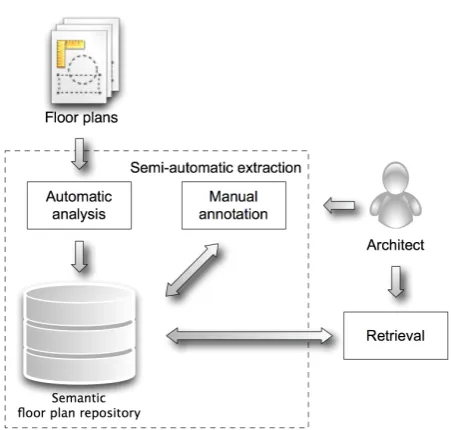
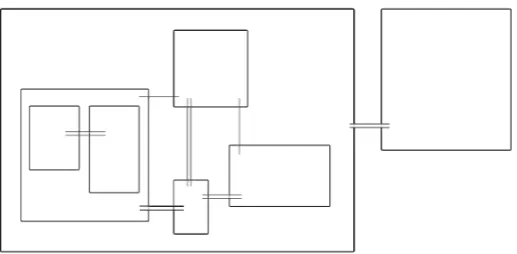
Fig. 2: Overview of the a.SCatch System
A schematic overview of the system is given in Fig. 2. Whenever the architect is searching the repository, he formalizes his query as a sketch, similar to the fundamental concepts of Spatial-Query-by-Sketch proposed by Egenhofer [22]. The architect sketches an initial floor plan with its associated rooms, zones and units. Afterwards the online data from the pen device is used to detect the geometrical shapes that represent concepts and lines which indicate the connection type. An example for such a visual query is illustrated in Fig. 3, which is a schematic way of drawing a floor plan. It describes an abstraction of geometrical relations and functional coherences. A verbal description of the different shapes is essential to get reasonable search results.
For the purposes of searching the repository and assessing the similarities between the graph extracted from the architect’s hand drawing and the graphs from the repository, a similarity measure must be calculated. In graph theory this can be interpreted as subgraph matching. Section 4.3 discusses the basic theory of the search problem.
in-Fig. 3: Example of an abstraction of a sketched query
formation. The architect is able to interact with the graphical information using simple and intuitive gestures to zoom or navigate within the floor plan. Further-more, visualization techniques such as Semantic Zooming4, could be applied to present more detailed information depending on the zoom level.
Further work will involve offering the architect the freedom to choose between the proposed visual query language or to let him sketch an initial floor plan with his own visual language and extract the semantic graph structure directly from this sketch.
4.1 Semi-Automatic Extraction from Existing Projects
In this context, semi-automatic extraction is defined as a process whereby the system tries to extract features automatically from a floor plan by using image understanding techniques [23–25] and apply machine learning methods that clas-sify the structural information. Another approach is to use standardized data formats, already containing meta information about the floor plan, such as the IFC standard5.
This semi-automatic extraction process is a seamless procedure which can be divided into four steps:
1. Vectorizing the pixel graphics,
2. Interpretation of vector information, such as lines and arcs, 3. Generating room and connection hypotheses,
4. Storing the digital fingerprint represented by a graph structure to enable searching and manual editing.
4
In semantic zooming, objects change appearance or shape as they change size. For example a growing dot will become a simple box, then a box with a one-word label, then a box with a longer label, then a rectangle filled with text and pictures. The goal is to give the most meaningful presentation at each size.http://www.infovis-wiki. net/index.php/Semantic_Zoom: Last accessed 04/02/2010
5 http://www.iai-tech.org/products/ifc_specification/ifc-releases/
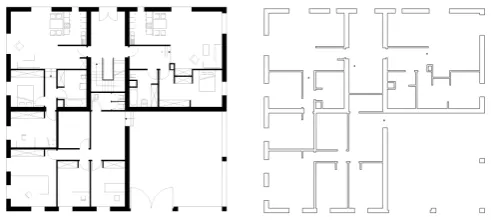
The extracted structure is presented to the architect who then approves or mod-ifies the results via a pen- and touch-enabled interface. With the support of semi-automatic extraction, an architect is able to formalize knowledge about past projects. This formalization process comprises two phases. The automatic analysis is the first part of the analysis and is mainly based on the techniques discussed in [23]. Currently the focus is on the detection of single rooms and their interconnections. Future work will involve classifying the type of the room by using symbol recognition [26] and optical character recognition (OCR) for each piece of textual information [27]. Furthermore a rule-based system could be applied in order to group rooms into zones and zones into units. The floor plan with its extracted semantics is stored in a repository and a user interface is provided to manually annotate the floor plan. The first results of the wall detection are illustrated in Fig. 4.
Fig. 4: Example of wall detection
4.2 Sketch-Based Retrieval
As we are dealing with visual information and an exclusively textual description of a floor plan is too fuzzy, we propose that a visual query language be used. Whenever the architect is searching the repository, he formalizes his query as a sketch, as in the fundamental concepts of Spatial-Query-by-Sketch proposed by Egenhofer [22]. Initially the architect sketches a floor plan with its associated rooms, zones and units. The corresponding online data from the pen device is used to detect the geometrical shapes representing concepts and lines, which indicate the connection type.
As discussed in Section 3 two different connection types have to be considered, because two entities are either adjacent to one another or directly connected. In the schematic view this is indicated by two parallel lines if the entities are directly connected, or one line if they are only adjacent to one another. Hence, no line between two entities indicates no connection or adjacent relation. By interpreting the sketch, a graph structure can be extracted for our query. For the shape detection we used the Vision Objects shape detection algorithm6. But as the shape detection is single stroke detection, we had to add a preprocessing step which combines single strokes following simple heuristics. To summarize the semantics of the visual query language:
– Rectangles representstructural entities,
– Enclosingimpliespart-of relation,
– Single linesindicate anadjacent connections,
– Two parallel lines indicate adirect connection.
4.3 Graph Structure
In this section we briefly discuss the theoretical foundation of the retrieval. The extracted semantics are represented as a graphG= (V, E). The vertexesV have a different type Tvertex which reflects a level, unit, zone or room. Each of these types has finite set of subtypes (cf. example of entities depicted in Table 2). As the types are hierarchically orderedTlevel> Tunit> Tzone> Troom, the resulting graph is limited in its ”‘vertical depth”’ to the maximum depth of four.
The vertexesEhave also different typesTvertexindicating if the vertexes are connected directly or are just adjacent, both of these relations are symmetric. The part of relation indicates which vertex adheres to a vertex of a superior typeTvertex, for instance a sleeping room which is part of a sleeping zone. As we are dealing with undirected and directed vertexes the graph is a mixed graph.
The types of the node and vertexes are assigned by labeling functions α : V →Tvertex andβ:E →Tvertex.
For the retrieval, the query graph G has be compared with the set of graphs from the database. In order to calculate the similarity of a query graph and a database graph the edit cost could be applied. In graph theory a similar problem is known asMaximum Common Subgraph-isomorphism (MCS)[28, 29], which is known to be NP-hard. Thus the number of matched vertexes is a potential measure of similarity.
Our current work focuses on researching standard approaches for solving the MCS problem and the subgraph isomorphism respectively. As the resulting graph structure has some limitations, such as the limited ‘vertical depth”’, and the structure among different floor plan graphs is similar, we are focusing on finding heuristics to overcome the intractable character of the problem.
6
5
Comparison with Existing Systems
First of all we must state that no significant breakthrough has occurred in Case-Based Design until now. The two studies published by Heylighen [2] and by Richter et al. [3] discovered that the acquisition bottleneck [31] of appropriate planning material had yet to be solved. We propose a semi-automatic extraction of the semantic structure to address this limitation shared by all CBD applica-tions, because the content of a database is actually the most important part for the user.
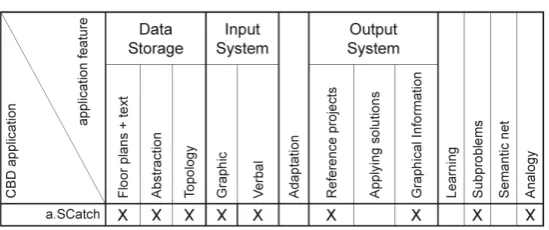
Table 3: a.SCatch features
However, we are not attempting to solve all the problems at once. The a.SCatch concept is simple and well defined, using architectural drawings as its starting point. ’Room’ ’zone’ ’unit’ and ’level’ are organized within a topology enriched with relationships and typologies.
Furthermore we create a fingerprint of the project which can be understood as the equivalent of keywords in today’s verbally driven search engines. It is the signature of the planning material and will allow the user to recover the appropriate project. By observing the work process of architects we are able to use experiential knowledge.
6
Experiments and Results
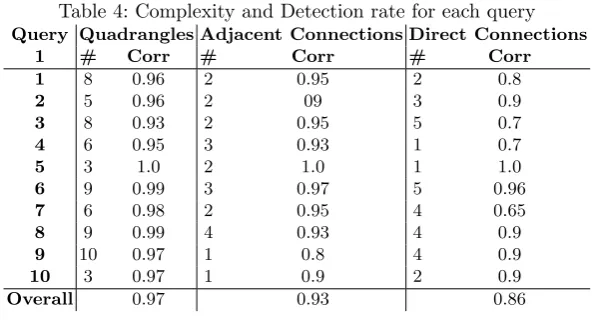
Sketch-based interactions are the essential part of the a.SCatch system. A possi-ble scenario of sketching a floor plan would involve using visual query language, thus the first experiments focus on interpretation of the visual language. As the a.SCatch system generates the query from the architect’s hand-drawing, we were able to evaluate the accuracy of the shape detection. We therefore defined ten example queries covering different complexity levels (see Table 4) and asked ten participants to copy each of these sketches, resulting in a total of 100 sketches.
The participants were male and female students aged between 23 and 29 years. All sketches were drawn on the Touch&Write table and the hand draw-ing was recorded. To assess the pure recognition performance, we did not give a direct feedback of the recognized shapes. In order to measure the accuracy of the detection algorithm we counted the correctly detected quadrangles and connections.
Table 4: Complexity and Detection rate for each query
Query Quadrangles Adjacent Connections Direct Connections
1 # Corr # Corr # Corr
1 8 0.96 2 0.95 2 0.8
2 5 0.96 2 09 3 0.9
3 8 0.93 2 0.95 5 0.7
4 6 0.95 3 0.93 1 0.7
5 3 1.0 2 1.0 1 1.0
6 9 0.99 3 0.97 5 0.96
7 6 0.98 2 0.95 4 0.65
8 9 0.99 4 0.93 4 0.9
9 10 0.97 1 0.8 4 0.9
10 3 0.97 1 0.9 2 0.9
Overall 0.97 0.93 0.86
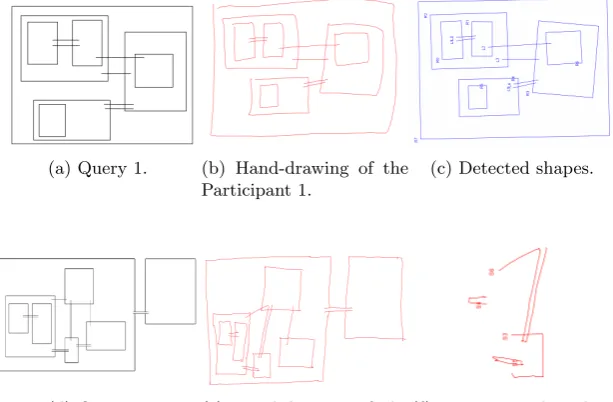
Figure 5a shows a template of Query 1 and Fig. 5b shows the recorded hand-drawing of Participant 1. The shapes detected by the Vision Objects shape detection algorithm are illustrated in Fig. 5c.
For the evaluation we distinguished between detection rates for quadrangles, adjacent and direct connections. Whenever a quadrangle is not detected it could cause a misinterpreted connection between quadrangles, which is also counted as a false detection. Table 4 shows detection rates for each query and Tab. 5 the detection rates for each participant.
(a) Query 1. (b) Hand-drawing of the Participant 1.
(c) Detected shapes.
(d) Query 3. (e) Hand-drawing of the participant 2.
(f) Unrecognized strokes.
Fig. 5: Visualization of the results.
The detection algorithm needs further improvement by using more sophis-ticated methods such as dynamic programming [30] to achieve results close to 100%. The final system will also be interactive, hence the user will be able to correct his input whenever the shape detection fails.
7
Conclusion and Future Work
In this paper, we presented a retrieval system for searching floor plans using a sketch-based interface. The first evaluation results show that shape detection already produces reasonable detection results, though there is still room for improvement. Dynamic programming approaches or a combination of online and offline detection will lead to results close to 100%.
Another focus is the automatic analysis of existing floor plans. Improvements in the automatic phase of the extractions should help when processing large amounts of data, as it should mean less effort in correcting the results. We used pattern recognition methods to solve the knowledge elicitation bottleneck [31] of existing CBD Systems.
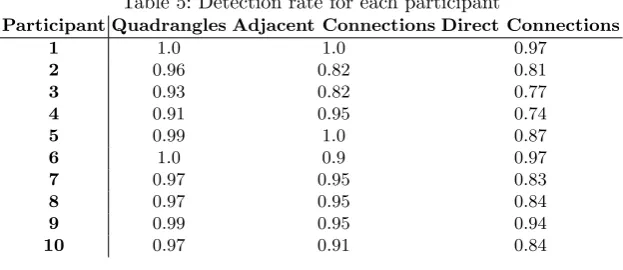
Table 5: Detection rate for each participant
Participant Quadrangles Adjacent Connections Direct Connections
1 1.0 1.0 0.97
2 0.96 0.82 0.81
3 0.93 0.82 0.77
4 0.91 0.95 0.74
5 0.99 1.0 0.87
6 1.0 0.9 0.97
7 0.97 0.95 0.83
8 0.97 0.95 0.84
9 0.99 0.95 0.94
10 0.97 0.91 0.84
Combining different technologies will balance the inabilities of each one. Tech-nologies such as semantic-based query or even picture-based query will help to upgrade the design process. It is the master key to allow architects access to the digital information society. They have not got there yet.
References
1. Langenhan, C.: a.vista Semantische Suche Web 3.0 f¨ur die Architektur. Bauhaus-Universit¨at Weimar (2008)
2. Heylighen, A., Neuckermans, H.: A case base of case-based design tools for archi-tecture. Computer-Aided Design33(14) (2001) 1111 – 1122
3. Richter, K., Heylighen, A., Donath, D.: Looking back to the future - an up-dated case base of case-based design tools for architecture. Knowledge Modelling - eCAADe (2007)
4. Hua, K., Faltings, B., Smith, I.: Cadre: case-based geometric design. Artificial Intelligence in Engineering10(1996) 171–183(13)
5. Voss, A.: Case design specialists in fabel. In: Issues and applications of case based reasoning in design. (1997) 301–335
6. Lottaz, C., Stalker, R., Smith, I.: Constraint solving and preference activation for interactive design. Artif. Intell. Eng. Des. Anal. Manuf.12(1) (1998) 13–27 7. Flemming, U.: Case-based design in the seed system. Automation in Construction
3(2-3) (1994) 123 – 133 Special Issue: Knowledge-based, Computer-aided Archi-tectural Design.
8. Lee, J., James, P., Garrett, H., Stephen, P., Lee, R.: Integrating housing design and case-based reasoning (2002)
9. Mubarak, K.: Case based reasoning for design composition in architecture. PhD thesis, School of Architecture. Carnegie Mellon University (2004)
10. Oxman, R., Oxman, R.: Precedents: memory structure in design case libraries. In: CAAD Futures ’93: Proceedings of the fifth international conference on Computer-aided architectural design futures, Amsterdam, The Netherlands, The Netherlands, North-Holland Publishing Co. (1993) 273–287
12. Heylighen, A., Neuckermans, H.: Dynamo: A dynamic architectural memory on-line. Educational Technology & Society3(2) (2000)
13. Taha, D.S.: Moneo, An Architectural Assistant System. PhD thesis, University of Alexandria, Egypt (2006)
14. Domeshek, E.A., Kolodner, J.L., Zimring, C.M.: The design of a tool kit for case-based design aids (1994)
15. Lin, Chieh-Yen, C., Mao-Lin: Smart semantic query of design information in a case library. digital design - research and practice. In: Proceedings of the 10th International Conference on Computer Aided Architectural Design Futures. (2003) 125–135
16. Eastman, C., Teichholz, P., R., S., K., L.: BIM Handbook: A Guide to Building In-formation Modeling for Owners, Managers, Designers, Engineers and Contractors. Wiley (2008)
17. Eastman, C.: Building product models: computer environments supporting design and construction. CRC (1999)
18. Ubiquity: Interview with Jerry Laiserin (2005) 19. Interoperability, I.A.F.: Building Smart (2010)
20. Liwicki, M., El-Neklawy, S., Dengel, A.: Touch & Write - A Multi-Touch Table with Pen-Input. In: Proceedings International Workshop on Document Analysis Systems. (2010) To appear.
21. Han, J.Y.: Low-cost multi-touch sensing through frustrated total internal reflec-tion. In: UIST ’05: Proceedings of the 18th annual ACM symposium on User interface software and technology, New York, NY, USA, ACM (2005) 115–118 22. Egenhofer, M.J.: Spatial-query-by-sketch. In: VL ’96: Proceedings of the 1996
IEEE Symposium on Visual Languages, Washington, DC, USA, IEEE Computer Society (1996) 60
23. Dosch, P., Tombre, K., Ah-Soon, C., Masini, G.: A complete system for the anal-ysis of architectural drawings. International Journal on Document Analanal-ysis and Recognition3(2) (2000) 102–116
24. Lu, T., Yang, H., Yang, R., Cai, S.: Automatic analysis and integration of archi-tectural drawings. International Journal of Document Analysis and Recognition (IJDAR)9(1) (2006) 31–47
25. Or, S.h., Wong, K.h., Yu, Y.k., Chang, M.M.y., Kong, H.: Highly Automatic Approach to Architectural Floorplan Image Understanding & Model Generation. Pattern Recognition (2005)
26. Tabbone, S., Wendling, L., Tombre, K.: Matching of graphical symbols in line-drawing images using angular signature information. International Journal on Document Analysis and Recognition6(2) (Oktober 2003) 115–125
27. Tombre, K., Tabbone, S., P´elissier, L., Lamiroy, B., Dosch, P.: Text/graphics separation revisited. Lecture Notes in Computer Science (2002) 200–211
28. Bunke, H.: On a relation between graph edit distance and maximum common subgraph. Pattern Recognition Letters18(8) (1997) 689 – 694
29. Garey, M.R., Johnson, D.S.: Computers and Intractability; A Guide to the Theory of NP-Completeness. W. H. Freeman & Co., New York, NY, USA (1990) 30. Feng, G., Sun, Z., Viard-Gaudin, C.: Hand-drawn electric circuit diagram
under-standing using 2D dynamic programming. Proceedings of the 11th International Conference on Frontiers in Handwriting Recognition, Qu´ebec (2008) 493–498 31. Watson, I., Farhi, M.: Case-based reasoning: A review. The Knowledge Engineering