Article
1
Performance of Resource Allocation in
2
Device-to-Device Communication Systems Based on
3
Evolutionally Optimization Algorithms
4
Tan-Hsu Tan 1, Bor-An Chen1 and Yung-Fa Huang2,*
5
1 National Taipei University of Technology; [email protected]
6
2 Chaoyang University of Technology; [email protected]
7
* Correspondence: [email protected]; Tel.: +886-4-2332-3000
8
9
Abstract: In this study, the resource blocks (RB) are allocated to user equipment (UE) according to
10
the evolutional algorithms for long term evolution (LTE) systems. Particle Swarm Optimization
11
(PSO) algorithm is one of the evolutionary algorithms, based on the imitation of a flock of birds
12
foraging behavior through learning and grouping the best experience. In previous work, the
13
Simple Particle Swarm Optimization (SPSO) algorithm was proposed for RB allocation to enhance
14
the throughput of Device-to-Device (D2D) communications and improve the system capacity
15
performance. In simulation results, with less population size of M=10, the SPSO can perform
16
quickly convergence to sub-optimal solution in the 100th generation and obtained sub-optimum
17
performance with more 2 UEs than the Rand method. Genetic algorithm (GA) is one of the
18
evolutionary algorithms, based on Darwinian models of natural selection and evolution. Therefore,
19
we further proposed a Refined PSO (RPSO) and a novel GA to enhance the throughput of UEs and
20
to improve the system capacity performance. Simulation results show that the proposed GA with
21
100 populations, in 200 generations can converge to suboptimal solutions. Therefore, with
22
comparing with the SPSO algorithm the proposed GA and RPSO can improve system capacity
23
performance with 1.8 and 0.4 UEs, respectively.
24
Keywords: device-to-device; LTE systems; resource allocation; particle swarm optimization
25
algorithm; genetic algorithm; system capacity
26
27
1. Introduction
28
Orthogonal frequency division multiple access (OFDMA) combines the orthogonal frequency
29
division multiplexing (OFDM) and frequency division multiple access (FDMA) technology, for
30
multiple access of multiple users with high data rate. The OFDMA scheme in the fourth generation
31
mobile communication system (4G) long term evolution (LTE) technology not only upgrades
32
spectrum efficiency but also provides high resistance for frequency-selective fading channels [1].
33
The Device-to-Device (D2D) is a developing key technique for next generation (5G) mobile
34
communication systems [2]. The D2D technique allows unauthorized users equipments (UEs) to
35
access unused authorized cellular UE band, thereby improving the utilization efficiency of
36
bandwidth resource.
37
The D2D can maximize communications services in adjacent areas due to transfer data without
38
going through the base station. For example, the regional transmission and Wi-Fi combined [3,4]
39
can provide more neighboring users multimedia services, or find a nearby friend, real-time
40
communications conversations, and product advertising. It also has the potential to be applied in
41
settings of emergency medicine [5] and disaster scene [6] where patients far outnumber healthcare
42
providers and the outreaching communication bandwidth is limited.
43
In this study, the resource blocks (RBs) are allocated to UEs according to the evolutional
44
algorithms for LTE systems. The advantages of D2D techniques are such as improving energy
45
efficiency of transmission, energy saving [7] and coverage rate improvement [6]. In the serious
46
interfering environments of communication systems, most of directly transmission UEs cannot
47
reach transmission rate requirement when the UEs is far from the base station. However, with relay
48
station for transmission, most UEs can reach the minimum requirements of transmission rate [10].
49
Therefore, the application of relay station for transmission in the serious interference environment,
50
the performance of system outperforms the directly transmission systems.
51
Particle Swarm Optimization (PSO) algorithm [8] is one of the evolutionary algorithms, based
52
on the imitation of a flock of birds foraging behavior through learning and grouping the best
53
experience. In previous works [8], a Simple Particle Swarm Optimization (SPSO) algorithm was
54
developed for resources allocation to achieve quality of service (QoS) and to maximize system
55
capacity. Therefore, in this paper, we further proposed a Refined PSO (RPSO) to enhance the
56
throughput of UEs and to improve the system capacity performance
57
The GA is a stochastic search algorithm whose procedures are based on the Darwinian models
58
of natural selection and evolution [9]. Given some arbitrary initial solutions, the GA will generate the
59
better solution through a series of genetic operations including selection, crossover, and mutation.
60
Furthermore, The GA searches the solution space in parallel, that is, a set of possible solutions are
61
manipulated in the same generation, so multiple local optimum can be reached simultaneously and
62
thereby the likelihood of finding the global optimum is increased. In previous works [10], we
63
proposed a novel redundancy-saving genetic algorithm (RSGA) based on the cost value of the
64
fitness function to improve the complexity in term the BER requirement for DS-CDMA systems.
65
However, it is not suitable for OFDMA systems. Therefore, in this study, we further proposed a
66
novel GA for the RB allocation for D2D systems.
67
2. System Models
68
In this paper the LTE communication systems based resources allocation issues are
69
investigated. The systems architecture is shown in Fig. 1. In this hybrid system, D2D UEs and
70
traditional Cellular users’ equipments (CeUEs) share all resources. In Figure 1, totally three relay
71
stations are deployed in the cellular system, where UEs are uniformly random distributed in relay
72
stations. In this study, base station is located in the center, and three relay stations form a triangle
73
around the base station. Each relay station signal coverage with radius of 200 m. The CeUEs are
74
uniformly random distributed in each relay stations within range. Each D2D pair includes a
75
receiver UE and a transmitter UE distributed with 80 m distance from relay station. Channel
76
models include Raleigh Fading, Shadowing Fading and path loss [11].
77
In Figure 1, each uplink data transfer includes two hops. In the first hop, the ul-th UE transmits
78
signal to the lth relay station by channel gain . The lth relay station relays the transmission to
79
base station using the nth resource block (RB). However, when the uj-th D2D UE transmits signal to
80
the lth relay station, it will occurs the interference link gain to the lth relay station.
81
In this study, the channel models include path loss and shadowing fading. Thus, the fading
82
channel model from UE to relay station (UE-relay) can be expressed by
83
(1)
84
where 103.8 is antenna gain; is shadowing fading with log-normal distributed random variable
85
where the standard deviation ; is Rayleigh fading effect, is the distance
86
between UE to relay station. Similarly, the fading channel model from relay station to BS (relay-BS)
87
can be expressed by [11]
88
=100.7+23.5 + +
(2)
訊號輸出
干擾輸出
D2D用戶設備
傳統用戶設備
中繼站
基地台
91
Figure 1. Systems architechure with deployment of three relay station.
92
93
It is assumed that Base Station (BS) has know well the Channel State Information (CSI) of all
94
channels. Then, the unit Power Signal-to-Interference-Plus-Noise Ratio (Unit Power SINR) of the
95
first hop can be expressed by
96
=
(3)
97
where is the channel gain from the ul-th UE to the lth relay with the nth RB. =1 or 0. Each
98
UE can only use one RB, indicates with one RB, however, = 0 indicates without any RB. Uj
99
is the set of D2D UEs in the jth relay area. and are transmission power of the ul-th UE
100
and the uj-th CeUE, respectively. is the interference link gain from the uj-th CeUE to the lth
101
relay. = . is power spectral density of the added white Gaussian noise (AWGN).
102
is bandwidth of an RB. Similarly, the unit power SINR of the second hop can be expressed by
103
=
(4)
104
where is the channel gain from the lth relay to the Base Station (eNB) with the nth RB.
105
and are transmission power of the l-th relay and the j-th relay, respectively. is the
106
interference link gain from the jth relay to the eNB with the nth RB.
107
In this study, there are two links in the second hop. Eq. (4) expresses the SINR of the lth relay
108
station to BS. Similarly, the SINR of the lth relay station to the receiver of D2D pair can be expressed
109
by
110
= (5)
111
In Eqs. (3)-(5), the SINR for all the links will be obtained. Then the throughput (Kbps) of the
112
first hop can be derived by
113
=
(6)
114
Similarly, the throughput of the second hop can be obtained by
115
Relay Station CeUE D2D UE Interference
= (7)
116
Thus, the throughput for the nth RB by the user ul can be obtained by
117
min{ , } (8)
118
With Eq. (8), the total throughput of N RBs is . All UEs are desired to
119
obtain the RBs to reach the maximal throughput. Therefore, to avoid deteriorating the
120
communication quality a threshold is set to meet the required throughput for most UEs. Some
121
constraints are set to perform the optimization problem as
122
123
where Eq. (9a) set the constraints for that each UE use only one RB. Eq. (9b) and (9c) are the
124
constraints on the minimum power for UEs and relay stations, respectively. Eq. (9d) is the
125
minimum throughput requirements of QoS for UEs.
126
Moreover, the interference of the first hop and the second hop for system is expressed by
127
(10)
128
and
129
(11)
130
, respectively.
131
In the system model, it is assumed that the base station coverage area is a circle with the radius
132
175 m. In this area, there are three relay station uniformly deployed with a traiangle as shown in
133
Figure 1. The coverage area of each relay station is a circle with radius 100 m. The celllular UEs are
134
uniformly random distributed around the relay station. D2D pairs are deployed on a circle with
135
radius 80 m around each relay station as shown in Figure 2. The numbers of UEs in the relay station
136
are the same. It is assumed that the CSI of the links are known to base station. The simulation
137
parameters are listed in Table 1.
138
r = 80 m
139
Figure 2. D2D pairs deployed on the circle around the relay station.
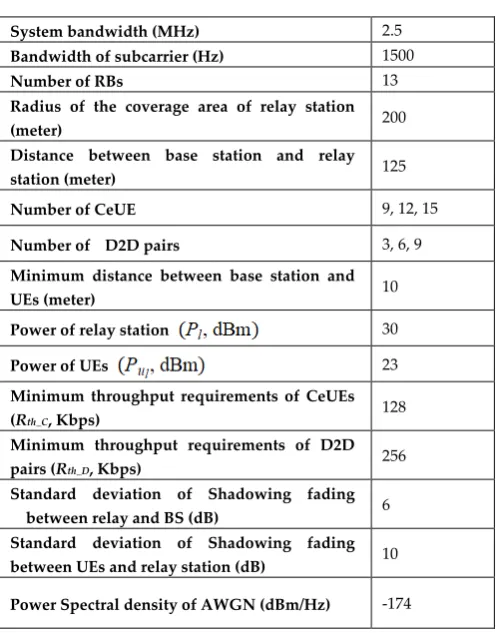
Table 1. System simulation parameters.
141
System bandwidth (MHz) 2.5
Bandwidth of subcarrier (Hz) 1500
Number of RBs 13
Radius of the coverage area of relay station
(meter) 200
Distance between base station and relay
station (meter) 125
Number of CeUE 9, 12, 15
Number of D2D pairs 3, 6, 9
Minimum distance between base station and
UEs (meter) 10
Power of relay station 30
Power of UEs 23
Minimum throughput requirements of CeUEs
(Rth_C, Kbps) 128
Minimum throughput requirements of D2D
pairs (Rth_D, Kbps) 256
Standard deviation of Shadowing fading
between relay and BS (dB) 6
Standard deviation of Shadowing fading between UEs and relay station (dB) 10
Power Spectral density of AWGN (dBm/Hz) -174
142
3. PSO based Resource Allocation
143
PSO algorithms are used to simulate the bird swarm foraging situation, which is in the search
144
for food space with particles. Each particle simulates a bird, in addition to its own normal
145
movement, also refer to its own best moving experience. The personal best experience is denoted by
146
spbest. Then the global experience is referred from the group's best moving experience with global
147
best, denoted by sgbest. According to the above kinds of data with an iterative evolution, the final
148
convergence obtains the optimal solution.
149
In this study, the number of particles is M, and the value of the particle's target function is the
150
pointer to the efficiency of the iteration. The particle with the highest target function value is the
151
best solution. A simplified formula for particle swarm optimization, called SPSO, is proposed to
152
improve the performance of the resource allocation for D2D communication systems. The SPSO
153
algorithm performs the optimization of resource block allocation, and all the relay stations cover the
154
UEs of the allocated RB as the particle si. The particle is uniformly distributed in the solution space.
155
Total 13 RBs and 3 relay stations are available. The moving velocity of the first particle in the
156
(g+1)-generation is expressed by
157
= (12)
158
where is the position vector of the ith particle in g-generation, , and is
159
the position of the ith particle of the lth relay station. The local optimal positions of all particles are
160
denoted by , where is the local optimal position of the lth
161
relay station. is the global optimal positions of all particles in the nearest generation. both
162
and are the acceleration coefficients, called by individual factor and social factor, respectively.
163
Generally, the factors are set by and . The is the random function with uniformly
164
distributed in [0,1].
165
Moreover, the position updating at (g+1)-generation can be expressed by
(13)
167
In SPSO, all the K UEs distributed in the coverage area of relay station are allocated RBs and
168
composited as a particle si with an array of 1×K. The M particles are uniformly distributed in the
169
solution space, and a total of 13 RBs are available to be allocated to the UEs in three relay stations.
170
In SPSO the object function is defined by
171
∑
=
=
Ku u C
l l
y
f
1
(14)
172
where is the system capacity and is defined by
173
(15)
174
The procedure of SPSO algorithms applied in this study can be described by the following
175
example with K=18 and M=3:
176
1) Initialization (g=1): Generate the positions of M particles, 1
i
s
, i =1, ..., M and velocity, , i=1,177
..., M. One example of the position of a particle 1
i
s
can expressed by = [1 1 3 4 5 6│ 2 8178
3 11 11 13│1 6 7 8 4 9 ] .
179
2) Calculate the objective function value of all particles according to Eq. (8) and find the and
180
for this generation. One example of and can be = [1 1 3 4 5 6];
181
= [7 8 9 10 11 12]; = [1 3 4 5 7 6] and = [3 4 5 6 7 5│ 7 8 9 10 11 12│1 3 4 5 7 6 ],
182
respectively.
183
3) Let g=g+1. According to step (2), we calculate the speed and position of the next generation (g+1)
184
particle, after one generation calculation. Then one example of the position can be = [2 3 1 4
185
5 6│ 9 7 6 11 13 10│1 6 7 8 4 9 ].
186
If the number of generations g < G, return to step (2) to update the individual optimal solution
187
and the population optimal solution. One example can be as: the previous is unchanged
188
by = [1 1 3 4 5 6]. But the other two individual optimal solutions is updated by = [9
189
7 6 11 13 10] and = [2 7 8 9 3 5],respectively. Moreover, the new is updated
190
according the object function by = [2 3 1 4 5 6│ 9 7 6 11 13 10│1 6 7 8 4 9 ].
191
4) If the number of generation is g = G, the calculation is ended.
192
Then after N(N G) generations, one of the positions is selected by =[8 4 5 7 3 2│
193
7 8 9 10 11 12│1 5 4 9 6 7 ]. The global optimal solution is obtained by = [2 3 1 4 5 6│ 9
194
7 6 11 13 10│1 6 7 8 4 9 ]. Hence, in this PSO calculation, the solution is = [2 3 1 4 5 6│ 9 7 6 11
195
13 10│1 6 7 8 4 9 ].
196
To upgrade effectiveness of SPSO, this research according to system schema of relay station
197
partition characteristics on SPSO for optimization, in (12), the learning factor with weight parameter
198
cw1 and cw2, to speedup optimization searching. This PSO is called Refined PSO (RPSO). Then, its
199
next generation of evolution speed of particle can be obtained by
200
) (
() )
(
() 2 2
1 1
1 g
i gbest g
i pbest g
i c cw rand s s c cw rand s s
v + = ⋅ ⋅ × − + ⋅ ⋅ × − (16)
201
where cw1 and cw2 are 1 K vector, where K is the number of UE, both on behalf of weights for
202
adjusting the searching efficiency of particles.
203
The modifying rule of is the followings:
204
1) 1 for that the RB of the ul-th UE in does not conflict with the RBs of other relay
205
stations.
2) 0 for that the RB of the ul-th UE in conflicts with the RBs of other relay
207
stations once.
208
3) 3 for that the RB of the ul-th UE in conflicts with the RBs of other relay stations
209
once more.
210
The modifying rule of is the followings:
211
1) 1 for that the RB of the ul-th UE in does not conflict with the RBs of UEs of other
212
relay stations. 1 for g>10.
213
2) 3 for that the RB of the ul-th UE in conflicts with the RBs of other relay stations
214
once or more in g≤10.
215
4. RB Allocation with GA Discussion
216
In genetic algorithms (GAs) [12,13], the main idea is to follow the fittest evolutionary laws of
217
nature, by the procedures of selection, crossover and mutation to improve the fitness value of
218
chromosomes. With GA, there are random search, and other ways to search for the optimal solution.
219
Therefore, the GA is often used to apply on optimization issues. In this study, the GA is applied for
220
resources allocation optimization, with the objective functions on maximal system capacity and
221
throughput.
222
The procedures in GA are the followings: (1) data coding, (2) producing initial population, (3)
223
calculation fitness values, (4) selection, (5) crossover, and (6) mutation. The procedures are
224
proceeded iterated from (3) to (6), until meeting the terminated conditions. Then the solution are
225
obtained as the optimal results.
226
In the parent group, it is in accordance with the fitness value of chromosomes, to determine
227
whether it will be retained or eliminated. In the select operation in this study, the ranking method,
228
ranks the fitness value of each chromosome. This method can avoid inbreeding [10].
229
The crossover of GA is by selecting two chromosomes from the mating pool, and swapping the
230
genes into two new chromosomes. It is expected that crossover procedures can generate better
231
offspring chromosomes. Higher crossover rate in GA will bring the higher evolutional rate for the
232
chromosomes.
233
The mutation can increase the ethnic diversity of GA operations. The aforementioned selection,
234
crossover and other procedures in both groups search for better children, but its genetic
235
characteristics must be associated with the parent. Because there are no new chromosomes joining
236
the group in each generation, it makes that the searching area cannot be expanded. It will lead the
237
evolution to converge earlier. However, through mutation, some new chromosomes will join the
238
search space to avoid GA early convergence problems.
239
In GA the object function is defined by
240
∑
==
Ku u C
l l
y
f
1
(17)
241
where is the system capacity and is defined by
242
(18)
243
5. Simulation Results
244
5.1. PSO
245
The simulation parameters based on SPSO and RPSO are shown in Table 2. In Figure 3,
246
simulation results show that when the total number of UEs are K = 12, system capacity reaches 12
247
UEs. However, when K = 18, the system capacity reaches 16.5 UEs. Moreover, when K = 24, system
248
capacity is 18.3 UEs.
Figure 4 shows the comparisons between the proposed SPSO with and
250
random allocation methods. The random method (Rand) is performed by random allocated the RBs
251
to the UEs in each generation. But the system retains the best results to the next generation based on
252
the same object function as SPSO. From Figure 4, it is easy to observe that the proposed SPSO
253
outperform the Rand at the 20th iterations and highly improve the system capacity to 16 UEs at the
254
100th iterations, which is 2 UEs more than that of Rand.
255
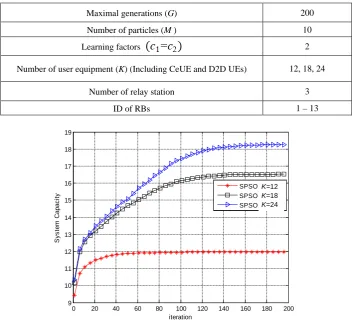
Table 2. Simulation parameters of PSO.
256
Maximal generations (G) 200
Number of particles (M ) 10
Learning factors 2
Number of user equipment (K) (Including CeUE and D2D UEs) 12, 18, 24
Number of relay station 3
ID of RBs 1 – 13
0 20 40 60 80 100 120 140 160 180 200
9 10 11 12 13 14 15 16 17 18 19
iteration
S
y
s
tem
C
apac
it
y
SPSO UE = 12 SPSO UE = 18 SPSO UE = 24
257
Figure 3. Simulation results of SPSO method with M=10.
258
0 20 40 60 80 100 120 140 160 180 200
7 8 9 10 11 12 13 14 15 16 17
Iteration
S
y
s
tem
C
apac
it
y
Rand SPSO
259
Figure 4. Simulation results comparisons between SPSO and random allocation method with M=10, K=18.
260
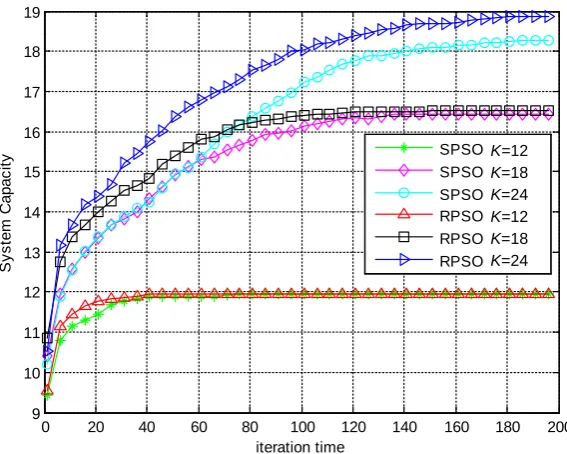
Figure 5 displayed the comparisons between RPSO and SPSO. In Figure 5, it is shown that
261
RPSO speed up more than SPSO algorithm to converge the optimal for K = 12. Moreover, for K = 18
262
and K = 24, system capacity of RPSO outperforms SPSO.
263
Table 3 shows the performance comparisons of SPSO, RPSO and random allocation (Rand) for
264
K=12, 18, 24, with M=10, and c1=c2 = 2. Compared with the Rand, SPSO algorithm can improve the
265
efficiency of about 17-20%, for K =18, 24. Moreover, the proposed RPSO algorithm can improve the
266
efficiency of 18-24% than Rand.
267
0 20 40 60 80 100 120 140 160 180 200 9
10 11 12 13 14 15 16 17 18 19
iteration time
S
y
s
tem
C
apac
it
y SPSO 12UE
SPSO 18UE SPSO 24UE RPSO 12UE RPSO 18UE RPSO 24UE
268
Figure 5. The comparisons of convergence between RPSO and SPSO.
269
Table 3. The comparisons between RPSO, SPSO and Rand.
270
271
Number of UE
(K)
12 18 24
a. RPSO 12 16.66 18.89
b. SPSO 12 16.52 18.3
c. Rand 11.8 14.1 15.2
1
Gain
(a-c) / c
1.69% 18.16% 24.28%
2
Gain
(b-c) / c
1.69% 17.16% 20.39%
272
5.2. GA
273
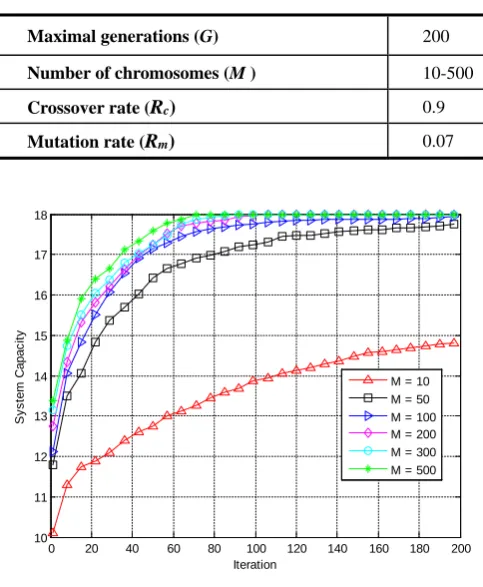
The simulation parameters based on GA are shown in Table 4. Figure 6 shows that the system
274
capacity for different population size in GA with K = 18. The objective function is in Eq.
275
(12). When M = 10, the system capacity performance can reach 15 UEs. However, when M 100,
276
the system capacity reaches saturated with near optimal solution with 18 UEs. From Figure 6, it is
277
observed that the large population size can reach the optimal solution.
278
Table 5 shows the performance comparisons of RPSO, GA and Rand methods with M=100 and
279
G=200. From the results in Table 5, it is observed that the when M=100, the proposed GA
280
outperform RPSO with 1.4 UEs of system capacity for K=24.
281
Table 4. Simulation parameters in GA.
282
Maximal generations (G) 200
Number of chromosomes (M ) 10-500
Crossover rate (Rc) 0.9
Mutation rate (Rm) 0.07
0 20 40 60 80 100 120 140 160 180 200
10 11 12 13 14 15 16 17 18
Iteration
S
y
s
tem
C
apac
it
y
M = 10 M = 50 M = 100 M = 200 M = 300 M = 500
283
Figure 6. System capacity for various population size with K = 18.
284
Table 5. System capacity comparisons of RPSO, GA and Rand methods with M=100 and G=200.
285
K 12 18 24
GA 12 17.96 21.8
RPSO 12 17.86 20.41
Rand 12 15.08 16.27
286
5.3. QoS Based Capacity Maximization
287
In this section, the Quality of Service (QoS) based system capacity maximization are
288
investigated. The QoS based multi-object function can be written as
289
R
C f
f
fα =α⋅ +(1−α) (19)
290
where is the weighting factor for balance between capacity and throughput and the object
291
function for system throughput is defined by
∑
=
=
Nn
n u n u R
x
lR
lf
1) ( )
( (20)
293
where =1 or 0. Each UE can only use one RB, indicates with one RB. And (n)
ul
R
is the294
throughput for the nth RB used by the user ul.
295
Figure 7 shows the simulated results with different weight values for UE=18, which
296
respectively represent the transmission capacity and system capacity of each UE. In Figure 7(a),
297
during the period of about the first 10 generations of this period, regardless of the numerical value,
298
the rate of increase of the average throughput is similar, indicating that the weight value has little
299
effect. But after the number of generations exceeds 10 generations, the weighting starts to take
300
effect. The smaller the weight value, the larger the amount of transmission. Figure 7(b) shows that
301
after more than 10 generations, the larger the weight, the larger the system capacity. This result
302
indicates that there is a conflict between maximizing the system capacity and the individual
303
throughput of UEs.
304
0 20 40 60 80 100 120 140 160 180 200 800
900 1000 1100 1200 1300 1400
Iteration
av
er
age t
hr
oughput
of
eac
h U
E
(k
bps
)
α = 0.2
α = 0.3
α = 0.4
α = 0.5
α = 0.6
α = 0.7
α = 0.8
305
(a)
306
0 20 40 60 80 100 120 140 160 180 200 10
11 12 13 14 15 16 17
Iteration
S
y
s
tem
C
apac
it
y
α = 0.2
α = 0.3
α = 0.4
α = 0.5
α = 0.6
α = 0.7
α = 0.8
307
(b)
308
Figure 7. System performance comparisons in 200 generations for (a) throughput (b) system
309
capacity with K = 18.
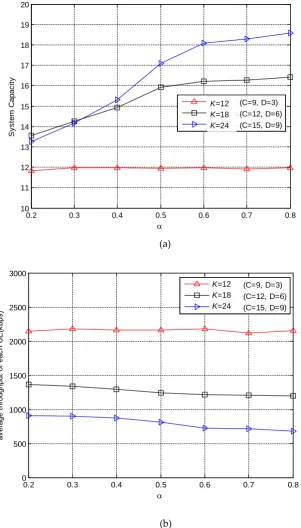
Figure 8 shows the comparison between the system capacity and the throughput obtained for K = 12, 18,
311
24. In Figure 8(a), the more UEs are found, the greater the difference in performance, indicating that the
312
transmission capacity and system capacity are increasing. After the complex situation is raised to a certain
313
value, the mutual influence is greater, and the difference is the largest at 0.5-0.6.
314
In this study, the system capacity is taken as the higher priority requirement, and then the weighting is set
315
to 0.6 according to Fig. 8. Under this weighting parameter, the system capacity when K = 18 can reach close to
316
16 UEs. Moreover, Figure 8(b) shows the comparison of the throughput of each UE under the condition of
317
α=0.2-0.8. When α=0.6 and K = 18, the throughput can still reach 1300 Kbps, and the system capacity can
318
reach 16 UEs. Therefore, with the proposed multi-objective function, not only the throughput can be approved
319
transmission, but also system capacity can be guaranteed.
320
0.2 0.3 0.4 0.5 0.6 0.7 0.8 10
11 12 13 14 15 16 17 18 19 20
α
S
y
s
tem
C
apac
it
y
UE = 12 (C=9, D=3) UE = 18 (C=12, D=6) UE = 24 (C=15, D=9)
321
(a)
322
0.2 0.3 0.4 0.5 0.6 0.7 0.8 0
500 1000 1500 2000 2500 3000
α
av
er
age t
hr
oughput
of
eac
h U
E
(k
bps
)
UE = 12 (C=9, D=3) UE = 18 (C=12, D=6) UE = 24 (C=15, D=9)
323
(b)
324
Figure 8. The comparisons of (a)system capacity and (b) throughput for different weighting α.
325
K=12 K=18 K=24
6. Conclusions
326
In this paper, the PSO algorithm is proposed to optimize resource allocation in D2D system.
327
Simulation results show that resource allocation optimization is performed using proposed RPSO
328
can significantly improve the system capacity performance. In this paper, the GA is proposed to
329
optimize resource allocation in D2D systems. Simulation results show that the proposed GA can
330
improve the system capacity performance. With population size M=100 and generations g=200, the
331
proposed GA can outperform the proposed SPSO 1.8 users for system capacity.
332
Acknowledgments:This work was funded in part by Ministry of Science and Technology of Taiwan under Grant MOST
333
106-2221-E-324-020.
334
Author Contributions: Tan-Hsu Tan and Yung-Fa Huang conceived and designed the experiments; Bor-An
335
Chen performed the experiments; Tan-Hsu Tan and Yung-Fa Huang analyzed the data; Tan-Hsu Tan
336
contributed analysis tools; Yung-Fa Huang wrote the paper.
337
Conflicts of Interest: The founding sponsors had no role in the design of the study; in the collection, analyses,
338
or interpretation of data; in the writing of the manuscript, and in the decision to publish the results.
339
References
340
1. Yun, L.; Le, Z.; Xin, T.; Bin, C. An advanced spectrum allocation algorithm for the across-cell D2D
341
communication in LTE network with higher throughput. China Commun.2016, 13, 30-37.
342
2. Camps-Mur, D.; Garcia-Saavedra, A.; Serrano, P. Device-to-device communications with Wi-Fi direct:
343
overview and experimentation. IEEE Wireless Commun.2013, 20, 96-104.
344
3. 3GPP- The Mobile Broadband Standard (Rel. 14). http://www.3gpp.org/(accessed on 30 March 2018).
345
4. Hara, S.; Prasad, R. Multicarrier Techniques for 4G Mobile Communications. Artech House Boston London,
346
2003.
347
5. Hasan, M.; Hossain, E. Resource Allocation for Network-Integrated Device-to-Device Communications
348
Using Smart Relays. In Proceedings of IEEE Globecom Workshops. Dec. 2013, 591–596,
349
6. Babun, L. Extended Coverage for Public Safety and Critical Communications Using Multi-hop and D2D
350
Communications,” Master thesis, Department of Electrical Engineering, Florida International University,
351
Mar. 2015.
352
7. L. Wang, T. Peng, Y. Yang, and W. Wang, “Interference Constrained D2D Communication with Relay
353
Underlaying Cellular Networks,” In Proceedings of IEEE Vehicular Technology Conference, pp. 1-5, Sept.
354
2013.
355
8. Huang, Y.-F.; Tan, T.-H.; Chen, B.-A.; Liu, S.-H.; Chen, Y.-F. Performance of Resource Allocation in
356
Device-to-Device Communication Systems Based on Particle Swarm Optimization. In Proceedings of
357
2017 IEEE International Conference on Systems, Man, and Cybernetics (SMC2017), Banff, Canada, October
358
5-8, 2017.
359
9. Goldberg, D. E. Genetic Algorithm in Search, Optimization, and Machine Learning, Addison-Wesley, 1989.
360
10. Tan, T.-H.: Huang, Y.-F.; Liu, F.-T. Multi-user detection in DS-CDMA systems using a genetic algorithm
361
with redundancy saving strategy. International Journal of Innovative Computing, Information and Control
362
(IJICIC), 2010, 6, 3347-3364.
363
11. Hasan, M.; Hossain, E. Distributed resource allocation for relay-aided device-to-device communication: a
364
message passing approach. IEEE Trans. Wireless Commun.2014, 13, 6326-6341.
365
12. Chen, S.-H.; Chen, M.-C. Operators of the Two-Part Encoding Genetic Algorithm in Solving the Multiple
366
Traveling Salesmen Problem, In Proceeding of International Conference on Technologies and Applications
367
of Artificial Intelligence, pp. 331-336, Nov. 2011.
368
13. Tang, K.S.; Man, K. F.; Kwong, S.; He, Q. Genetic algorithms and their applications. IEEE Signal Processing
369
Magazine, 1996, 22-37.