The Cloud-to-Ground Lightning Parameterization Development with the Canadian Local Climate Model
Abderrazak Arif
National Institute of Meteorology, B.P. 156, 2035 Tunis-Carthage, Tunis, Tunisia. [email protected], [email protected] (Corresponding author)
Tel: +216 24 54 33 55
Fax: +216 71 772609
Abstract
We use the third version of the Canadian Local Climate Model as a diagnostic tool to study the climatology of observed CG lightning activity at Maniwaki (latitude: 46,23°N; Longitude: 75,58°W). We examine the dependence between the hourly lightning activity and the related atmospheric variables during the warm season of sixteen years (between 1988 and 2004). The goal of this research is: a) to evaluate the atmospheric static state evolution and its moisture contents for conditions having generated lightning occurrence, b) to develop a CG lightning parameterization, and c) to verify this CG lightning parameterization on other Canadian areas. The freezing level altitude and the precipitable water content are used to estimate the static air instability and its moisture content respectively. These two parameters are served to develop the CG lightning parameterization. A comparison between the observations and simulations CG lightning occurrence and frequency at Maniwaki showed a mean absolute error rate of 27% and 55% respectively. We apply this parameterization at four Canadian regions, distributed from west to east. The simulated CG lightning results are comparable to observed CG lightning at Maniwaki and tested regions. The application of the CG lightning parameterization to the daily data enabled us to find the monthly results. This application represents a preliminary stage for validation this parameterization in regional numerical models in Canada during the historic period.
1 Introduction
In Canada, the boreal forest is threatened by both natural and anthropogenic disturbances.
Natural disturbances are dominated by: insects, forest fires and air pollution, for example acid
rains [62,23,33,38]. The vast majority of forest fires are caused by lightning [41,6]. Human
forest fires causes presents an anthropogenic threats in the boreal regions. Thus, forest fires
remain the most important threat in term of area size and volume. However, fires forests
devastate the maximum of the forest surface and affect the Canadian economy. The forest fires
affect also the climate and are responsible for a significant quantity of greenhouse gases.
According to statistics obtained between 1988 and 1998 [13], 8 823 fires devastated 3.2 million
hectares, or 0.73% of the Canadian forest territory per year. Lightning causes 42% of all forest
fires and accounts for 85% of the annually burnt surfaces destroying an average of 2.8 million
hectares of forests. Human action burns only 15% of the total surfaces cause 58% of all fires.
Anthropogenic threats are industrial harvesting [73], pollution [20,38], man-made forest fire
[22], and climate changes [4,72,5,46].
In the boreal region, forest fires remain the most important threat in term of area size and
volume. Forest fire dynamics is very complex since it combines synergistically the natural and
anthropogenic disturbances. Lightning frequency causing forest fires modify the climate
through the changes of carbon concentration and other greenhouse gases in the atmosphere
[64,14], hydrologic alterations [21] or aerosols emissions by the smoke emission during forest
fires [66,60,61]. From these facts, it becomes important to study the behavior of lightning using
systemic approaches. Numerical modeling provides us an appropriate theoretical framework to
The study of lightning and its distribution at regional and global scale under climate change
relevant to many fields as forestry, security and atmospheric sciences
[69,27,7,28,25,36,50,59,78,58]. There have been several studies correlating annual lightning
density (impacts km-2 year-1) to number of days with lightning. In one of these studies appear
them of Mackerras [29], Anderson and Erikson [1], and Soriano et al. [50] concerning Australia,
South Africa and Spain respectively.
Other studies are correlated the lightning frequency with the atmospheric parameters. In one of
these studies, Williams [76] showed the proportionality between the electric intensity and the
fifth power of the cloudy column height. He developed an empirical equation between the total
lightning frequency and the convective cloud height, on basis of the theoretical electric
equations, lightning occurrence and standard aerological data.
Price and Rind [68] used the Williams’s lightning parameterization applicable in continental
regions, to develop a lightning parameterization in maritime regions. They use this lightning
parameterization with the global climate model (GCM/GISS) from Goddard Institute for Space
Studies to calculate the total lightning frequency (intra-cloud and cloud-ground) at global scale.
Granström [17] showed in a study carried out in Sweden that lightning frequency is related to
precipitation during the summer season. Other researchers found a strong correlation between
lightning frequency and physical parameters of storm systems. Williams and Renno [77] found
a correlation between lightning occurrence and Convective Available Potential Energy (CAPE)
at occidental pacific tropical regions with 300 km radius around during January 1993 to
February 1994.
Hauf [24] showed a decrease in lightning frequency from the Southwest to the Northeast in
Southern part of Germany during 5 years (1992-1996) where the spatial and temporal lightning
et al. [74], examine the combustible, the climate and the topography influences with forest fires
caused by lightning at British-Colombia and Alberta, showed a significant difference of
lightning frequency and forest fires caused by lightning at East and West of these regions.
Soriano et al. [49] analyzed the relationship between flash density and the number of
thunderstorm days. They used a statistical method between cloud-to-ground flash densities,
dew-point temperature at 850hPa and temperature difference between 850hPa and 700hPa to
estimate the lightning capacity and density. Also, Zhou et al. [79] found a correlation between
precipitation and the CG lightning frequency. This study is related to 16 stations in China for
July 27 and 30, 1997 and for the precipitation period between 14:00h and 20:00h.
Other lightning studies aimed at the investigation of electrical phenomena and atmospheric
conditions associated to lightning generation [35,47,48,67]. For example, Solomon et al. [49]
studies the microphysics and electric proprieties linked to convective cells during three days
(3-5 August 2002) at North of Italy, using a thunderstorm model of Washington University
(UWTM, University of Washington 1.5dim thunderstorm model).
They found a strong correlation between the microphysics proprieties and cloud dynamics.
Their preliminary results shown that the electric charges quantity, produced during this
experience, depends to temperature, liquid water quantity and their particle sizes. They
mentioned that the CG lightning do not formed necessary in depth convection or thunderstorm.
The presence of an important ice crystals concentration in the convective clouds is a necessary
condition to the presence of the lightning where they showed proportionality between them.
Presently, they have not a regional CG lightning parameterization developed with climatic
parameters. In this study, we will focus on the climatic parameters to analyze and evaluate the
lightning occurrence and frequency adapted to regional and global climate models and in
at the Maniwaki station near Ottawa and Montreal, in Canada. We will examine with precision
the aerological data in relation with corresponding lightning occurrence and frequency during
the warm seasons of 1988 to 2004. However, since lightning occurrences for 1991 are missing,
this year is not included in our study. The CG lightning frequency indicates here the
instantaneous number of the lightning for one hour, one day or one month. The CG lightning
occurrence represents the number of hours for one day or one month whatever its frequency.
We demonstrate the robustness of this relationship and we will need to verify our
parameterization in Canada using four regions. Our result is limited to CG lightning type since
it presents the natural causes to forest fire ignition.
2 Method
As mentioned bellow, several studies showed a relationship between CG lightning frequency
and the geographical location, orographic and climatic parameters [24,53,50,79]. This lightning
regional dependence of parameterization prediction is not based on basic physical principles
but on global statistics of thermodynamic variables responsible to the depth convection
development. In physical climatology, atmospheric variables are more basic element for the
lightning occurrence. The use of a physical approach with the statistic means remains an
effective method to the CG lightning parameterization development.
The combination of several effects like the topography [55,56,50] and the presence of the urban
zone [56] reinforce the storm development could produce the CG lightning occurrence. The
regional conditions cannot be excluded as for their impacts on the thunderstorm formation, but
the atmospheric and climatic prognostic variables (temperature, moisture, pressure and wind)
are most fundamental and the most robust predictors to determine the convective and violent
lightning occurrence. Mainly, we could combine all relevant parameters but in detriment of the
analysis and the complexity increase risks, of interpretation and to introduce a certain
redundancy since the other predictive are taken from the model variables. For this study, we
identified and selected two climatic variables linked to the CG lightning occurrence: the
temperature and the moisture content. Insofar where all other model variables rise from these
fundamental variables, they are implicitly associated. Also, the constraints effect like
topography and the heat urban fluxes will be implicitly taken charges through their effects on
the temperature and humidity.
One of the CG lightning parameterization applications is to know the relationship between the
forest fire occurrences and the climate change scenarios. Since the CG lightning is a dominant
factor to forest fire ignition, its frequency tendency influencing strongly the smog emission and
the aerosol concentrations. The forest fire smog increases the condensation nucleus
concentration in clouds [65,12,40] and change the cloud albedo and precipitation comportment
[66,39]. Using the forest fire indexes [3] and the explicit treatment of aerosols in NARCM
[18,19], the CG lightning parameterization will be allow as to investigate the aerosol effects in
the climate. Also, with combining the CG lightning parameterization in NARCM [52], this
strategy will be allow as to establish an interactive link with the smog emission and the
retroaction with the atmospheric circulation and the climate from perturbation on simulated
climate.
3. Data
The local climate model (LCM) used in this study [54] is a column version of the regional
climate model [9,10,32] and the global climate model [31]. The LCM is controlled by the lateral
include radiation, hydrology, the convection, topography, the boundary layer and the surface
heat flows. These parameters are recalculated from the global climate model (MGC) routines
for each time step of the model (20 minutes). This model uses the Canadian Land Surfaces
Scheme (CLASS) [70,71] to illustrate the vegetation influence on the surface energy budget.
CLASS simulates the hydrographical processes including the evaporation, the transpiration, the
infiltration, the sensible and latent heat flows and the radiation. It simulates the temperature and
humidity on a vertical profile starting from surface until a depth of 3.75 cm in the ground. At
the same time, dynamic climate of the ground calculated by CLASS, product feedbacks
interactively with the basic variables of LCM. The coupled system atmosphere-ground
produces a climate on a column starting from the ground to the stratosphere high level (100hPa).
Starting from LCM model, we used the aerological data of Maniwaki covering sixteen years
period, from 1988 to 2004. These data are treated by a program interpolating the aerological
data, from the surface to 100hPa level to assimilate data and the dynamic tendencies evolution
of the temperature, moisture, the wind and the pressure.
To develop a CG lightning parameterization, two selected data are used: 1) the hourly data of
CG lightning for May to August period from sixteen years (1988 to 2004), in a 100 km radius
around, Maniwaki, and 2) interpolated atmospheric data from LCM at Maniwaki station. We
have 47 232 hours of measurement data equivalent to 1968 days with electric activity. 167 417
CG lightning impacts were recorded during this period. This recover CG lightning resolution is
used, since is adequate to global and regional climate models. The actual climate models
resolution is about 100 km around a point [37,63,15,51]. We are choice this scale as a resolution
reference. Since the selected data are robust, we will demonstrate that the choice of one station
is adequate to define an applied parameterization at all Canadian domain.
In order to validate this CG lightning parameterization on independent regions, we will have
(1999-2004). We chose these areas where they are distributed on a vast territory, from the west
to the east to provide independent tests on the Canadian domain.
4. Hypothesis
Although there are several theoretical studies speaking about the electric phenomena such as
the theory of the fine precipitation droplets collision with the selective ions capture [44,45,2],
we found Williams [76] who developed a simple lightning parameterization using the cloudy
column thickness on basis of the theoretical electric equations, frequency and standard
aerological data. Price and Rind [68] used this parameterization, applicable at continental
regions, to develop it at maritime regions to compare the total lightning at actual and climate
change scenarios at global scale. Soriano et al. [50] analyzed the relationship between the flash
density and the number of thunderstorm days, using the aerological data of 12h TU from 168
days at Madrid, Spain. They used a statistical method to deduce the correlation between the CG
flash density, dew-point temperature at 850hPa and temperature difference between 850hPa
and 700hPa. Also, Devendraa et al. [42] explain that the vertical profiles of temperature and
moisture represents two main parameters to convection development in the atmosphere where
the wind vertical profile influences the structure, evolution and movement convectif in the
atmosphere.
To study the meteorological parameters comportment with the CG lightning occurrence, we use
the Solomon et al. [49] hypothesis, where confirmed a strong dependence between the
temperature, the water content and the electric charge transfers inside thunderstorm. Also, to
dew-point temperature of the 850hPa level (Td850) and the precipitable water content (PWC)
to represent the water contents in the convective cloud. We selected the temperature difference
between 850hPa and 700hPa levels (T700), between 850hPa and 500hPa levels (T500),
between the surface and 200hPa level (T200), the convective available potential energy
(CAPE), and the freezing level altitude (FLA) to represent the temperature of the convection.
After analyses, we found that the freezing level altitude (FLA) and the precipitable water
content (PWC) as being the best parameters to characterize the CG lightning activity in the
CRCM. The results obtained give a better correlation for these two parameters (PWC and FLA)
with the monthly CG lightning frequency and occurrence during the 16 years period of studies
(Table 1).
Table 1.1: Monthly CG lightning occurrence (a, OCC) and frequency (b, F) correlation with the selected parameters: dew-point temperature of the 850hPa level (Td8), precipitable water content (PWC), temperature difference between 850hPa and 700hPa levels (T700), temperature difference between 850hPa and 500hPa levels (T500), temperature difference between the surface and 200hPa level (T200), the convective available potential energy (CAPE), and the freezing level altitude (FLA).
(a)
OCC Td8 PWC FLA T700 T500 T200 CAPE
r 0.48 0.80 0.54 -0.13 -0.21 0.24 0.52
(b)
F Td8 PWC FLA T700 T500 T200 CAPE
r 0.49 0.50 0.51 0.10 0.11 0.32 0.50
This indicates that other factors not considered have an important influence. We already
identified that the microphysics of the precipitation and the clouds are in question and should
be considered in a future version of CRCM, when these variables are explicitly treated in a
predictive way. They are however not available in the current version, which causes to limit the
the essential conditions but insufficient for the CG lightning occurrence. To treat rigorously the
CG lightning, it is necessary to include the equations of the electric charges budget in the
dynamics of the model [47,48,26]. However, these predictive equations must be solved on
spatial and temporal scales inaccessible by the climatic models, from where need for folding
back itself on a CG lightning parameterization.
The freezing level altitude (FLA) and the convective available potential energy (CAPE)
presented respectively two nearly linear correlation coefficients (Table 1). Since they represent
respectively the potential energy of the atmospheric layer under the freezing level and these of
the convection available, it is clearly that their linear correlation coefficients with the CG
lightning are almost similar. The use of the FLA instead of the CAPE was selected for the
flexibility and its calculation reliability cause from the climatic models diagnostic data. The
freezing level altitude (FLA) is calculated from LCM geopotential levels corresponding to
positive and negative temperature immediately. The precipitable water content (PWC) is
calculated using a vertical integration of the total humidity content from an atmospheric column
surface of a 1 m2. These two parameters are calculated from the LCM diagnostic data. Although
about half of the precipitable water content is below the 850hPa level (nearly altitude of 1500
meters), our correlation tests with the CG lightning frequency suggest the use of the total
precipitable water content in the atmosphere representing the lightning conditions. That enables
us to not discriminate the water quantity above the 850hPa level.
5. Results
Many researches indicates that the CG lightning frequency is related to the weather conditions
[28,30,59], to geographic or orographic factors [50,53], and to atmospheric electricity [48,26].
processes of the electric charges composition in the cloud convection, we limit this research to
the climatic parameters study related to the CG lightning type. The complexity of the
microphysical processes in the atmosphere does not enable to us to include the electric
parameters explicitly in this study. For that reason the CG lightning is very complex. Indeed,
the electric characteristic depends of sizes and droplet water number in convective clouds
[47,49]. Thus, the momentary intense updraft motion [59] and the precipitation mechanisms [8]
have a direct effect in lightning occurrence and frequency. For our case, the temperature and
the moisture content, presenting our reference data, have a direct influence to electric charge
formation in convective cloud [50].
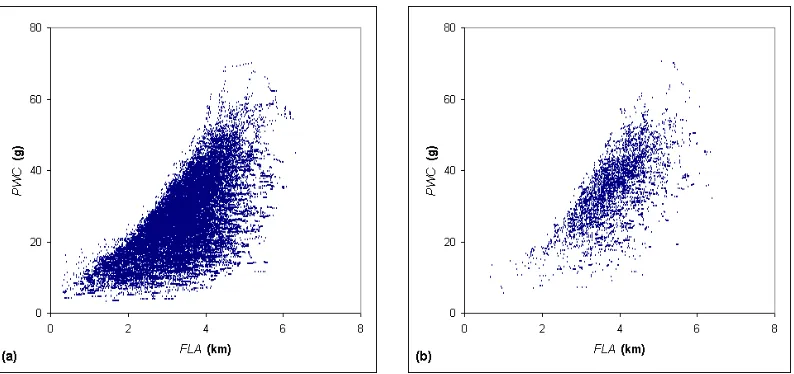
The figures 1(a) and 1(b) shows respectively the hourly variation of the freezing level altitude
(FLA) with the precipitable water content (PWC) in absence and presence of CG lightning.
Generally, a high level of FLA is characterized by a maximum of precipitable water content
thus forming a static instability where the CG lightning could appear. On the other hand, a low
level of FLA supports the stable atmospheric conditions and the precipitable water content
decreases. This last condition disadvantages the CG lightning occurrence or decreases its
frequency. Figures 1(c) and 1(d) confirm this observation where more than 60% of the higher
FLA and PWC cases are characterized by high CG lightning frequencies and occurrences.
Is not rare to found the atmospheric unstable condition in presence of an important quantity of
humidity without CG lightning occurrence where the figure 1(a) shows these conditions.
Solomon et al. [49] confirmed the possibility absence of CG lightning occurrence in
atmospheric convection. They explained that the complexity of microphysics processes in
thunderstorm is the principal cause of absence or presence of lightning.
Since it is impossible to include the microphysical effects of convective clouds on the lightning
a statistical relationship of the convection static state and its water content to determine the CG
lightning occurrence and frequency. As it was explained before, we found that the combination
of the freezing level altitude (FLA) with the precipitable water content (PWC) presents the best
result using the monthly CG lightning parameterization.
To study the dependence of the CG lightning occurrence and frequency with the climate, the
hourly, the mean daily and the mean monthly data during May-August of sixteen years at
Maniwaki are analyzed. The CG lightning frequency represents the number of instantaneous
impacts whereas its occurrence describes the number of hours with the lightning. Since, the
hourly and daily correlation of the CG lightning frequency with climatic parameters is weakly,
we limit our calculations with the mean monthly data. The application of various types of
correlation showed us a better result with the linear method. This choice enables us to stabilize
our results compared to the observations, which is not the case for the exponential correlation
where its results can be converged quickly to the extremely high values of FLA and PWC
(figure 2(a) and 2(b)), causing an imbalance compared to the observations. The utility of the
statistical link is to quantify the CG lightning from the climatic parameters characterizing the
mean convection. We will explain further the weakness cause of the hourly and daily correlation
between the climatic data and the CG lightning.
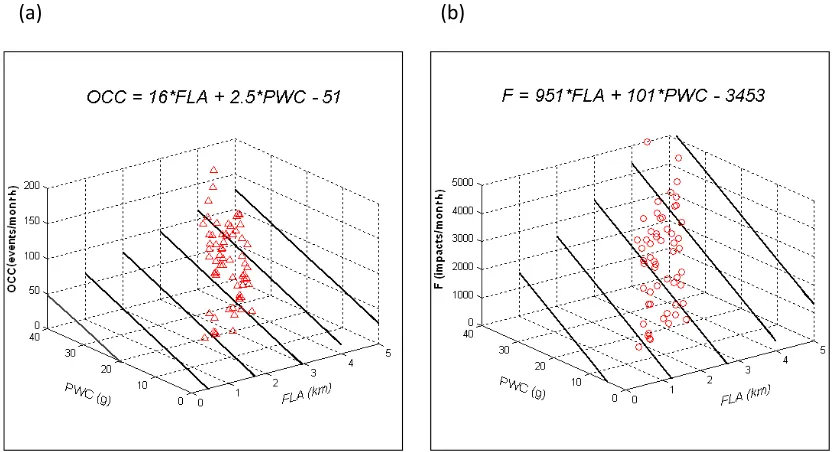
Firstly, we correlate the monthly CG lightning occurrence (OCC, events month-1) with the mean
monthly freezing level altitude (FLA) and the mean monthly precipitable water content (PWC)
[34,43]. Their parameterization is presented as
OCC = 16*FLA + 2.5*PWC - 51 (1)
The spatial distribution of OCC compared to the corresponding FLA and PWC are presented at
figure 3(a). Their correlation coefficients are respectively 0.54 and 0.80. This relationship is
presented by aligned straight lines in this figure.
Secondly, the statistical correlation [34,43] between the monthly CG lightning frequency (F,
impacts month-1), the mean monthly freezing level altitude (FLA) and the mean monthly
precipitable water content (PWC) defined as
F = 951*FLA + 101*PWC – 3453, (2)
n = 64, p < 0.0001
The figure 3(b) shows the spatial distribution of F compared to the corresponding FLA and
PWC. Their correlation coefficients are respectively 0.51and 0.50. This relation is presented by
aligned straight lines in this figure.
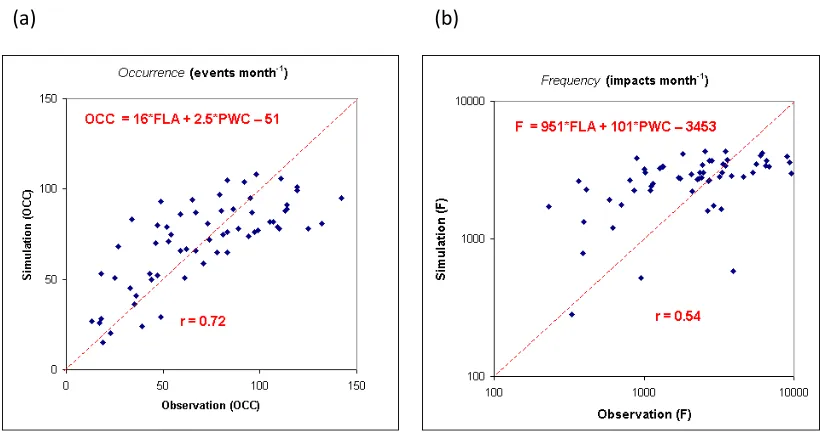
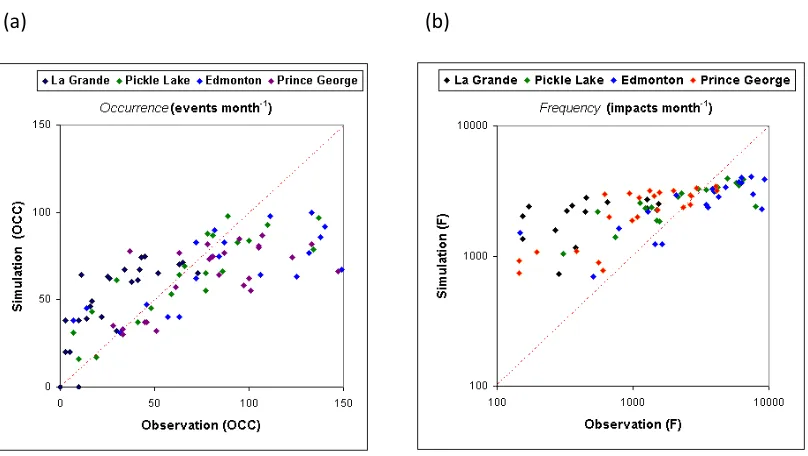
The figure 4(a) shows a comparison between the CG lightning occurrence calculated from the
preceding equation and the observations. Their distribution presents a better correlation
coefficient. The mean absolute error rate is equal to 27% compared to the mean observed data.
Indeed, the CG lightning occurrence, constitute one event for one hour with lightning without
consider its frequency, will reflect with advantage the climatic conditions. The great variability,
presented in the CG lightning frequency, will be eliminated through its occurrence. The
microphysical process effects causes mainly the large variability of the CG lightning frequency,
where it is not appears for the occurrence. It is for that reason the CG lightning occurrence
variability does not present high variations like that with the frequency compared to the
equivalent observed data (figures 5(a) and 5(b)).
The figure 4(b) shows a comparison between the CG lightning frequencies calculated from the
coefficient. The mean absolute error rate is equal to 55% compared to the mean observed data.
The observed CG lightning frequency varies largely comparatively to the simulated data,
presenting an over-estimate for the weak frequencies and an under-estimate for the high
frequencies (figure 4(b)). Their temporal evolution presents proportionality between them
(figure 5(b)). Since the CG lightning frequency depends essentially to the electric capacity in
the cloud, the microphysical processes influence directly this effect like the particles evolution
of the electric charges in the convection and their spatial and temporal distribution since they
are the origin of the lightning occurrence. The missing of the electric knowledge ignites the CG
lightning and their representation in the model is a significant handicap causing this difference.
Also, it is possible to estimate the monthly day’s number with CG lightning (JJ, days month-1)
from its monthly occurrence (OCCM, events month-1). The statistical equation is established as
follows
JJ = 0.12*OCCM + 4.65 (3)
n = 64, p < 0.001
with a correlation coefficient of 0.82,
To test this parameterization, we applied this formulation during the sixteen study years. The
figure 5(c) shows the temporal calculated and observed variation of monthly days numbers with
CG lightning. The results show the same variability compared to the equivalent observed data
like as with occurrence. The mean absolute error rate is equal to 24 %, compared to the mean
observed data.
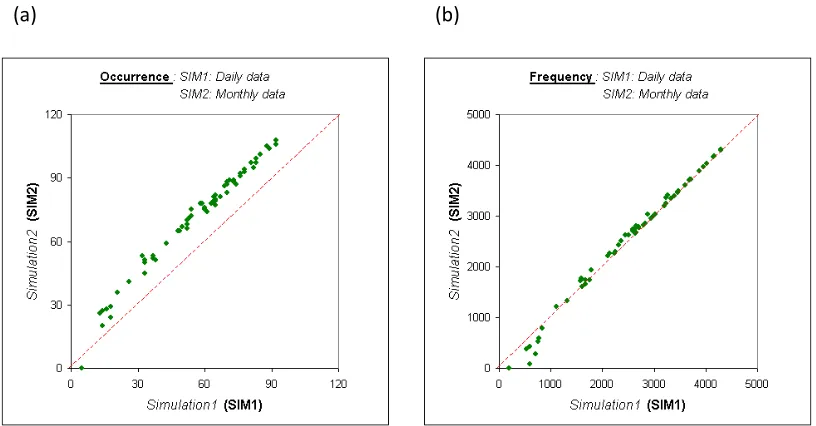
In a second phase, we applied this parameterization (formulation 1 and 2) with the mean daily
permitted us to find again the same monthly results of the CG lightning occurrence and
frequency with a very high correlation coefficient (figures 6(a) and 6(b)). That confirmed us
the monthly calculation was preserved with the CG lightning parameterization application to
the daily data.
For the four Canadian regions (figure 7) and for the same periods from May to August and for
six years (1999-2004), the monthly CG lightning occurrence and frequency variation
calculation compared to the observation shows the same variability as that of Maniwaki (figures
8 (a) and 8(b)). The mean absolute error rate is between 27% and 39% for the occurrence,
between 49% and 57% for the frequency and between 21% and 35% for the numbers of days
with CG lightning compared to the observation. Thus, we note an over-estimate for the weak
frequencies and an under-estimate for the high frequencies in these regions like as with
Maniwaki. As it was explained before, the CG lightning frequency increases quickly in climate
characterized by a very unstable condition and with maximum humidity than the
parameterization is not able to calculate them. In the same way, the missing of the electric
knowledge in the clouds represents a constraint of the CG lightning parameterization.
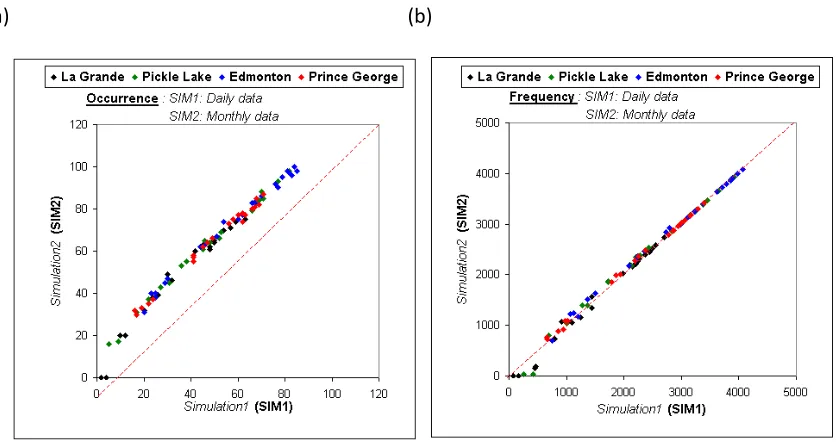
Lastly, the use of the CG lightning parameterization showed that the monthly CG lightning
occurrence and frequency using the daily and monthly climate data are similar for the four areas
tested (respectively figures 9(a) and 9(b)). That confirms us the daily results are representative
with monthly calculations. In the next section, we will discuss the CG lightning
parameterization while referring to the physical processes of the convection in the atmosphere.
6. Discussion
From the freezing level altitude (FLA), representing a critical level where the water vapor will
beginning formed. The light particles (water droplets and ice crystals) are raised under the
action of the unstable updraft motion inside the convective cloud. They electrified positively
following several complex processes, while the heavy particles (water drops and hails) move
to the lower cloud level while taking electrified negatively [16,75,11,57]. The electric charges
will be formed, causing the CG lightning occurrence when the electric potential between the
bottom cloud and the ground becomes important.
The application of the Solomon et al. [49] hypothesis at Maniwaki region during the
Mai-August period of sixteen study years confirmed the relationship between the CG lightning
occurrence and the air instability, equivalent to a higher freezing level altitude (FLA), and an
important quantity of precipitable water. Indeed, the figure 1(b) confirmed this observation. In
these conditions, the statistical computing presented a mean daily CG lightning frequency of
180 impacts per day, equivalent to a mean daily CG lightning occurrence of 4 events per day.
On average, 8 days from 12 per month characterized by CG lightning occurrence, equivalent to
a mean probability of 67%.
However, it is not rare that these conditions can present without CG lightning where figure
1(a) shows this observation. Solomon et al. [49], using the microphysical processes at a storm
development, confirm that the convection could produce or not the CG lightning. In an opposed
way, the electric charges formed in a storm can produce the CG lightning in atmospheric
conditions characterized by a low freezing level altitude and a no significant quantity of
precipitable water. In this case, the CG lightning frequency could be weak. We noted this
observation in figure 1(b) where the CG lightning appears with a weak CG lightning frequency,
generally equivalent to a mean of one impact per hour, or a mean of 17 impacts per day. The
electric charges formed in these conditions, can produce the CG lightning where our
parameterization could not product it. The complexity of the microphysical processes inside the
Although our parameterization is conceived to quantify the CG lightning, it becomes essential
to be based on statistical correlations between its occurrence and the climatic conditions on the
one hand, and between its frequency and the same climatic conditions on the other hand. Our
objective was to determine a better correlation between the simulation and the observation data.
Figures 5(a), 5(b) and 5(c) have these results with a mean absolute error rate of 27%, 55% and
24% for the occurrence, frequency and monthly numbers of days with CG lightning
respectively.
The monthly computing showed that the CG lightning occurrence is correlated better than the
frequency to be comparable to the observation data (figures 4(a) and 4(b)). Indeed, the
computed CG lightning frequency varies proportionally with the equivalent observed data,
presenting sometimes a notable difference between them, the case of July for the years 1993,
1994, 1999 and 2001 (figure 5(b)). These differences represent under-estimations of the CG
lightning frequency mentioned in figure 4(b) and presented by points below the diagonal. It is
almost difficult that the climatic conditions can identify this variation exactly. The absence of
the electric effect in the CG lightning parameterization, related mainly to the cloud
microphysical processes, is the principal cause of this variability. On the other hand, the CG
lightning occurrence is better comparable to the equivalent observed data, excluded than of July
of the years 1993, 1994, 1996 and 1998, presenting high errors (figure 5(a)), due mainly to
occurrences characterized by weak frequencies that the CG lightning parameterization cannot
detected. These same under-estimations of the CG lightning occurrence and frequency are also
presented on four Canadian areas (figures 8(a) and 8(b) respectively). The simulated
occurrence (figure 8(a)) is compared favorably with the observations that its frequency at all
stations as in Maniwaki.
The application of the CG lightning parameterization on Maniwaki region and on four Canadian
parameterization results, using the monthly data (figures 6(a) and 6(b), and figures 9(a) and
9(b)). That enables us to use the CG lightning parameterization with the regional climate models
to evaluate its spatial distribution and temporal variation compared to the observed data. It is
very interesting to evaluate these results in a context of climate changes.
7. Conclusion
The CG lightning parameterization was developed using the diagnostic data of the Local
Climate Model (LCM). The atmospheric variables, characterizing the convection during the
May-August period of sixteen years in Maniwaki region (located in the south-western Quebec),
were analyzed with the CG lightning occurrence and frequency. The freezing level altitude and
the precipitable water content were selected to develop a CG lightning parameterization. The
dependence between the freezing level altitude and the precipitable water content in presence
and absence of CG lightning was presented. Then, a CG lightning occurrence and frequency
parameterization was developed. Lastly, the application of this parameterization in Maniwaki
and four Canadian regions was analyzed. The principal results are as follows:
Firstly, the analysis of the various climatic parameters showed that the freezing level altitude
and the precipitable water quantity are the best parameters to characterize the CG lightning
occurrence in the CRCM. Although other factors related to the clouds and precipitation
microphysics are not considered in this study, for the cause of no availability in the CRCM.
These climatic parameters chosen represent necessary conditions but no sufficient for the CG
lightning occurrence.
Secondly, the knowledge of the freezing level altitude and the precipitable water quantity permit
as to computing the CG lightning occurrence and frequency at monthly scale. A comparison
difficulty level in cause, the monthly CG lightning occurrence and frequency with a mean
absolute error rate of 27% and 55% respectively. The microphysical processes, since they
represent important mechanisms with the CG lightning frequency, are the principal source of
these errors, not considered in our CG lightning parameterization. This is the principal
inaccuracy factor of the CG lightning parameterization at daily and monthly scales. However,
the application of this CG lightning parameterization to daily data, help us to re-find the
monthly results. The application of the parameterization in four Canadian regions showed the
same conclusions like as with Maniwaki, confirming the robustness of this parameterization on
Canada.
Since the monthly results showed proportionality with the equivalent observed data, it become
difficult to compute exactly the CG lightning occurrence and frequency for the absence of the
electric processes in our parameterization. This parameterization will give as best results in a
context of climate change scenarios.
Lastly, an additional work must be developed in a large domain to study the robustness of the
CG lightning parameterization with the regional numerical models, which will be the subject
of the next stage. It would be also interesting to determine how this method can be applied to
regions other than Canada but comparable to climatic condition such Siberia and Europe. In
conclusion, this parameterization will also make it possible to improve research on the effect
between forest fire indexes, the CG lightning occurrence and frequency variability on the
current climate and the climate changes following the greenhouse gases, aerosols and
Figure 1 Variation of the hourly freezing level altitude (FLA) with the precipitable water content (PWC) in a) absence and b) presence of CG lightning at Maniwaki, during May-August period of 1988-2004 years (16 years, excluding 1991). The figures (c) and (d) illustrate the observed monthly mean CG lightning frequency variation according to the freezing level altitude (FLA) and the precipitable water content (PWC) respectively.
(a) (b)
Figure 2 Evolution of the CG lightning a) occurrence (OCC) and b) frequency (F) parameterization using the linear and exponential methods at Maniwaki, during May-August period of 1988-2004 years (16 years, excluding 1991).
(a) (b)
(a) (b)
Figure 4 Variation between the simulated and observed monthly CG lightning a) occurrence (OCC, events month-1) and b) frequency (F, impacts month-1) at ″Maniwaki″ during
May-August period of 1988-2004 years (16 years, excluding year 1991).
(a)
(c)
Figure 5 Monthly evolution of the CG lightning a) occurrence, b) frequency and c) days number with CG lightning, at ″Maniwaki″ during May-August period of 1988-2004 years (16 years, excluding year 1991). The stick curve represents the difference between simulated and observed monthly results (Error).
(a) (b)
Figure 6 Variation between two simulated results of the CG lightning: a) occurrence and b) frequency at ″Maniwaki″ region during May-August period of 1988-2004 years (16 years, excluding 1991). The simulation 1 and 2 (SIM1 and SIM2) illustrates respectively the CG lightning parameterization applied to daily and monthly means.
Figure 7 Canadian areas map where the CG lightning parameterization is verified.
(a) (b)
(a) (b)
Figure 9 Variation between two simulated results of the CG lightning a) occurrence and b) frequency at ″La Grande″, ″Pickle Lake″, ″Edmonton″ and ″Prince George″ region during May-August period of 1999-2004 years (6 years). The simulation 1 and 2 (SIM1 and SIM2) illustrates respectively the CG lightning parameterization applied to daily and monthly means.
References
1. Anderson R. B., Erickson A. J. Lightning parameters for engineering application.
Electra. 1980, 69: 65-102.
2. Arif A. La foudre dans l'atmosphère: l'avenir de notre énergie en 2050. Éditions
Universitaires européennes, ISBN: 978-3-8381-8304-6. 2014, 96 pages.
3. Arif A. Climatologie des indices de feux de forêts avec les Modèles Climatiques
Canadiens (MLC et MRC). Éditions universitaires européennes. ISBN:
978-613-1-53592-5. 2012, 136 pages.
4. Bergeron Y., Flannigan M. D. Predicting the effects of climate change and on fire
frequency in the Southeastern Canadian Boreal forest. Weather, Air and Soil pollution.
5. Bergeron Y. Les conséquences des changements climatiques sur la fréquence des feux
et la composition forestière au sud-est de la forêt boréale québécoise. 1998. Vol. 52, n°
2: 167-173.
6. Bergeron Y., et al. Natural fire frequency for the eastern Canadian boreal forest:
Consequences for sustainable forestry. Can. J. For. Res. 2001, 31: 384-391.
7. Blustein H. B., MacGorman D. R. Evolution of Cloud-to-Ground Lightning
Characteristics and Storm Structure in the Spearman, Texas, Tornadic Supercells of 31
May 1990. Ame. Meteorol. Soc. 1998, 1451-1467.
8. Carey L. D., Rutledge S. A. Electrical and multiparameter radar observations of a severe
hailstorm. J. Geophys. Res. 103: 1998, 13 979-4 000.
9. Caya, D., R. Laprise, M. Giguère, G. Bergeron, J. P. Blanchet, B. J. Stocks, G. J. Boer,
and N. A. McFarlane. Description of the Canadian regional climate model. Water, Air
and Soil Pol., 82. 1995, 477-482.
10.Caya, D., R. Laprise. A Semi-Implicit Semi-Lagrangian Regional Climate Model: The
Canadian RCM. Month. Weath. Rev, 127. 1999, 341-362.
11.Chiu C. S., Klett J. D. Convective electrification of clouds. J. Geophys. Res., 81. 1976,
1111-1124.
12.Chuang C. C., Penner J. E., Edwards L. L. Nucleation scavenging of smoke particles
and simulated drop size distributions over large biomass fires. Journal of the
Atmospheric Sciences, Vol. 49. 14. 1992, 1264-1275.
13.Conseil Canadien des Ministres des Forêts. Critères et indicateurs de l'aménagement
14.Dale V. H., et al. Climate change and forest disturbances. Bioscience: 51 (9). 2001,
723-734.
15.Denis B., Laprise R., Caya D. Sensitivity of a regional climate model to the resolution
of the lateral boundary conditions. Climate Dynamics: 20. 2003, 107-126.
16.Elster J., Geitel H.,. Über eine Methode, die elektrische Natur der atmosphärischen
Niederschläge zu bestimmen (About a method for determining the electric nature of
atmospheric precipitation). Meteor. Z., 5. 1888, 95-100.
17.Granström A. Spatial and Temporal Variation in Lightning Ignitions in Sweden. Journal
of Vegetation Science, Vol. 4. 1993, 737-744.
18.Gong S. L., Barrie L. A., Lazare M. Canadian Aerosol Module (CAM): A
size-segregated simulation of atmospheric aerosol processes for climate and air quality
models, 2, Global sea-salt aerosol and its budgets. Jour. of Geophy. Resea., Vol. 107,
NO. D24. doi: 10.1029/2001JD002004. 2002.
19.Gong S. L., et al. Canadian Aerosol Module: A size-segregated simulation of
atmospheric aerosol processes for climate and air quality models, 1, Modele
development. Jour. Of Geophy. Resea., Vol. 108, NO. D1, doi. 10.1029/2001JD002002.
2003.
20.Greene J. S., et al. Relationships between Synoptic Climatology and Atmospheric
Pollution at 4 US Cities. Theor. Appl. Climatol., 62. 1999, 163-174.
21.Grelle A., et al. Evaporation components of boreal forest: Variations during the growing
22.Guyette R. P., Muzika R. M., Dey D. C. Dynamics of an Anthropogenic Fire Regime.
Ecosystems, 5. 2002, 472-486.
23.Hall, J. P. Effects of acidic deposition on Canada's forests. Information report ST-X
/ Canada. Forestry Canada, v, 25. 1998, 23 p.
24.Hauf T. Lightning statistics for southern Germany. Institut for Physik der Atmosphere
des DLR, Oberpfaffenhofen, 1997.
25.Huffines G. R., Orville R. E. Lightning ground flash density and thunderstorm duration
in the continental United States: 1989-96. J. Appli. Meteorol., 38. 1999, 1013-1019.
26.Qie X., et al. Charge analysis on lightning discharges to the ground in Chinese inland
plateau (close to Tibet). Ann. Geophysicae 18. 2000, 1340-1348.
27.MacGorman D. R., et al. Lightning rates relative to tornadic storm evolution on 22, May
1981. J. Atmos. Sci., 46. 1989, 221-250.
28.MacGorman D. R., Rust W. D. The electrical nature of storms. Oxford University Press.
1998, 422 pages.
29.Mackerras D. Prediction of Lightning Incidence and Effects in Electrical Systems.
Electr. Eng. Trans. Inst. Aust., EE-14. 1978, p. 73-77.
30.Brian I. M. Global Lightning Parameterization from CMIP5 Climate Model Output.
Journal of atmospheric and oceanic technology, Volume 32. 2015, 434-452.
31. McFarlane N. A., Boer G. J., Blanchet J. P., Lazare M. The Canadian Climate Centre
Second Generation General Circulation Model and its Equilibrium Climate. J. Climate,
32.McFarlane. Description of the Canadian regional climate model. Water, Air and Soil
Pol., 82. 1995, 477-482.
33.McNicol, D. K., Mallory, M. L., Sechley, J. Acid rain and wildlife. An annotated
bibliography of Canadian Wildlife Service (Ontario region): LRTAP program
publications: (1980-1997), Technical Report Series / Canadian Wildlife Service; no.
305. 1998, 70 p.
34.Mickey R. M., Dunn O. J., Clark V. A. Applied statistics: analysis of variance and
regression. 3rd ed., Edition Hoboken, N.J. : Wiley-Interscience. 2004, 448 pages.
35.Norville K., Baker M., Latham J. A numerical study of thunderstorm electrification:
Model development and case study. J. Geophy. Res. 96. 1991, 7463-7481.
36.Orville R. E., Huffines G. R. Lightning ground flash measurements over contiguous
United States: 1995-1997. Mon. Weather Rev., 127. 1999, 2693-2703.
37.Rabinovitz F. et al. A Variable-Resolution Stretched-Grid General Circulation Model:
Regional Climate Simulation, Monthly Weather Review Volume: 129 Issue: 3. 2001,
Pages: 453- 469.
38.Radojevic M. Chemistry of Forest Fires and Regional Haze with Emphasis on Southeast
Asia. Pure Appl. Geophys., 160. 2003, 157-187.
39.Reader M. C., Boer G. J. The modification of greenhouse gas warming by the direct
effect of sulfate aerosols. Climate Dynamics, 14. 1998, 593-607.
40.Reid J. S., et al. Relationships between cloud droplet effective radius, liquid water
content, and droplet concentation for warm clouds in Brazil embedded in biomass
41.Ressources naturelles Canada. L’état des forêts au Canada, 1999-2000. Service
canadien des forêts. 2000, 122 pages.
42.Devendraa S., R.P. Singh, Sarvan Kumar, T. Dharmaraj, Abhay K. Singh,
Ashok K. Singh, M.N. Patil, Shubha Singh. Lightning and middle atmospheric
discharges in the atmosphere. Journal of Atmospheric and Solar-Terrestrial Physics.
2015, 78–101.
43.Sanford, W. Applied linear regression. 3rd ed. Edition Hoboken, N.J.: John Wiley and
Sons. 2005, 310 pages.
44.Sartor, J. D. A laboratory investigation of collision efficiencies, coalescences and
electrical charging of simulated cloud droplets. J. Meteor., 11. 1954, pp. 91-103.
45.Sartor, J. D. The role of particle interactions in the distribution of electricity in
thunderstorms. J. Atmos. Sci., 24. 1967, 601-615.
46. Sexton D. M. H., et al. Detection of anthropogenic climate change using an atmospheric
GCM. Climate Dynamics. 17. 2001, 669-685.
47.Solomon R., Baker M. A one-dimensional lightning parameterization. Jour. Geophy.
Res. 101. 1996, 14,983-14,990.
48.Solomon R., Baker M. Lightning flash rate and type in convective storms. Jour. Geophy.
Res. 103. 1998, 14,041-14,057.
49.Solomon R., et al. Relating cloud microphysical properties and lightning model analysis
of an extreme hailstorm. Proceeding of the 5rd EGS Plinius Conference held at Ajaccio,
50.Soriano L. J. R., De Pablo F., Garcia Diez E. L. Meteorological and geo-orographical
relationships with lightning activity in Castilla-Leon (Spain). Meteorol. Appl. 8. 2001,
169-175.
51.Stratton S. A. Report on aspects of variability in high-resolution versions of HadAM3,
Hadley Centre technical note 53. 2004.
52.Spacek L., et al. The NARCM Aerosol Model Applied to Eastern North America LITE
Shuttle Measurement Period, J. Geophys. 1999.
53.Therien J., Gadian A. Influence of topography and urban heat island effects of the
outbreak of convective storms under unstable meteorological conditions: Met. Appl.4.
1997, 139-149.
54.Therien, D. Le modèle de circulation générale atmosphérique canadien en version
colonne : FIZ-C. Université du Québec à Montréal. 1993, 123 pp.
55.Thielen J., McIllveen J. F. R. Topographical influence on severe convective storms. In
Conf. Proceedings on the 2nd Int. Symp. Hydr. Applic. Of Weather Radar. University
of Hannover. 1996.
56.Thielen J., Gadian A. Influence of topography and urban heat island effects on the
outbreak of convective storms under unstable meteorological conditions: Meteorol.
Appl. 4. 1997, 139-149.
57.Tokahashi, T. Warm cloud electricity in a shallow axisymmetric cloud model. J.
Atmos. Sci., 36. 1979, 2236-2258.
58.Kochtubajda B., et al. Lightning and Fires in the Northwest Territories and Responses
59.Lang T. J., Rutledge S. A Relationship between convective Storm Kinetics,
Precipitation, and Lightning. Month. Weat. Re., 130. 2002, 2492-2506.
60.Lavoué, D., C. Liousse, H. Cachier, B.J. Stocks, J.G. Goldammer. Modeling of
carbonaceous particles emitted by boreal and temperate wildfires at northern latitudes.
Journal of Geophysical Research, 105, D22. 2000, 26,871-26,890.
61.Lavoué, D. Transport vers la région arctique de l'aérosol carbone émis par les feux de
biomasse des régions boréales et tempérées. Thèse de doctorat, Laboratoire des sciences
du climat et de l'environnement, Université Paris 7. 2000.
62.Leduc, R. Acid precipitation in Québec: état de la situation. Québec, Ministère de
l'environnement et de la faune. 1996, 49 pages.
63.Lowe, J. A., Gregory, J. M., Flather, R. A. Changes in the occurrence of storm surges
around the United Kingdom under a future climate scenario using a dynamic storm
surge model driven by the Hadley Centre climate models. Climate Dynamics, 18. 2001,
179-188.
64.Papadopol C. S. Impacts of climate warming on forests in Ontario: options for
adaptation and mitigation. The Forestry Chronicle, 76 (1).2000, 139-149.
65.Penner J. E., Chan S. J., Walton J. J. The role of biomass burning in the budget and
cycle of carbonaceous soot aerosols and their climate impact. Climate Biomass burning,
J. Levine, Ed., MIT Press. 1991, 387-393.
66.Penner J. E., Chuang C. C., Grant K. Climate forcing by carbonaceous and sulfate
67.Petersen W. A., Rutledge S. A. On the relationship between cloud-to-ground lightning
and convective rainfall. J. Geophys. Res., 103. 1998, 14025-14040.
68.Price C., Rind D. A simple Lightning parameterization for calculating global lightning
distributions. J. Geophys. Res. 97. 1992, 9919-9933.
69.Uman M. A. The Lightning Discharge. Academic Press, San Diego, CA, International
geophysics series, V. 39 xii. 1987.
70.Verseghy D. L. CLASS - A Canadian Land Surface Scheme for GCMS-I, Soil Model.
International Journal of Climatology, vol. 11. 1991, 111-133.
71.Verseghy D. L., McFarlane N. A., Lazare M. CLASS - A Canadian Land Surface
Scheme for GCMS-II, Vegetation Model and Complet Runs. International Journal of
Climatology, vol. 13. 1993, 347-370.
72.Weber M. G., Flannigan M. D. Canadian boreal forest ecosystem structure and function
in a changing climate: impact on fire regimes. Environ. Res., 5 (3 and 4). 1997,
145-166.
73.Weiss D., Shotyk W., Kempf O. Review articles: Archives of Atmospheric Lead
Pollution. Naturwissenschaften, 86. 1999, 262-275.
74.Wierzchowski J. Heathcott M., Flannigan M.D. Lightning and lightning fire, central
cordillera, Canada. International Journal of Wildland Fire, vol. 11, n. 1. 2002, 41-51.
75.Wilson C. T. R. Some thundercloud problems. J. Franklin Inst., 208. 1929, 1-12.
76.Williams E. R. Large-scale charge separation in thunderstorm. J. Geophy. Res., 90.
1985, 6013- 6025.
77.Williams E. R., Renno N. An analysis of the conditional instability of the tropical
78.Xiushu Q., Toumi R., Yunjun Z. Lightning activity on the central Tibetan Plateau and
its response to convective available potential energy. Chinese science Bulletin, vol. 48,
N°3. 2003, 296- 299.
79.Zhou Y., Qie X., Soula S. A study of the relationship between cloud-to-ground lightning
and precipitation in the convective weather system in China. European Geophysical
Society, 20. 2002, 107-113.