Development and commercial application
of an avocado fruit robustness test
Danielle Le Lagades
Department of Employment, Economic Development
& Innovation
AV07005
This report is published by Horticulture Australia Ltd to pass on information concerning horticultural research and development undertaken for the avocado industry.
The research contained in this report was funded by Horticulture Australia Ltd with the financial support of the avocado industry.
All expressions of opinion are not to be regarded as expressing the opinion of Horticulture Australia Ltd or any authority of the Australian Government.
The Company and the Australian Government accept no responsibility for any of the opinions or the accuracy of the information contained in this report and readers should rely upon their own enquiries in making decisions concerning their own interests.
ISBN 0 7341 2322 1
Published and distributed by: Horticulture Australia Ltd Level 7
179 Elizabeth Street Sydney NSW 2000 Telephone: (02) 8295 2300 Fax: (02) 8295 2399
© Copyright 2010
FINAL REPORT
AV07005
May 2010
Development and commercial
application of an avocado fruit
robustness test for ‘Hass’
avocados
Danielle Le Lagadec, Terry Campbell
and Peter Hofman
Horticulture & Forestry Sciences
Agri-Science Queensland
HAL Project Number:
AV07005
Project Leader:
Danielle Le Lagadec
Senior
Horticulturist
Agri-Science
Queensland
Department of Employment, Economic
Development and Innovation
Bundaberg Research Station
49 Ashfield Road
Bundaberg, Qld 4670
Phone: (07) 4132 5524
Fax:
(07) 4155 6129
Email:
Key Personnel:
Terry Campbell, Principal Extension Horticulturist
Peter Hofman, Senior Principal Horticulturist
Purpose:
The
Avocado Robustness project
was an initiative of Australian Avocado Ltd,
Agri-Science Queensland and Horticulture Australia Ltd. The aim of this two
year project was to develop a pre harvest test capable of predicting end-use fruit
quality several weeks before the commercial harvest.
Date of Report:
May
2010
Funding Sources:
Australian Avocado Ltd
Horticulture Australia Ltd
Agri-Science Queensland
A service of the Department of
Employment, Economic Development
and
Innovation
Disclaimer:
CONTENTS
CONTENTS...1
MEDIA SUMMARY...3
TECHNICAL SUMMARY...4
INTRODUCTION ...6
FIRST SEASON...8
MATERIALSANDMETHODS...8
Fruit samples...8
Dry matter testing ...8
Domestic market Avotest ...8
Commercial simulation test...9
Statistical analysis...9
Production practices...9
Potential commercial use and cost benefit analysis...10
RESULTSANDDISCUSSION ...10
Domestic market Avotest and the commercial test...10
External fruit quality...10
Internal fruit quality...11
Marketable fruit ...12
Correlation between Avotest and commercial test...15
Predictive model ...16
Grower feedback...17
Influence of farm cultural practices on fruit quality...17
The potential practical applications of the Avotest ...18
Cost Benefit analysis of Avotest ...19
Benefits to consumers ...19
Benefits to industry...19
Benefit to grower...20
CONCLUSIONS ...20
SECOND SEASON...21
MATERIALSANDMETHODS...21
Fruit samples...21
Dry matter testing ...21
Domestic market Avotest ...21
Domestic market commercial test ...21
Development of a long term storage (export) Avotest...22
Experiment 1 ...22
Experiment 2 ...22
Long term storage (export) Avotest...22
Long term storage (export) commercial test ...23
Statistical analysis...23
Grower feedback and production practices ...23
RESULTSANDDISCUSSION ...24
Domestic market Avotest ...24
Avotest and the commercial test...24
External fruit quality...24
Internal fruit quality...24
Marketable fruit ...25
Comparison of Domestic market Avotest fruit quality for 2008 and 2009 ...27
Comparison of the Avotest and commercial test ...28
Predictive model ...29
Positive and negative aspects of the domestic market Avotest ...31
Positives...31
Negatives ...31
Long storage Avotest ...31
Developing a long storage Avotest ...31
Experiment 1 ...31
Experiment 2 ...32
Long storage Avotest and commercial test...32
Comparison of the long storage Avotest and the commercial test ...34
Predictive model ...34
Positive and negative aspects of the long term storage (export) Avotest ...36
Positives...36
Negatives ...36
Grower Feedback ...36
CONCLUSIONS ...37
GENERAL DISCUSSION ...38
CONCLUSIONS ...39
TECHNOLOGY TRANSFER ...39
RECOMMENDATION...39
ACKNOWLEDGEMENTS ...39
REFERENCES...40
APPENDIX 1...47
APPENDIX 2...50
Avotest collaborator survey Questionnaire ...50
APPENDIX 3...51
Cost benefit analysis ...51
Scenario 1...51
Scenario 2...52
Scenario 3...53
APPENDIX 4...54
APPENDIX 5...64
MEDIA SUMMARY
In 2008, a project was launched to develop a test for Hass avocado quality. Two Avotests were developed—one for short-storage, domestic market fruit and one for long-storage or export fruit.
In an industry worth $420 million, if only good quality fruit were marketed, the Avotest could increase the quality of the retail fruit by 10%. Avotest will allow growers to make informed marketing decisions and improve fruit quality before commercial harvest begins.
The short-storage Avotest can:
identify fruit as marketable or unmarketable around 75–80% of the time,
predict some insect damage, fruit rots and some physiological disorders.
The long-storage Avotest can:
identify fruit as marketable or unmarketable around 86% of the time,
predict cold damage, some insect damage, fruit rot and diseases.
Both consumers and industry would benefit from improved fruit quality.
Since the Avotest uses fruit samples from the orchard, it cannot predict damage from handling of the fruit. Therefore, it is recommended that the Avotest be further
developed to include samples from the end of the packing line at the start of the avocado season.
If Avotest was widely used in central Queensland, there would be a reasonably high return for the industry. Potential commercial applications of Avotest include:
identifying blocks that need to be improved,
identifying the best blocks to supply markets that have strict quality requirements,
giving feedback on individual growing practices.
TECHNICAL SUMMARY
Australia’s avocado industry has 1200 growers, producing 46,500 tonnes of
avocados each year worth $120M at farm gate and $420M at the retail level. Despite considerable research effort, the quality of ripe avocados often do not meet
consumer expectations.
Quality issues usually only manifest during ripening and especially after storage, and are therefore rarely seen by the growers. With increased market supply and likely increases of on-tree and market storage, quality issues will become more important to the Australian industry. An accurate knowledge of fruit quality should become an important criterion on which stakeholders can base marketing decisions.
A project was launched in 2008 to develop a fruit robustness test called the Avotest. The test involved the rapid ripening of fruit under controlled conditions. This test, applied before the start of the commercial harvest, could be used as an indicator of expected retail fruit quality. Two Avotests were developed, one for short storage domestic market fruit and one for long storage or export fruit.
The Avotest results were verified by subjecting fruit from the same blocks to a
commercial cold chain simulation test. After two seasons of experiments it was found that the domestic market Avotest can categorize fruit as either marketable or
unmarketable with approximately 75-80% accuracy. On a block-to-block bases, the correlation between the Avotest and the commercial test was about 60% (r=0.57 for the 2008 experiment and r=0.55 for the 2009 experiment). The Avotest is a useful tool for ranking block performance. The test is best suited for indentifying outlying blocks i.e. those that produce poorer quality fruit. One of the major limiting factors of the Avotest is that the prediction model may need to be recalibrated each season.
The test effectively predicts levels of some insect damage, fruit rots and some physiological disorders. The domestic market Avotest has its limitation and can only predict defects which originate in the orchard. Fruit handling, which is a major cause of fruit rejection, and cold storage injuries cannot be predicted by the domestic
market Avotest. Approximately 10% of ‘Hass’ fruit on the retail shelf are unacceptable due to rots. In an industry worth $420M the correct use of the Avotest has the
potential to increase the industry’s fruit quality by 10% presuming only good fruit are offered to customers. The Avotest is able to give growers feedback regarding their fruit quality several weeks before the commercial harvest. This would enable growers to make informed marketing decisions and to take remedial action to improve their quality before the harvest begins.
The long storage Avotest closely mirrors the commercial test and therefore produced results which closely correlated with the commercial test (r=0.74). The long storage Avotest is able to reflect the fruits susceptibility to cold injury as well as some insect damage and rots. The test was able to categorize fruit into ‘marketable’ and
’unmarketable’ with approximately 86% accurately. However, this is not a rapid test and requires two to three weeks of cold storage. Despite the long storage period, the test would still allow sufficient time for growers to make informed marketing decisions and take remedial action especially if they were planning on delaying the harvest.
A cost benefit analyses for the domestic Avotest was conducted at the end of the 2008 season. It is predicted that consumers and the whole of industry would be a major beneficiary of improved quality. If Avotest was widely used in central Queensland there would be a reasonably high benefit to cost ratio of 3:1 to 7:1.
Grower feedback for the 2008 and 2009 Avotest results was encouraging. Some growers made changes to their farm practices based on their 2008 quality and saw improvements in their 2009 quality.
Collaborator interviews showed that growers valued the ability to predict fruit quality and identified potential commercial applications for the test. These included the use of Avotest to identify blocks requiring remedial action; to identify elite blocks for markets with high fruit quality requirements; and to give feedback on farming practices. The negative influence of heavy pruning, high vegetative vigour and high nitrogen levels, and the positive influence of high crop load on fruit quality were evident.
Since fruit were sampled from orchards for the Avotest, the test could not reflect commercial handling injuries. To overcome this, it is recommended that the Avotest be developed into a structured library tray system with fruit being sampled from the packing line at the start of the avocado season. Although this would limit the growers’ reaction time, end-use fruit quality results would still be available before the fruit reach the retail shelf. Growers and market agents would have sufficient time to make decisions regarding storage regimes and market selections. Furthermore, since blocks are often harvested repeatedly, growers may have sufficient time to take remedial action prior to the next harvest.
INTRODUCTION
Most avocado producing and importing countries recognize that a major factor limiting sales is variable fruit quality. The Australian industry produces approximately 47,000 tonnes of fruit each year worth $120M at farm gate and $420M at retail level (Avocados Australia Ltd Media Release, 12 May 2008). The industry is growing by 15% per year (Woolf et al. 2009). In order to maintain returns to growers
consumption has to increase. A recent consumer survey found that repeat sales are closely linked to fruit quality (Harker et al. 2007). Consumers have a low tolerance for
fruit with more than 10% internal defect. A recent survey of internal fruit quality problems on the retail shelf has shown that bruising is the major cause of fruit rejection affecting approximately 12% of fruit, followed by body rots (7.5%), vascular browning (6%), diffuse discolouration (5%), stem-end rots (3%) and other defects (0.5%) (Embry 2009a). Despite considerable research, quality remains a problem for the industry, slowing domestic and export expansion. The Australian industry has had a strong focus on quality for many years. This resulted in a number of surveys at retail outlets (Embry 2009a; Harker et al. 2007; Hofman and Ledger 2001; Ledger
1993), as well as targeted activities to improve the skills of ripeners/wholesalers, and retail staff (Improving Avocado Ripening Systems, AV08018). Despite these efforts, retail shelf quality has not improved much over the past decade (Embry 2007; 2009a; Hofman and Ledger 2001).
Considerable effort has been made to improve avocado fruit quality worldwide over the past thirty years. A lot of attention has been focused on postharvest storage, shipping temperatures and ripening regimes (Bezuidenhout et al. 1995; Blakey and
Bower 2009; Burdon et al. 2008; Cutting and Wolstenholme 1992; Dixon et al. 2003a;
Dixon et al. 2003b; Hofman et al. 2001; Mandemaker 2004; Roets et al. 2009; Van
Rooyen 2009; White and Hopkirk 1995; Yearsley et al. 2002a; b). However,
maximum fruit quality is determined before harvest. Postharvest treatments can only maintain quality or slow losses. Postharvest techniques cannot ameliorate an initial quality problem.
Quality varies from season to season and from region to region. Several studies have focused on identifying important preharvest factors affecting fruit quality. Water deficits can reduce fruit quality (Bower and Cutting 1987; Neuhaus et al. 2009), as
can excess irrigation or rainfall (Kruger et al. 1999; Pak et al. 2003b). Quality has
been strongly linked to fruit maturity (Dixon et al. 2003a; Dixon et al. 2003b; Dixon et al. 2004; Elmlsy et al. 2007; Kruger et al. 2001; Kruger et al. 2000; Kruger et al.
2002; Kruger et al. 2004; Pak and Dawes 2001; Pak et al. 2003a) while
environmental factors, cultural practices and rootstocks have also been implicated (Arpaia 2005a; Arpaia and Eaks 1990; Arpaia et al. 2004; Dixon et al. 2007; Elmlsy et al. 2007; Everett and Pak 2001; Kruger et al. 2008; Kruger et al. 2004; Mandemaker et al. 2006; McCarthy 2008; Thorp et al. 1995; Whiley et al. 1997; Woolf et al. 1999).
Over the past two decades, researchers have attempted to identify parameters that can be used as indicators of avocado quality. Considerable attention was given to fruit nutrient content but despite years of research no consensus has been reached. While some correlations were found between fruit quality and calcium levels (Everett
et al. 2007; Thorp et al. 1995; 1997) other studies have failed to verify this
relationship (Kruger et al. 2004). Some studies have found that nitrogen levels in fruit
were indicative of fruit quality (Kruger et al. 2001; Kruger et al. 2000; Kruger et al.
2008; Kruger et al. 2004), but others have failed to find similar correlations (Arpaia
and Eaks 1990). Everett and Pak (2002) attempted to predict shelf life by calculating the growth rate of the stem-end rot causal pathogen and by quantifying the inoculum pressure in the orchards prior to harvest (Everett et al. 2003). The method has not
been commercially adopted. It has been suggested that the quality of late season fruit may be predicted by assessing the fruits’ preharvest qualities (Lallu et al. 2005).
Lallu et al (2005) suggested that the pulp sugar content may serve as such an
indicator. Bertling and Bower (2005) and Burdon et al (2007) expanded on this
theory and suggested that C7 sugars may be an indicator of fruit postharvest quality but their theory has yet to be tested. Modern technologies such as near-infrared (Blakey et al. 2008), magnetic resonance imaging (Lallu et al. 2005) and ultrasound
(Mizrach 2000; Mizrach 2008; Mizrach et al. 1999; Mizrach et al. 1996) have been
suggested as potential methods of gauging fruit quality. However, none of the above studies have resulted in a reliable, simple indicator of fruit quality. This may be partly because fruit quality is influenced by many biotic and abiotic factors.
Since no simple quality indicator has been identified, it was proposed that a test be developed to predict end-use fruit quality in a domestic market and a long cold storage situation. It was proposed that fruit be sampled before the commercial harvest, ripened and then quality assessed. It was hoped that those fruit could predict the quality of the crop. In order for this test, referred to as the ‘Avotest’, to be commercially viable it had to be an accurate reflection of end-use commercial fruit quality, the test had to be easily executed, requiring minimal technology and expertise, and cheap. The Avotest would involve ripening fruit at a controlled
temperature, assessing the quality and verifying the resulting with that of fruit stored under simulated commercial conditions. The test would be conducted weeks before the start of the commercial harvest, giving growers sufficient time to take remedial action or make informed marketing decisions. Acceptable quality is difficult to define and is dependent on consumer preference, product availability and market price. A recent study conducted by Harker et al (2007) identified that, depending of the price,
consumers were willing to tolerate one fruit in ten with some internal damage as long as that damage did not exceed 10% of the fruits flesh. This was the quality
benchmark used in Avotest. Avotest was developed and tested over two seasons. In the first season, the Avotest was developed for domestic market fruit. In the second, the domestic market Avotest was verified and a long cold storage Avotest developed.
First Season
MATERIALS AND METHODS
Fruit samples
‘Hass’ fruit were used for the experiment since this variety represents over 75% of the Australian industry (Australian-Avocados-Limited 2008). Fruit were sampled from two blocks per farm on 10 farms (total of 20 blocks) in Bundaberg and Childers, central Queensland. The blocks had a range in management practices, soil type, tree ages, crop load and tree health. The blocks varied in size from several uniform hectares to less than one hectare. The farms included both small and large operations and were a good representation of the industry in the area.
Seventy fruit were taken per sampling occasion per block. From each block, two fruit were taken from each of 35 trees for each harvest. Fruit of similar size from the same position and aspect of the tree were used in order to achieve a uniform sample. The same 35 trees per block were sampled throughout the season. For each block and sampling, 10 fruit were used for dry matter (DM) testing and the rest of the fruit were used in the Avotest or commercial test.
Dry matter testing
At the laboratory, 10 fruit per block were peeled and the flesh grated. Dry matter was determined for a composite sample of the 10 fruit. Twenty grams of grated flesh was weighed and placed in a drying oven at 65oC till they reached stable mass. The dry matter was then calculated as a percentage of the original wet mass.
Domestic market Avotest
Fruit were harvested/sampled from orchards at 19% and 21% dry matter (DM), i.e. approximately eight to nine weeks, and four to five weeks respectively, before the predicted start of the commercial harvest. It is recommended that growers only harvest fruit once they achieve 24% dry matter although 21% dry matter is the accepted minimum maturity level in Australia. An additional sample was taken at 24% dry matter and used for comparative purposes only. The fruit were not treated with a postharvest fungicide or put through any commercial packshed treatments. Fruit were packed into avocado boxes and were ripened using 10-20 parts per million (ppm) ethylene for three days at 22C, then maintained at 22C till ripe.
A third of the sample, 20 fruit, was assessed two days before eat ripe (firmometer reading of 6.9±0.1), a third at eat ripe (firmometer reading of 8.7±0.1), and the remaining third two days post-eat ripe (firmometer reading of 9.7±0.1). According to experiments conducted in the Avocare Quality project (AV99007), 20 fruit is sufficient as a representative sample (Hofman et al. 2001). Both external and internal fruit
quality was assessed. External fruit disorders such as skin spots, discrete patches and external rot were rated during the pre-eat ripe assessment. Thereafter the skin colour darkened and external fruit assessments were no longer meaningful. Internal fruit disorders assessed included stem-end rots, body rots, vascular browning, seed cavity browning, diffuse discolouration and stones in the flesh. Flesh bruising was monitored but was not included in the analyses since it is thought to be a handling injury.
The severity of defects was assessed using a rating system of zero to three in accordance with the AvoCare Assessment Manual (White et al. 2001). On this scale,
0=no flesh defects, 1=up to 10% of the flesh with defects, 2=up to 25% and 3=more than 25% of the flesh affected. Fruit with a cumulative severity rating equal to or less than one i.e. ≤10% of the fruit pulp, was regarded as marketable. Internal flesh disorders and the incidence and severity of rots were the main parameters measured for fruit quality. Fruit were assessed individually.
Commercial simulation test
The quality of the fruit subjected to the Avotest at 19% and 21 % dry matter was compared with fruit from the same trees harvested at about 21% and 24% dry matter after simulated domestic handling. For the commercial test, fruit were harvested at 21% dry matter because this is the recommended minimum maturity for marketing avocado in Australia (Newett 2001) and at 24% dry matter since this closely reflects commercial reality.
The fruit were not placed over a commercial pack line but were immersed for 30 seconds in Prochloraz 450, 55ml/100L. The domestic commercial test, as developed in the Avocare Quality project (AV99007) (Hofman et al. 2001), comprised of:
3 days at 10oC
3 days at 5oC
10ppm# Ethylene for 2 days at 18oC
Store at 18oC till 2-3 days prior to eat ripe
2-3 days at 2oC
Ripen at 20oC
Fruit quality assessment
#part per million
The fruit were assessed as in the Avotest.
Statistical analysis
Correlations were developed between fruit quality after the Avotest and the commercial test. All results were statistically analysed using GenStat 11th Edition using the following analyses: analysis of variance at 95% confidence level, linear regression analyses, and simple correlations.
Production practices
Grower management data was collected for the blocks sampled. This included spray records, irrigation and fertigation data, block yields and pruning practices. The data were collected through individual grower interviews during the feedback sessions. Comparisons were made between fruit quality and production practices in an attempt to identify possible factors affecting quality.
Potential commercial use and cost benefit analysis
The commercial applicability of the Avotest was discussed with industry collaborators using open questions. Growers currently using library tray assessments were asked to compare the Avotest results with their current library tray practices/results.
Responses concerning the potential use of the Avotest were developed into likely scenarios. These scenarios were discussed with a key fruit marketer, avocado researcher and industry representatives to identify likely uses of the Avotest. These were then used for the benefit cost analysis.
RESULTS AND DISCUSSION
Domestic market Avotest and the commercial test
External fruit quality
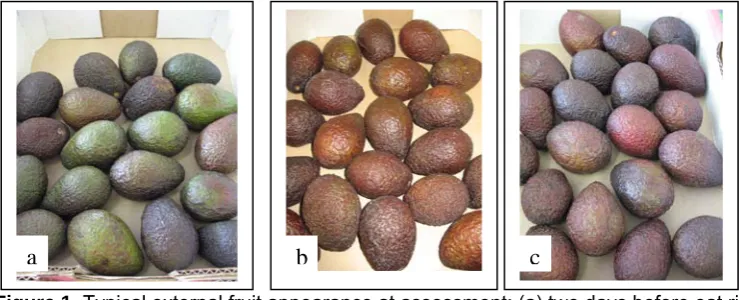
The fruit subjected to the Avotest and the commercial test ripened relatively evenly (Figure 1). The Avotest fruit ripened within seven days while the commercial test fruit ripened within 22 days. Very little, if any, shrivelling or mottled ripening was observed even for the fruit sampled at 19% dry matter.
The external fruit blemishes assessed included skin spots, discrete patches, and external rots. Physical damage to the skin, which can manifest as skin spots, is thought to be a potential entrance point for rots (Everett and Pak 2002; Pak et al.
2003b). In the pre-eat ripe fruit a positive relationship was found between the incidence of skin spots and the development of internal fruit rots (P=0.0004) and between the severity of skin spots and the severity of internal rots (P=0.05). Also, a highly significant relationship was found between external and internal fruit rots (P<0.0001).
Since ‘Hass’ fruit darken as they ripen, the external fruit defects were only assessed in the pre-eat ripe stage and were not emphasised. Also, much of the external fruit damage is believed to be caused by handling injuries. Since the fruit were not commercially handled, external fruit damage was not relevant. The focus of this study was on end-use internal quality.
Figure 1. Typical external fruit appearance at assessment; (a) two days before eat ripe; (b) at
eat ripe; (c) two days post-eat ripe.
a
a
b
c
Internal fruit quality
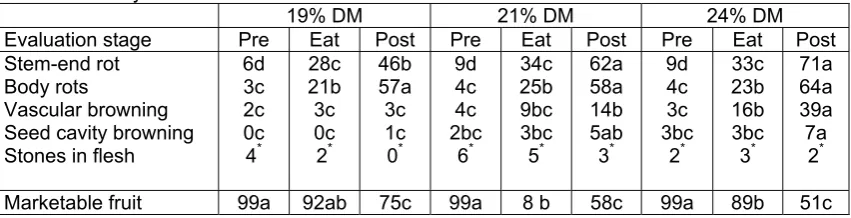
The average incidence of internal quality defects for the Avotest and commercial test fruit is shown in Tables 1 and 2.
Table 1. Average incidence (% affected fruit) of internal defects in Avotest fruit harvested at
19%, 21% and 24% dry matter and assessed at 2 days pre-eat ripe, at eat ripe and at 2 days post-eat ripe. Letters following the value indicates significant differences for individual defects.
* not statistically different.
19% DM 21% DM 24% DM
Evaluation stage Pre Eat Post Pre Eat Post Pre Eat Post Stem-end rot
Body rots
Vascular browning Seed cavity browning Stones in flesh
6d 3c 2c 0c 4* 28c 21b 3c 0c 2* 46b 57a 3c 1c 0* 9d 4c 4c 2bc 6* 34c 25b 9bc 3bc 5* 62a 58a 14b 5ab 3* 9d 4c 3c 3bc 2* 33c 23b 16b 3bc 3* 71a 64a 39a 7a 2*
Marketable fruit 99a 92ab 75c 99a 8 b 58c 99a 89b 51c
Table 2. Average incidence (% affected fruit) of internal defects in commercial test fruit
harvested at 21% and 24% dry matter and assessed at 2 days pre-eat ripe, at eat ripe and at 2 days post-eat ripe. Letters following the value indicates significant differences for individual defects.* not statistically different.
21% DM 24% DM Evaluation stage Pre Eat Post Pre Eat Post Stem-end rot
Body rots
Vascular browning Diffuse discolouration Seed cavity browning Stones in flesh
0c 18c 1d 0c 17* 5* 5bc 34b 29b 3c 20* 5* 12ab 51a 6 a 10bc 22* 4* 0c 19c 2d 4bc 16* 1* 4c 33bc 12cd 13ab 10* 3* 1a7 5a7 2bc0 22a 13* 5*
Marketable fruit 99a 93a 73b 98a 93a 72b
Fruit rots and vascular browning were the major defects factors in the fruit. In both tests the incidence of these defects increased as the fruit ripened. Vascular browning is thought to be closely associated with disease incidence (Everett and Pak 2002). The increase in rots as fruit ripen is well documented and is thought to be related to the level of antifungal diene (Prusky et al. 1990; Prusky et al. 1991). Avocados
contain antifungal agents in the skin called dienes which suppresses fungal spore germination and growth. As the fruit ripen, these antifungal agents break down, allowing quiescent spores to germinate or grow resulting in fruit rots (Prusky and Kaobiler 1992; Prusky et al. 1990; Prusky et al. 1991). Five days after harvesting
avocados, the level of diene in the fruit drop rapidly allowing quiescent infections to manifest (Prusky et al. 1990; Prusky et al. 1991).
The incidence of rots increased slightly with fruit maturity, i.e. from 19% - 24% dry matter (P<0.05, Tables 1 and 2). Previous studies have shown similar trends (Lallu et al. 2005; Pak 2001). This could be related to the antifungal diene levels and possibly
to the increased inoculum pressure imposed on ‘late’ hanging fruit. In some studies, diene levels in early fruit were higher than those in late season fruit (Prusky et al.
1990; Prusky et al. 1991). This could explain why the Avotest fruit at 19% dry matter
developed less rots than fruit at 24% dry matter.
Diffuse discolouration became more prominent in the commercial test fruit as they ripened. Diffuse discolouration is a symptom of chilling injury (Cutting and
Wolstenholme 1992) and was not observed in the Avotest fruit because the test did not involve cold storage. The incidence of seed cavity browning and stones in the fruit was high in some fruit lines but was not correlated to fruit ripeness or maturity (P>0.05). Stones in the flesh are due to preharvest insect damage (Joubert and Claasens 1994) and while this is valuable information for the grower the defect is not usually a major cause of fruit rejection.
Across all Avotest assessments:
33% of fruit had stem-end rots,
29% of fruit had body rots,
10% of fruit had vascular browning,
2.4% of fruit had seed cavity browning,
3% of fruit had stones.
Across all the commercial test tests:
35% of the fruit had body rots,
6.5% of the fruit had stem-end rots,
21% of the fruit had vascular browning,
17% of the fruit had seed cavity browning,
9% of the fruit had diffuse discolouration (grey pulp).
Some lines of fruit had more flesh bruising than others and appeared to be more susceptible to the defect. Eleven percent of the fruit in the commercial test had some bruising while very little bruising was observed in the Avotest fruit. This could be due to the higher fruit handling inputs in the commercial test.
The main cause of spoilage was stem-end rot in the Avotest fruit and body rots in the commercial test. Although the initial inoculum pressure at the time of harvest was not determined, it is apparent that the various fungi did not develop equally in the two tests. The various fungi have different optimum growth temperatures (Elmsly and Dixon 2008). Fifty percent of the spores of the main stem-end rot pathogen are killed after 14 days at temperatures below 5oC whereas the body rot spores are not
affected (Everett and Pak 2001). That could account for the comparably high levels of body rots in both the AvoTest and commercial test and the relatively low incidence of stem-end rot the commercial test fruit. Also, the fungicide used in the commercial test does not affect the stem-end rot and body rot organisms equally (Coates et al.
2008).
Marketable fruit
The Avotest was designed to be a rapid test to predict quality before the commercial harvest. Quality is difficult to define and is dependent on consumer tolerance, product supply and demand. Since Australian avocado consumers will not readily accept a fruit with more that 10% internal flesh defect (Harker et al. 2007), this was the
benchmark used in the present study. Fruit rots and vascular browning were the major internal defects observed in the Avotest and were used to gauge quality.
The average percentage marketable fruit, unmarketable fruit and the percentage of fruit with no internal rots or vascular browning, as determined through the two tests are shown in Figures 2 to 4.
0 10 20 30 40 50 60 70 80 90 100
Pre-eat ripe Eat ripe Post-eat ripe
P erc en tag e ma rk et ab le f ru it AT19% DM AT21% DM AT24% DM CS21% DM CS24% DM
Figure 2. Average percentage of marketable fruit (fruit with an internal defect severity < 1), as
determined in the Avotest and commercial test, for fruit assessed at pre-eat ripe, at eat ripe and post-eat ripe. AT = Avotest; CS = commercial simulation test; DM = dry matter. The lines above the bars indicate the standard error of the mean.
0 10 20 30 40 50 60
Pre-eat ripe Eat ripe Post-eat ripe
P e rc e nt a ge un m a rk e ta bl e f rui t AT19% DM AT21% DM AT24% DM CS21% DM CS24% DM
Figure 3. Average percentage of unmarketable fruit, (fruit with internal defect rating greater than 1), as determined in the Avotest and commercial test, for fruit assessed at pre-eat ripe, at eat ripe and post-eat ripe. AT = Avotest; CS = commercial simulation test; DM = dry matter. The lines above the bars indicate the standard error of the mean.
0 20 40 60 80 100
Pre-eat ripe Eat ripe Post-eat ripe
P
e
rc
en
ta
g
e
c
lea
n
fr
u
it
AT19% DM AT21% DM AT24% DM CS21% DM CS24% DM
Figure 4. Average percentage of fruit with no internal defects, as determined in the Avotest
and commercial test, for fruit assessed at pre-eat ripe, at eat ripe and post-eat ripe. AT = Avotest; CS = commercial simulation test; DM = dry matter. The lines above the bars indicate the standard error of the mean.
Figures 2 and 3 indicate that both tests produced similar fruit quality results especially in the pre- and eat ripe stages. At pre-eat ripe more the 95% of the fruit were marketable and at the ripe stage, marketability was about 90%. At the post ripe stage about 65% of the fruit were marketable. At this ripeness stage, the
marketability of the 21% and 24% dry matter Avotest fruit was significantly less than those of the other treatments (P=0.008). It can be speculated that this reduction in quality could be related to fruit maturity and the associated lower diene levels (Prusky
et al. 1990) reinforced by the absence of a postharvest fungicide treatment.
The variation in fruit quality between blocks sampled increased sharply as the fruit ripened (ref to standard error lines in Figures 2 to 4). This held true for fruit harvested at 19%, 21% and 24% dry matter for both tests. Some blocks produced fruit that maintained a high percentage of marketability as they ripened, while other blocks produced fruit that deteriorated rapidly. This was especially true for the fruit
harvested at 21% and 24% dry matter after the Avotest. Marketability varied from 10-90% between blocks at the post ripe stage, indicating large variation in potential fruit quality on the retail shelf depending on where and how the fruit were grown.
For the more discerning markets, a lower tolerance of rots would be expected (Harker et al. 2007). Figure 4 shows that the percentage of fruit with no internal
defects decreased as the fruit ripened, so that at the post ripe stage, about 25% of the fruit in the Avotest and 42% in the commercial test, had no defects. Once again, the variation between blocks was large and increased as the fruit ripened. Thus, some lines retained good fruit quality throughout the assessment period, while others deteriorated. This increasing divergence in defect incidence between blocks
suggests that fruit from the ‘good’ blocks either retain their resistance to pathogens or had less inoculum to begin with. It would be interesting to determine if the antifungal agent concentrations remain higher in these resistant fruit at ripe and post-eat ripe, compared with the less resistant fruit.
The differences in fruit quality between the two tests, especially at post-eat ripe could be influenced by the fungicide used in the commercial test (Coates et al. 2008), and
by the differences in fruit holding conditions (Everett 2001; Everett and Pak 2001).
Cold storage, as used in the commercial test, can reduce rots in ripe fruit, while higher temperatures, such as that used in the Avotest, can increase rots (Elmsly and Dixon 2008; Hopkirk et al. 1994). Furthermore, water loss in the early stages of fruit
ripening has been linked to rots (Dixon et al. 2005; Lallum et al. 2004; Yearsley et al.
2002a; b). According to Lallum et al. (2004) water loss increases respiration and
ethylene production which may contribute to the increased rots. Storage of fruit at higher temperatures, such as the Avotest fruit, will result in a higher respiration and water loss. This could further explain why the Avotest fruit had more disease than the commercial fruit. Ripening fruit at 20oC is a good predictor of both stem-end and body rots in commercial fruit (Everett 2001). In the present study, these rots affected 46% of the Avotest fruit and 39% of the commercial fruit. This indicates that Avotest may be a good predictor for rots in commercial consignments.
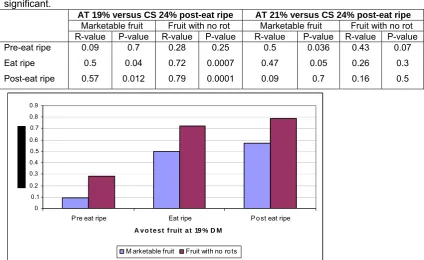
Correlation between Avotest and commercial test
The Avotest results were verified using the commercial test on a block-to-block bases. The analysis was carried out for two levels of severity; the percentage marketable fruit (rots rating ≤1) and fruit with no rots. Although the resulting fruit quality was similar for the two tests (especially in the pre-eat ripe and eat ripe assessment, Figures 2 to 4), the correlation between the two tests, as seen in a regression analysis (Table 3), was not consistently strong. This is partly due to the low incidence of rots in the pre- and eats ripe stages, and the natural variation in biological systems. The best correlation existed between the Avotest at 19% dry matter and the commercial test fruit at 24% dry matter (Figure 5; correlation values closer to 1 indicate a stronger relationship).
Table 3. Regression analyses between ‘Hass’ avocado fruit harvested at 19% and 21% dry
matter and subjected to the Avotest (AT) and those harvested at 24% dry matter and subjected to the commercial test (CS). The quality of fruit from the Avotest at each stage of assessment was compared to that of the commercial test at post-eat ripe assessment. R values closest to 1 are most significant and P values smaller than 0.05 are statistically significant.
AT 19% versus CS 24% post-eat ripe AT 21% versus CS 24% post-eat ripe
Marketable fruit Fruit with no rot Marketable fruit Fruit with no rot R-value P-value R-value P-value R-value P-value R-value P-value Pre-eat ripe Eat ripe Post-eat ripe 0.09 0.5 0.57 0.7 0.04 0.012 0.28 0.72 0.79 0.25 0.0007 0.0001 0.5 0.47 0.09 0.036 0.05 0.7 0.43 0.26 0.16 0.07 0.3 0.5 0 0.1 0.2 0.3 0.4 0.5 0.6 0.7 0.8 0.9
Pre eat ripe Eat ripe P ost eat ripe A v o t e s t f ruit a t 19 % D M
M arketable fruit Fruit with no rots
Figure 5. Regression analyses results used to indicate correlations. Correlation between
Avotest at 19% DM and commercial test at 24% DM. The quality of fruit from the Avotest at each stage of assessment was compared to that of the commercial test at post-eat ripe assessment.
After extensive analyses, the Avotest was found to best predict the post-eat ripe quality of fruit in the commercial test, mainly because of the elevated level of rots at this ripeness. Table 3, and Figure 5 represent the post-eat ripe assessment stage of the commercial test fruit. At 19% dry matter the correlation between the Avotest fruit and the commercial test fruit strengthens as the fruit ripens. Therefore, the Avotest conducted at 19% dry matter is well correlated to the post-eat ripe quality of 24% dry matter commercial fruit (r = 0.57 for marketable fruit and r = 0.79 for ‘clean’ fruit).
Predictive model
Based on the first season’s results a fruit quality model was developed using the 19% dry matter post-eat ripe Avotest fruit and the post-eat ripe 24% commercial test (Figure 6). The ‘percentage marketable/unmarketable fruit’ was used in the prediction model because this was thought to be a more commercially realistic quality target than fruit with no rots.
0 10 20 30 40 50 60 70 80 90 100
0 10 20 30 40 50 60 70 80 90 100
% marketable fruit - Avotest
%
m
a
rk
e
ta
b
le
fr
u
it
-C
S
Marketable
Unmarketable fruit False negative
False positive
r = 0.57
Figure 6. Percentage marketable fruit (rot level ≤ 1) for the Avotest fruit at 19% dry matter,
post-eat ripe assessment and the commercial simulation (CS) fruit at 24% dry matter. Each point on the graph represents a block sampled. Both x- and y-axes = percentage fruit with rot level ≤ 1.
Consumers’ intent to purchase decrease if more that one in ten fruit had more than 10% of the flesh with defects (Harker et al. 2007). However for the purpose of this
model two in ten fruit with more than 10% flesh defects was considered acceptable for the commercial test, i.e. 80% marketable fruit which correlated to approximately 78% marketable fruit in the Avotest. According to this model seven blocks produced fruit of marketable quality (top right sector of Figure 6) and eight blocks produced fruit of unmarketable quality (bottom left sector of Figure 6). The test produced three false negatives (top left sector of Figure 6), in that the Avotest suggested that the blocks were unacceptable, but the fruit were acceptable after commercial testing. The test also produced two false positives (bottom right sector of Figure 6), i.e. the Avotest incorrectly indicated that the blocks were acceptable. These results were verified using the block data as presented in Figure 7. Values above the horizontal line were regarded as unacceptable. The two false positive and three false negative values are indicated with the stars.
The model successfully predicted which blocks would provide fruit of acceptable quality after commercial distribution. Despite the relatively poor statistical correlation between the two tests (r=0.57), 75% of the blocks would have been correctly
categorized.
0 10 20 30 40 50 60 70 80 90
1A 1B 2A 2B 3A 3B 4A 4B 5A 5B 6A 6B 7A 7B 8A 8B 9A 9B 10A 10B
Blocks sampled
U
n
m
a
rk
e
ta
b
le
fr
u
it (
%
)
Figure 7. Average percentage unmarketable fruit for the Avotest (AT) at 19% dry matter and commercial simulation test (CS) at 24% dry matter assessed at 2 days post-eat ripe.
The standards used to determine market acceptability is fluid and will be determined by product demand, supply and consumer tolerance. In a season of under supply the poorer quality fruit may be acceptable to consumers while during periods of over supply consumer tolerance for poorer quality fruit could decrease.
Grower feedback
Growers were given feedback regarding their fruit quality and their position within the sample group. A typical collaborator feedback report is shown in Appendix 1.
Collaborators were surveyed to determine attitudes to the Avotest, the test’s possible uses in the industry and to determine cultural practices that may influence fruit quality. Responses were recorded on a questionnaire, (Appendix 2). Many of the collaborators responded with enthusiasm upon receiving evidence of their ripe fruit quality. They indicated that there was little or no feedback on internal quality from the markets for ‘Hass’ avocado. On the rare occasion where feedback was given, it concerned the external appearance at the pre-eat ripe stage. One of the strengths of the Avotest is its ability to provide growers with timely fruit quality feedback. The test provided growers with a new quantitative insight into commercial performance.
Influence of farm cultural practices on fruit quality
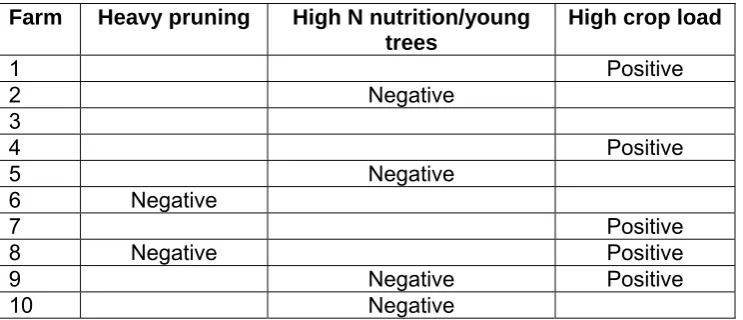
Possible reasons for differences in fruit quality between blocks from the same farm were discussed with collaborators, and cultural practices investigated. These are summarized in Table 4.
AT 19%-post-unmarketable CS 24%-post-unmarketable False positives
False negatives False positives
Table 4. The impact of certain farm practices on Avotest fruit quality as determined during the collaborator interviews.
Farm Heavy pruning High N nutrition/young
trees
High crop load
1 Positive
2 Negative
3
4 Positive
5 Negative
6 Negative
7 Positive
8 Negative Positive
9 Negative Positive
10 Negative
From the grower responses it appeared that crop load may have been one of the major influences on fruit internal quality. Although tree vigour was not physically measured for this study, it is likely to have also strongly influenced crop load. A strong relationship exists between high vegetative vigour and poor fruit quality
(Cutting and Bower 1992; Hofman et al. 2005; Hofman et al. 2002; Voster et al. 1989;
Witney et al. 1990a). Heavy pruning and high nitrogen nutrition application,
particularly on young trees, are likely to have contributed to excessive vegetative vigour. Heavy pruning can increase vegetative vigour, competing with fruit for nutrients, and reducing fruit quality (Arpaia 2005a; Arpaia et al. 2004).
High soil nitrogen concentrations can reduce fruit quality probably through increased vegetative vigour (Hofman et al. 2006; Witney et al. 1990b). In the present study the
negative impact of heavy pruning, high vegetative vigour and high nitrogen on fruit quality was confirmed. It became apparent during the interviews that growers are well aware of the research undertaken in pruning practices (Leonardi 2007; Leonardi 2008) and nutrition programs (Hofman et al. 2006) but they were unaware of the
effects these practices had on fruit quality. This may be because there is little quantitative evidence on which to base decisions or that the yield effect and cost of pruning have a much stronger influence on profitability than fruit quality. Given the lack of feedback on fruit quality from avocado handlers and an apparent poor relationship to price, the latter explanation is very likely.
The potential practical applications of the Avotest
Producers were asked their views on the potential commercial application of the Avotest. Four applications were proposed:
1. Avotest may be used to identify blocks which need remedial action to improve fruit quality, for example applying a systemic fungicide, e.g. Amistar®, to reduce fruit diseases. While this fungicide is commonly used on green skin cultivars, none of the co-operators interviewed had used Amistar® on ‘Hass’, despite a recent study supporting this practice (Coates et al. 2008). Since the Avotest is
conducted several weeks prior to commercial harvest, should the fruit quality prove to be inadequate, growers would have sufficient time to apply the fungicide and abide by the mandatory withholding period.
2. Avotest may be used to identify blocks which meet the rigid and high fruit quality requirements needed for export markets, discerning local markets or for long
3. Avotest may be used to identify individual farm practices which influence quality. The survey of collaborators found that there is virtually no market feedback to indicate internal quality. Avotestcould provide such feedback particularly where new farm practices are being trialled. Growers are keen to test new practices and products but often do not know how to evaluate the treatment benefits. Avotest may provide grower with an effective method of doing so.
4. Avotest may be used to distinguish between blocks with robust and poor fruit. The collaborators proposed that the blocks with robust fruit may be harvested when market prices are favourable, either early in the season or be allowed to hang fruit till later in the season, while the blocks with less robust fruit could be harvested when the dry matter is optimum. Numerous studies conducted in New Zealand have shown that as the fruit dry matter levels increase, so too does fruit quality (Dixon et al. 2003b; Pak and Dawes 2001; Pak et al. 2003a; Woolf et al.
1999). There is however an optimum dry matter beyond which the quality
deteriorates (Dixon et al. 2003a; Lallu et al. 2005; Mandemaker 2004; Pak 2001).
Optimum dry matter would probably vary from one region to the next and even from block to block. Thus, caution should be exercised if this option is to be considered.
Cost Benefit analysis of Avotest
The first three scenarios noted above were modelled to predict a cost benefit of the Avotest (Appendix 3). This was compiled by Joanna Embry, Agricultural Economist with Avocado Australia Limited. All benefit/cost calculations and the resulting benefit cost ratios are based on the assumptions provided by the project team, the
Queensland Department of Primary Industries and Fisheries and on recent published results, particularly in regard to disease control measures and consumer perceptions (Anderson et al. 2003; Coates et al. 2008; Harker et al. 2007). For each scenario a
benefit cost analysis was undertaken to determine likely benefit for consumers, industry and growers.
The assumptions and calculations used in these models are detailed in Appendix 3. In all three scenarios the benefit cost ratio ranged from 3.1:1 to 7.1:1. The benefit varies between growers, industry and consumers.
Benefits to consumers
In all scenarios, the avocado consumer benefits directly from the use of Avotest and subsequent action to improve quality, particularly when fruit purchase cost more than $2.00 each. At average consumption, the consumer benefits by $15 to $30 per year. This benefit may flow to other participants in the handling chain since the consumer is expected to purchases more fruit when they perceive quality to be better.
Benefits to industry
If Avotest was widely used in the central Queensland production area there would be a high benefit to cost return. This is due to the harsh consumer backlash against poor fruit described by Harker et al (2007). In this study, it was found that internal quality
had a greater influence on consumers than price. Improvements to internal fruit
quality will result in benefits as consumers will purchase more fruit even at higher prices.
Where the Avotest is used to indicate the need for a remedial action such as the application of a partially curative fungicide (Scenario 1) the benefit to cost ratio is 5.9:1.
Where the Avotest is used to identify high quality blocks suitable for a higher return market such as the export market (Scenario 2) the ratio is 3.1:1.
Where Avotest is used to provide feedback to avoid practices which adversely effect quality or to improve existing quality (scenario 3) the ratio is 7.1:1
If these scenarios are correctly adopted in the central Queensland region, there is likely to be a positive benefit cost result to the whole industry.
Benefit to grower
Due to a current inability of the supply chain to identify and reward superior lines of fruit, it has not been possible in this study to apportion a cost benefit to growers who plan to use Avotest. More than one co-operator in this study expressed exasperation at the lack of price incentive to improve quality. However, most growers did recognise the need for the whole industry to improve fruit performance so as to achieve
consumer satisfaction and repurchase. This inability to identify and reward superior fruit is largely because diseases and bruising in ‘Hass’ fruit are only detected at point of consumption.
In the long term it is likely that much of the benefit of meeting consumer expectations will be reflected in higher farm gate returns and brands delivering consumer value will be acknowledged with higher returns.
CONCLUSIONS
The Avotest carried out eight to nine weeks (at 19% dry matter) before commercial harvest can predict internal fruit quality after commercial distribution. The study found that co-operators valued the ability to predict end-use fruit quality and could indentify potential commercial applications for the Avotest. The test allows for remedial actions to ameliorate poor blocks and to make informed marketing decisions to take
advantage of superior blocks. Use of the test will have a reasonable benefit to cost ratio with both consumers and the industry beneficiaries.
Second Season
Based on the results of the first season’s experiments the method of fruit sampling and quality assessment were refined during the second season of testing. A long term cold storage Avotest was developed.
MATERIALS AND METHODS
Fruit samples
With the exception of two blocks, fruit were sampled from the same blocks in 2009 as in 2008 and an additional two blocks were sampled at a grower’s request. Fruit were taken from 22 blocks representing 11 farms in Bundaberg and Childers, central Queensland. Four of the blocks were had been used for orchard management experiments by the grower. Two of the blocks were part of an irrigation experiment and two were used in a foliar fertilizer experiment. Fruit were also sampled from eight blocks representing two farms in Mareeba, northern Queensland. One hundred fruit were harvested per sampling occasion per block, of which 10 fruit were used for dry matter (DM) testing, 45 fruit were assessed at eat ripe, and 45 two days post-eat ripe.
Unlike the 2008 season, the fruit were picked at random while walking on the diagonal across the block. Fruit were picked from all sides of the tree, including internal and externally hanging fruit but only similar size fruit were used.
Dry matter testing
Dry matter was determined for individual fruit and not for composite samples as in the first season’s experiment. Twenty grams of grated flesh was weighed out per fruit and placed in a drying oven at 65oC till they reached stable mass. The dry matter was then calculated as a percentage of the original wet mass. For each block the average dry matter and the dry matter range was noted.
Domestic market Avotest
Fruit were harvested from orchards about eight and four weeks before commercial harvest. Unlike the 2008 season, the fruit dry matter was not used to determine the harvest time. The same postharvest Avotest storage regime was used as in the first season.
Fruit quality was assessed at eat ripe and two days post-eat ripe. The same defect assessment procedure was used as in 2008 except that the severity of the internal defects was expressed as a percentage rather than a rating.
Domestic market commercial test
The quality of the fruit subjected to the Avotest at eight and four weeks pre-commercial harvest was compared with fruit from the same orchard at first
commercial harvest. The same postharvest handling and cold storage regime was followed as that of the commercial test in the first season. The fruit were assessed as in the Avotest and diffuse flesh discolouration (chilling injury) was included as a defect factor.
Development of a long term storage (export) Avotest
Since the domestic market Avotest did not involve cold storage, chilling injury could not be predicted. The aim of the long storage Avotest was to develop a test that could, in the shortest possible time, identify blocks that produced fruit with the potential to develop cold storage damage. In order to develop such a test two experiments were conducted.
Experiment 1
‘Hass’ fruit from an orchard in Northern Queensland were harvested about four weeks before commercial harvest. The fruit were treated with Prochloraz 450, packed in boxes and trucked to Bundaberg. The fruit were held at 6oC and treated with ethylene for one day (10-20ppm), and then held at 6oC for 1 , 2 or 3 weeks. Thereafter, the fruit were moved to a ripening room at 22oC and treated with ethylene for two day and held at that temperature until assessment. Fruit were assessed as in the domestic market commercial test.
Experiment 2
‘Hass’ fruit from an orchard in Bundaberg were harvested in April about four weeks before the commercial harvest and treated Prochloraz 450. The following treatments were applied:
1 day
2 days
3 days
6oC 8oC
6oC 8oC
6oC 8oC
1, 2 or 3 weeks 1, 2 or 3 weeks
1, 2 or 3 weeks 1, 2 or 3 weeks
1, 2 or 3 weeks 1, 2 or 3 weeks Storage time Storage temperature
21oC with ethylene for:
Following cold storage, the fruit were moved to a ripening room at 22oC, treated with ethylene for two day, then allowed to ripen at 22oC. Fruit were assessed at eat ripe and two days post-eat ripe.
Long term storage (export) Avotest
The regime used in this test was derived from the results of the two experiments noted above.
Fruit from the 11 collaborating farms in central Queensland were used for this Avotest. Fruit were harvested four weeks before the commercial harvest and treated with Prochloraz 450. Four weeks pre-commercial harvest was chosen since few growers would consider long storage of very early fruit. The fruit were placed at 6oC and treated with ethylene for one day (10-20ppm). The fruit were then held at 6oC for 21 days before being moved to a ripening room at 22oC and treated with ethylene for
two day. The fruit were allowed to ripen at 22oC and assessed as in the domestic commercial test.
Long term storage (export) commercial test
Fruit from the same orchards used in the long storage Avotest were sampled at first commercial harvest in May and subjected to a commercial test. The fruit were treated with Prochloraz 450 and stored under the following regime:
2 days at 6oC
24 days at 5oC
5 days at 10oC
1 day at 18oC with 10ppm ethylene
Ripen at 18oC
Fruit quality assessment
At eat ripe
2 days post-eat ripe
The fruit were assessed as in the Avotest.
Statistical analysis
The results of the ‘long storage Avotest experiments 1 and 2’ were analysed using GenStat 11th Edition using an analysis of variance at 95% confidence level.
Correlations were developed between fruit quality after the Avotest and the commercial test for both the domestic and long storage tests. All results were statistically analysed using GenStat 11th Edition using the following analyses: analysis of variance at 95% confidence level, linear regression analyses (r2), and simple correlations (r).
Grower feedback and production practices
Individual grower interviews were held during the feedback sessions. Grower opinion regarding their fruit quality and possible related farm practices were collected. Grower opinion on the commercial benefits of the Avotest was discussed.
RESULTS AND DISCUSSION
Domestic market Avotest
Avotest and the commercial test External fruit quality
Fruit ripened relatively evenly (Figure 8) with little shrivelling or variable ripening even eight weeks before the commercial harvest.
b
b
a
Figure 8. Typical external fruit appearance at assessment; (a) at eat ripe; (b) two days post-eat ripe, for fruit sampled 8 weeks pre-commercial harvest.
Internal fruit quality
The incidence of internal fruit defects in the four and eight week pre-commercial harvest Avotest and the commercial test are shown in Tables 5 and 6.
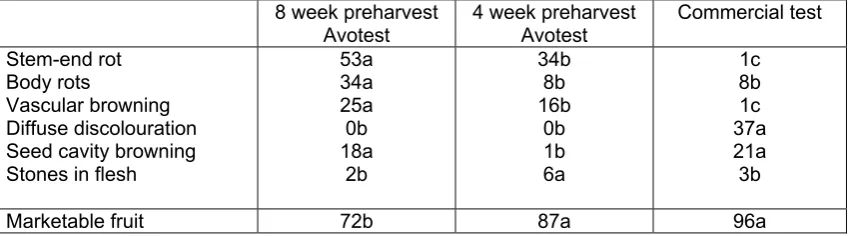
Table 5. The percentage of fruit (incidence) with defects at eat ripe, in the Avotest and
commercial test. Letters behind the values indicate significant differences for individual defects.
8 week preharvest
Avotest 4 week preharvest Avotest Commercial test Stem-end rot
Body rots
Vascular browning Diffuse discolouration Seed cavity browning Stones in flesh
53a 34a 25a 0b 18a
2b
34b 8b 16b
0b 1b 6a
1c 8b 1c 37a 21a 3b
Marketable fruit 72b 87a 96a
Table 6. The percentage of fruit (incidence) with defects at two days post-eat ripe, in the Avotest and commercial test. Letters behind the values indicate significant differences for individual defects.
8 week preharvest
Avotest 4 week preharvest Avotest Commercial test Stem-end rot
Body rots
Vascular browning Diffuse discolouration Seed cavity browning Stones in flesh
79 a 66 s 35 a 0 b 11 a
1 b
61 b 34 b 39 a 0 b 1 b 5 a
9 c 6 c 27 a 28 a 4 b 3 b
Marketable fruit 49 c 63 b 89 a
The incidence of rots decreased as the fruit matured, i.e. from eight weeks before commercial harvest to the commercial harvest (P<0.001). Also, rots were more common as the fruit ripen from eat ripe to two days post-eat ripe (P<0.001). The lower levels of rots in the commercial test fruit may be indicative of the efficacy of the postharvest fungicide or of the different ripening conditions used for the two tests.
Stem-end rot was the dominant cause of spoilage in the Avotest, although body rots were also a problem. In the commercial test, physiological disorders were the most prevalent. Some of the fruit lines did not develop any defects even at two days post ripe, while other lines deteriorated rapidly. This information could be of commercial value to retailers and market agents.
Diffuse discolouration was only seen in the commercial test since this defect is associated with prolonged storage (Cutting and Wolstenholme 1992) and the Avotest fruit were not cold stored. However, it has been suggested that fruit susceptible to diffuse discolouration may also be susceptible to vascular browning (Arpaia 2005b) and to rots (Everett and Pak 2002). If this is so, it may be possible that the Avotest could be an indicator of cold injury susceptibility. There was a strong correlation between the incidence of diffuse discolouration at eat ripe and vascular browning (r=0.989, r2=0.97, P<0.001) in the commercial test. The correlation between diffuse discolouration and rots was not as strong but significant (r=0.53, r2=0.28, P<0.001).
The Avotest was designed to rapidly predict quality of specific fruit lines before commercial harvest. Avotest is effective in detecting lines which are susceptible to rots and vascular browning which is a physiological defect often associated with rots (Everett and Pak 2002). Rots and vascular browning account for approximately 25-35% of defects in avocado fruit in the commercial markets, but the greatest reject factor is flesh bruising (Hofman and Ledger 2001). Therefore, Avotest can only account for a portion of flesh defects, which may be a limiting factor of this test.
Marketable fruit
The average percentage marketable fruit for the 2009 experiment season, is shown in Figure 9. A fruit was judged marketable if it had no more than 10% of its flesh affected by rots, vascular browning or diffuse discolouration.
0 10 20 30 40 50 60 70 80 90 100
Eat ripe post eat ripe
P er c en tag e m ar ket ab le f ru it
8w ks AT 4w ks AT CS
Figure 9. Average percentage of marketable fruit (fruit with an internal defect severity < 10%),
as determined in the Avotest and commercial test, for fruit assessed at eat ripe and post-eat ripe. AT = Avotest; CS = commercial simulation. The lines above the bars indicate the standard error of the mean.
Since the Avotest was designed to be an early warning system, growers should strive to produce fruit with as few rots as possible. Therefore, quality was also expressed as fruit with no internal defects, ‘clean fruit’ (Figure 10).
0 10 20 30 40 50 60 70 80
Eat ripe post eat ripe
P er cen tag e cl ean f ru it
8w ks AT 4w ks AT CS
Figure 10 Average percentage of fruit with no internal defects as determined in the Avotest
and commercial test, for fruit assessed at eat ripe and post-eat ripe. AT = Avotest; CS = commercial test. The lines above the bars indicate the standard error of the mean.
Fruit quality deteriorated rapidly as the fruit ripened (P<0.001, Figures 9 and 10). Similar trends were observed in 2008. This could, once again, be related to the antifungal diene which break down as the fruit ripen and thus allowing the
development of fungal pathogens (Prusky and Kaobiler 1992; Prusky et al. 1990;
Prusky et al. 1991).
Unlike in 2008, the percentage of clean and marketable fruit increased with fruit maturity (P<0.001, Figures 9 and 10). In some lines, the growers took heed of the
poor quality determined at 8 weeks preharvest and applied a curative fungicide. The resulting fruit quality seen at the 4 weeks preharvest Avotest was superior to all the other blocks tested. This is an example of the practical commercial value of the test.
Comparison of Domestic market Avotest fruit quality for 2008 and 2009
There was greater variability in fruit quality from one block to the next in 2009 than 2008 (Table 7). Quality in the 8 weeks preharvest Domestic Avotest was poorer in 2009 than in 2008. This could be an indication of higher inoculum pressure in the orchards in 2009, or fewer preharvest fungicide applications.
The fruit subjected to the 4 weeks preharvest domestic Avotest and the commercial test produced similar, if not slightly better fruit quality in 2009 than in 2008. As
mentioned previously, some collaborators applied remedial treatments to their blocks after receiving the results of the 8 weeks preharvest Avotest in 2009. As a result, this may have contributed to the improvement in fruit quality in the 4 weeks preharvest Avotest and the commercial test. Therefore, the 8 weeks preharvest Avotest was used in 2009 by some collaborators as a warning system.
Table 7. A comparison of the 2008 and 2009 fruit quality results as found in the 8 and 4
weeks preharvest Avotest and the commercial test. Letters following values indicate significant differences for each ripeness stage.
Marketable fruit (%)
Eat ripe Post-eat ripe
2008 2009 2008 2009
Avotest - 8 wks Avotest – 4 wks Commercial test
92y 88y 93y
72z 87y 96y
75bc 58de 72ab
4e 63cd
89a
‘Clean’ fruit (%)
Avotest - 8 wks Avotest – 4 wks Commercial test
63y 52y 66y
35z 57y 60y
32bc 21cd 39b
13d 28bc
54a
Growers A and F (Figure 11a-d) produced higher quality fruit in the 2009 than in 2008. Both of these growers increased the frequency of their preharvest fungicide applications in 2009 which could have contributed to improved quality. Due to financial constraints, growers B, C, D and E reduced the frequency of their
preharvest fungicide application in 2009 as is evident in the lower quality produced in 2009. The Avotest was able to identify these poorer blocks several weeks prior to the commercial harvest. This early warning system could be greatly beneficial to the growers, the industry and consumers.
0 20 40 60 80 100
A1 A2 B1 B2 C1 C2 D1 D2 E1 E2 F1 F2 G1 G2 H1 H2 K1 K2
Orchard codes M a rk e ta b le fr u it (% ) 2008 2009 0 20 40 60 80 100
A1 A2 B1 B2 C1 C2 D1 D2 E1 E2 F1 F2 G1 G2 H1 H2 K1 K2
Orchard codes M a rk e ta b le fr u it ) %( 2008 2009
a
b
0 20 40 60 80 100
A1 A2 B1 B2 C1 C2 D1 D2 E1 E2 F1 F2 G1 G2 H1 H2 K1 K2
Orchard codes M a rk et ab le f ru it ( % ) 2008 2009 0 20 40 60 80 100
A1 A2 B1 B2 C1 C2 D1 D2 E1 E2 F1 F2 G1 G2 H1 H2 K1 K2
Orchard codes M a rk et ab le f ru it ( % ) 2008 2009
c
d
Figure 11. Comparison of the percentage marketable fruit for the various blocks for the 2008
and 2009 season for (a) Avotest at 8 weeks preharvest assessed at eat ripe; (b) Avotest at 8 weeks preharvest assessed at two days post-eat ripe; (c) commercial test assessed at eat ripe; (d) commercial test assessed at two days post-eat ripe. The star indicates a missing data point. The x-axis represents the various blocks sampled.
Comparison of the Avotest and commercial test
The accuracy of predicting end-use quality was assessed by comparing the results of the Avotest to that of the commercial test on individual blocks. The analysis was carried out for two levels of severity; the percentage marketable fruit and the percentage clean fruit, i.e. fruit with no rots or physiological disorders.
In 2008 the Avotest carried out at 19% dry matter (approximately 8 weeks before harvest) and the commercial test produced comparable fruit quality results (Tables 1 and 2). This did not occur in 2009 but may not be a failing, as long as blocks which performed poorly in the Avotest also performed poorly in the commercial test. Some of the variability between the seasons could be due to changes made in the sampling and assessment method and by changes to farm management practices.
During the 2008 season a 60% correlation was found between the Avotest conducted at 19% dry matter and the commercial test. As with the 2008 results, in the 2009 season the best correlation was found between Avotest conducted 8 weeks pre-commercial harvest and the pre-commercial test. The 2009 correlation was statistically significant (P=0.008, r = 0.54) but the fit to the line was poor (r2 = 0.3). This weaker correlation could partly be due to the remedial fungicide sprays applied by some of the growers prior to the commercial harvest.
Predictive model
A fruit quality model was developed using the Avotest conducted