Summary of scallop
(Amusium japonicum balloti)
survey results: 1997–2006
Queensland
the Smart State
Fisheries
Long Term
Monitoring Program
Fisheries
Long Term
Monitoring Program
March 2008
Summary of scallop (Amusium
japonicum balloti) survey
results: 1997–2006
Department of Primary Industries and Fisheries Queensland
PR08-3519
This document may be cited as:
Jebreen, E., Whybird, O. and O’Sullivan, S. (2008) Fisheries Long Term Monitoring Program: Summary of scallop (Amusium japonicum balloti) survey results: 1997–2006. Department of Primary Industries and Fisheries, Brisbane, Australia.
Acknowledgements:
The dedication of the Long Term Monitoring Program team (south) members and other DPI&F staff involved in the survey are gratefully acknowledged. Thanks also to Michael O’Neill and George Leigh for help with data analyses. Malcolm Dunning, Akbar Prabowo, Len Olyott, Brooke Young and Nadia Engstrom assisted in the data, mapping, report production and review process.
General disclaimer:
The Department of Primary Industries and Fisheries (DPI&F) seeks to maximise the economic potential of Queensland’s primary industries on a sustainable basis.
This publication has been compiled by Fisheries, Assessment and Monitoring.
While every care has been taken in preparing this publication, the State of Queensland accepts no responsibility for decisions or actions taken as a result of any data, information, statement or advice, expressed or implied, contained in this report.
© The State of Queensland, Department of Primary Industries and Fisheries 2008
Copyright protects this material. Except as permitted by the Copyright Act 1968 (Cwlth), reproduction by any means (photocopying, electronic, mechanical, recording or otherwise), making available online, electronic transmission or other publication of this material is prohibited without the prior written permission of the Department of Primary Industries and Fisheries, Queensland.
Inquiries should be addressed to:
Intellectual Property and Commercialisation Unit Department of Primary Industries and Fisheries GPO Box 46
Brisbane Qld 4001
or
copyright@dpi.qld.gov.au
Contents
Contents i Acronyms ii Summary iii Long Term Monitoring Program background iv Introduction 1 Objectives 3 Methods 3 Sites 3
Phase 1: 1997-2000 3
Phase 2: 2001-2006 3
Times 5 Gear 5
Data Collection 5
Calibration 6 Data summaries and analysis 6 Mean catch rate of scallops per stratum per year 6
Data Limitations 7
Results and Discussion 8
Saucer scallops 8
Numbers measured (unstandardised) 8
Effect of gear changes 8
Vessel calibration 8
Length Frequency 9
Catch rate 9
Blue swimmer crab (Portunis pelagicus) 17
Length frequency 17
Catch rate (mean number per shot) 20 Moreton Bay bug (Thenus orientalis) 21
Length frequency 21
Catch rate 24
Syngnathids 25
Sea snakes 25
ii Fisheries Long Term Monitoring Program, Summary of scallop (Amusium japonicum balloti) survey results: (1997-2006)
Acronyms
0+ scallops younger than one year old 1+ scallops older than one year old
BHA Bustard Head scallop replenishment area A BHB Bustard Head scallop replenishment area B BHC Bustard Head scallop replenishment area C BHD Bustard Head scallop replenishment area D BRD bycatch reduction device
CFISH Commercial Fisheries Information System, DPI&F
DPI&F Department of Primary Industries and Fisheries, Queensland HBA Hervey Bay scallop replenishment area A
HBB Hervey Bay scallop replenishment area B HBC Hervey Bay scallop replenishment area C HBD Hervey Bay scallop replenishment area D LTMP Long Term Monitoring Program, DPI&F SOCI species of conservation interest
SRA scallop replenishment area TED turtle exclusion device
YA Yeppoon scallop replenishment area A YB Yeppoon scallop replenishment area B
Summary
In Queensland, saucer scallops (Amusium japonicum balloti) are a target or principal species in the east coast otter trawl fishery. The fishery operates from about 20o S to the New South Wales border. The fishery is currently managed by a series of input and output controls, including spatial and temporal closures, effort and gear regulation and minimum size limits. In 2006, the annual Queensland saucer scallop harvest was estimated at 504 tonnes (CFISH database June 2007). Decreasing total catch and catch rates combined with consistently high effort from 1993 until 1996, raised concern amongst fishers and fisheries managers regarding the sustainability of the stock. A precautionary management approach led to the creation in 1997 of scallop replenishment areas, three areas closed to fishing in the Yeppoon, Bustard Head and Hervey Bay regions. In 2001, these scallop replenishment areas were expanded and opened to fishing according to a rotational harvest strategy. The objective was to allow fishers access to the high densities of post spawning scallops that develop within the replenishment areas. The current rotational strategy allows for a 9 month fishing period, followed by a 15 month closure.
Since 1997, the Department of Primary Industries and Fisheries has carried out an annual scallop survey. In its initial phase this survey was a pre-recruitment survey. The objectives were to provide a long-term data series that when combined with existing fishery monitoring programs and historical data would assist in the assessment of the resource status and contribute to assessment of the performance of management strategies. The objectives of the survey were revised in 2001 corresponding with the introduction of a rotational harvest strategy for the scallop replenishment areas. Current objectives focus on assessing the performance of the rotational harvest strategy.
Standardisation of scallop survey catch rates allows data from 1997 to 2006 to be directly compared. This report presents mean scallop catch rates rather than scallop abundance. Numbers and length frequencies of Moreton Bay bugs and blue swimmer crabs are also reported.
Lows in scallop catch rates were seen in 2002 and 2003 and 2005. In 2004 both age classes
monitored were relatively strong. The 2006 increase in numbers was largely due to increased catch of scallops older than one year old (1+). Blue swimmer crabs were also caught in low numbers in 2005.
iv Fisheries Long Term Monitoring Program, Summary of scallop (Amusium japonicum balloti) survey results: (1997-2006)
Long Term Monitoring Program background
The Department of Primary Industries and Fisheries (DPI&F), Queensland, manages the State’s fish, mollusc and crustacean species and their habitats. As part of this commitment, DPI&F monitors the condition of, and trends in, fish populations and their associated habitats. This information is used to assess the effectiveness of fisheries management strategies and helps ensure that the fisheries remain ecologically sustainable.
DPI&F uses the information to demonstrate that Queensland’s fisheries comply with national sustainability guidelines, allowing exemption from export restrictions under the Australian Government’s Environment Protection and Biodiversity Conservation Act 1999.
DPI&F initiated a statewide Long Term Monitoring Program (LTMP) in 1999, in response to a need for enhanced data used in assessment of Queensland’s fisheries resources. The LTMP is managed centrally by a steering committee with operational aspects of the program managed regionally from the Southern and Northern Fisheries Centres located at Deception Bay and Cairns respectively. The regional teams are responsible for organising and undertaking the collection of data used for monitoring key commercial and recreational species, and for preparing data summaries and preliminary resource assessments.
A series of stock assessment workshops in 1998 identified the species to include in the LTMP. The workshops used several criteria to evaluate suitability including:
• the need for stock assessment
• the suitability of existing datasets
• the existence of agreed indicators of resource status
• the practical capacity to collect suitable data.
Resources monitored in the program include saucer scallops, spanner crabs, stout whiting, yellowfin bream, sand whiting, dusky flathead, rocky reef fish, eastern king prawns, blue swimmer crabs, sea mullet and tailor in southern Queensland; tiger and endeavour prawns and coral trout and redthroat emperor in northern Queensland; and mud crabs, barramundi, spotted and Spanish mackerel and freshwater fish throughout the state. Various sampling methods are used to study each species.
The LTMP collects data for resource assessment (ranging from analyses of trends in stock abundance indices to more complex, quantitative stock assessments) and management strategy evaluations.
Stock assessment models have already been developed for saucer scallops, spanner crabs, stout whiting, mullet, tailor, barramundi, tiger and endeavour prawns, redthroat emperor, and spotted and Spanish mackerel. In some cases management strategy evaluations have also been completed and the data collected in the LTMP proved integral to these activities.
The assessments and evaluations have allowed for improvements to the management of
Queensland’s fisheries resources. Enhancements to ongoing monitoring have also been identified, particularly to address the increasing demand for high quality data for dynamic fish population models.
Introduction
The saucer scallop (Amusium japonicum balloti) is present off Queensland and New South Wales, from Innisfail to Jervis Bay. In Queensland, this species spawns from May to September, becoming sexually mature after 12 months. It has a fast growth rate obtaining a shell height of 90–95 mm within 6 to 12 months of settlement when they are recruited into the fishery. Natural mortality is high with few scallops surviving three to four years even if remaining unfished (Kailola et al. 1993). The short spawning season normally results in a large proportion of scallops reaching harvestable size between November and March (summer to autumn) (Jebreen et al. 2003).
Saucer scallops are a significant component of the Queensland East Coast Trawl Fishery. As this species is capable of swimming, commercial fishers target this species using otter trawls, unlike other species of scallops which can be harvested by dredges (Kailola et al. 1993). In 2006, the annual Queensland saucer scallop harvest was estimated at 504 tonnes (CFISH database June 2007).
Record low scallop catches in 1996–1997 caused concern amongst fishers and fisheries managers. A precautionary management approach prompted the formation in 1997 of three scallop replenishment areas (SRAs), which were closed to fishing. The SRAs were located in historically highly productive areas in the Yeppoon, Bustard Head and Hervey Bay regions (Figure 1). Their closure was designed as a means of maintaining spawning stock levels for the following winter spawning season. The initial two month closure (Fisheries (Emergency Closed Waters) Declaration 1997) was extended through changes to the Fisheries Regulation 1995, as a closed waters provision. In March 1998 the boundaries of the Yeppoon closure were altered (Figure 1).
The Fisheries (East Coast Trawl) Management Plan 1999 consolidated the management of the trawl fishery. Under the Plan the scallop fishery is regulated by spatial and temporal closures as well as size limits including:
• An annual southern trawl closure (from 2000) from south of Mackay to the Queensland – New South Wales border from 20 September to 1 November each year.
• Scallop size limits
o 2000–2001 –– 90 mm from January to April and 95 mm from May to December
o 2004–2006 –– 90 mm from November to April and 95 mm May to October.
2 Fisheries Long Term Monitoring Program, Summary of scallop (Amusium japonicum balloti) survey results: (1997-2006)
Figure 1. Scallop replenishment areas (SRAs) from 1997–2001, 2001–2003 and 2003–current (Fisheries (Emergency Closed Waters) Declaration 1997; Fisheries Regulation 1995; Fisheries (East Coast Trawl) Management Plan 1999).
2003–current 2001–2003
Objectives
Phase 1 – 1997 to 2000
To provide long-term data within Queensland’s main scallop grounds on:
• the relative abundance and size structure of scallops, Moreton Bay bugs and blue swimmer crabs, and
• the incidence of interaction between trawl gear and species of conservation interest (SOCI). Phase 2 – 2001 to current
To collect data for:
• evaluation of the performance of the rotational harvest strategy being applied to fishing effort in the scallop replenishment areas,
and on:
• the relative abundance and size structure of scallops, Moreton Bay bugs and blue swimmer crabs,
• the incidence of interaction between trawl gear and SOCI, and
• to quantify the effects of turtle exclusion devices (TEDs) and bycatch reduction devices (BRDs) on scallop catch rate (to 2004 only).
Methods
Sites
Phase 1: 1997-2000
Survey sites (n > 400) were selected from the CFISH grid system, to cover the main scallop grounds and within SRAs off Yeppoon, Bustard Head and Hervey Bay (Figure 2). Survey sites were arranged into strata named after the closest corresponding CFISH grid1 . Survey effort was allocated by stratified random distribution based on levels of commercial catch and effort in each of the survey strata. The number of trawls per stratum were weighted by the CFISH grid mean catch from 1988 onwards, catch per unit effort from previous surveys or from the surrounding CFISH grid. Extra trawls were added to strata if the number of proposed trawls represented less than 2% of the total sampling effort. Where sites could not be surveyed due to unsuitable site characteristics, replacement sites were chosen from a list of additional random sites within that stratum. In 2000, weighting was based on the combined effect of area multiplied by the catch per unit effort and the previous surveys densities of scallops younger than one year old (0+).
Phase 2: 2001-2006
In 2001 the number of survey sites was halved (n = 200) (Figure 2). Survey sites were randomly chosen and restricted to within the SRAs and the T30 stratum.
1
Figure 2. Survey strata and scallop replenishment areas off the coast of Queensland Phase 1 (1997-2000) and Phase 2 (2001-2006). Phase 2
4 Fisheries Long Term Monitoring Program, Summary of scallop (Amusium japonicum balloti) survey results: (1997-2006)
Times
Surveys took place in October during the southern trawl closure and prior to the peak fishing period in November. Surveys were conducted in periods between the new and full moon, centering on neap tides, to minimise the effects of tidal flow on scallop catchability.
Gear
From 1997 to 2000, four commercial trawlers were chartered. Since 2001, two vessels have been involved in the survey, one with triple gear and the other with a five net configuration. Standard 2¼ inch (57 mm) prawn trawl nets were used, to maximise the catch of pre-recruit scallops.
In 2001, a top shooting, standard grid TED and Fisheye and Bigeye type BRDs were added to the survey gear. The effect of these devices on scallop catch rate was investigated by incorporating them to the gear in a randomised block design. They were rotated between port and starboard outer nets, but not added to the middle nets.
Data Collection
A single trawl of 20 minutes was carried out at each survey site. Shot characteristics were recorded, including start and end latitude and longitude, distance of trawl, bearing, depth, water temperature (surface and bottom), tide direction, trawl duration, substrate type and net configuration. Additional comments were recorded regarding factors that may have influenced the swept area or efficiency of a particular trawl e.g. nets choked with weed or nets dredging.
At each survey site, the outside nets were sorted separately to middle nets. All scallops were counted and sub-samples of approximately 200 individuals from each site were measured. Shell height was measured as the maximum vertical distance, from the hinge (base) to the highest point. It is important to note that these measurements do not equate to the commercial measure2 of scallop size.
Blue swimmer crabs were recorded since 1997 and Moreton Bay bugs since 1998. These by-product species from all nets were counted, those caught in the outside nets were also sexed and measured (blue swimmer crabs carapace width3; Moreton Bay bugs carapace length4) (DPI&F In Prep.). From 2006 onwards, sex for crabs and bugs are recorded as either males or females but no reproductive condition was recorded.
In 2000 and 2002, sub-samples of benthic species were collected, Barker et al. (2004) describes the benthic faunal composition of the scallop fishing grounds.
More detailed methodologies are documented in the Long Term Monitoring Program Sampling Protocol: Scallop (DPI&F 2005).
2
Commercial measure = maximum diameter. Courtney et al. (2003) provides a conversion equation:
where SH is shell height, CM is commercial measure, estimate of a is -0.4516, estimate of b is
0.9789.
bCM a SH = +
3
Carapace width = distance between notch at the base of the largest opercular spine and the notch at the base of the opposite spine
4
6 Fisheries Long Term Monitoring Program, Summary of scallop (Amusium japonicum balloti) survey results: (1997-2006) Calibration
During Phase 1, calibration shots were not conducted at survey locations. Four vessels worked side by side in areas of known high scallop density during the day for 20 sites or at least two days’ work. During Phase 2, calibration shots were undertaken at survey locations. Two vessels worked side by side for the first two nights of the survey at randomly chosen survey sites. Sites included know areas of both low and high scallop catch rates. After calibration shots were completed, the remaining sites were sampled over the following six nights.
Data summaries and analysis
Survey sites from all survey years (1997-2006) were allotted to survey strata. These strata were based on the ten SRAs, as they existed in 2001 in their finest divisions (YA, YB, BHA, BHB, BHC, BHD, HBA, HBB, HBC, HBD) (Figure 2). By-product catch results for survey strata that have not been sampled since Phase 1 (S28, S29, T28, T29, U30, U31, V31, V32) are not fully presented in this report. These results are available in O’Sullivan et al. (2005).
The frequency distribution of scallop shell height is typically bimodal with the separation between the modes at approximately 78 mm, this is utilised to assign scallops to age classes (O’Sullivan et al.
2005). The age classes were: scallops younger than one year old (0+) less than or equal to 78 mm and scallops older than one year old (1+) greater than 78 mm. It is important to note that 0+ scallops refer to a single age class while 1+ scallop refers to multiple age classes.
Mean catch rate of scallops per stratum per year
To estimate mean catch rate of scallops, catches for each stratum for each survey year needed to be standardised. Standardisation was necessary due to changes in gear (TEDs and BRDs) and vessels that occurred through time.
Gear changes
The 2001 TED and BRD experiment data from this survey was analysed by O’Sullivan et al. (2005) using a generalised linear model. The main effects in the model were site, vessel and presence or absence of TED and BRD, with trawl duration as an offset, trawl speed as a covariate and numbers of scallops caught as the response variable. The parameter estimate for TED and BRD was used to calculate the proportion of the effect of the inclusion of the TED and BRDs on the total catch of scallops.
Vessel calibration
The relative fishing efficiencies of the different vessels were calculated as per O’Sullivan et al. (2005). The components considered were:
• different vessels and year
Mean scallop catch rates
As per O’Sullivan et al. (2005) a generalised linear model was also used to standardise mean scallop catch rates. Year and survey stratum were the main effects, the number of scallops caught were the main response variables. Fishing power coefficient and trawl duration were offsets and trawl speed was used as a covariate.
Observed catches per shot and cohort were standardised to a constant vessel that trawled for 20 minutes at 2.46 knots, so as to reflect constant trawling conditions across all of the survey years:
yi yi yi c f cˆ =
where fyi was a function for the relative trawl fishing power adjustment in each survey year y for each
trawl i, c was the observed number of scallops caught, and was the adjusted number of scallops caught. The fishing power function fyi adjusted catches for a constant vessel, trawl time, and trawl
speed:
cˆ
( ) ( )
( k k)
v yi
e yi e
e
t
f
f
1.268log log20
1
− −=
where was the fishing power for each individual vessel, was trawl time (minutes), was the trawl speed (knots),
v
f t k
k was the average trawl speed (reference speed of 2.46 knots).
Data Limitations
In interpreting the results in this report, the following factors need to be considered:
• Survey trawl gear is not the same as commercial scallop trawl gear. Therefore, no direct comparison can be made between commercial and survey catch rates, and all comparisons should be relative i.e. a site does not necessarily yield large or small catches, rather it was larger or smaller than another site.
8 Fisheries Long Term Monitoring Program, Summary of scallop (Amusium japonicum balloti) survey results: (1997-2006)
Results and Discussion
Saucer scallops
Numbers measured (unstandardised)
The number of scallops caught in phase 1 and 2 should not be compared due to the changes in sampling area and effort. During 2001, 2004 and 2006 the total numbers of scallops caught was higher than other years compared to the sampling effort (Table 1).
Table 1. Numbers of scallops measured and total number caught per year. (Note: survey reduced in area from 2001 onwards).
Year No. of sites No. measured Total no. caught 1997 397 47 549 103 923 1998 398 53 872 132 920 1999 534 44 537 116 121 2000 336 45 605 148 725 2001 158 25 594 150 014 2002 189 19 751 58 653 2003 176 23 042 59 613 2004 172 23 134 116 178 2005 170 19 106 44 379 2006 166 25 369 84 680
Effect of gear changes
There was a 13.7% (± 1.6% SE) reduction in the total numbers of scallops caught when TEDs and BRDs were added to the survey trawl nets (O’Sullivan et al. 2005). This reduction was averaged across all scallop size classes. As the survey uses prawn trawl mesh, this result is not comparable with a commercial scallop fishing operation.
Vessel calibration
In analysing the different fishing vessel efficiencies both the participation of different vessels over the years and the different combinations of gear were considered. The mean response variable (numbers of scallops caught) was predicted for all the different levels of gear effect. These predicted amounts were expressed as a proportion of the standard vessel, which was involved in every survey since 1997 (Table 2).
Table 2. Range in parameters incorporating differences in gear for all vessels (n = 24) across all survey years.
Survey years Effect of TED/BRD (min – max)
Gear correction (min – max)
Fishery efficiency (min – max)
1997-2000 NA 1.00 0.57-1.56
Length Frequency
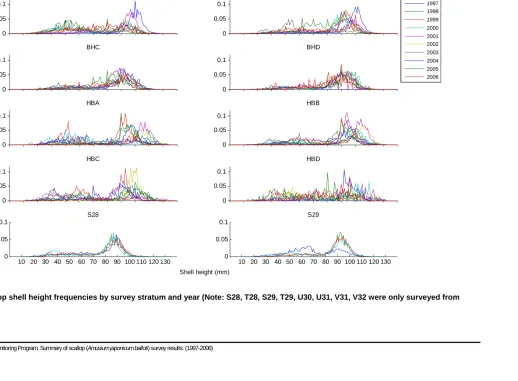
Scallop length frequencies are provided for every stratum for each year (Figure 3). The low number of scallops between 70 and 80 mm (approximately 78 mm) is considered to indicate the separation between the 0+ and 1+ age classes (O’Sullivan et al. 2005). The smallest scallop shell height measured was 14 mm and the largest was 128 mm.
The commercial size limit of 90 mm is equal to a shell height of approximately 88 mm (Courtney et al. 2003). Length frequencies revealed variation between regions and years. (Figure 3).
Catch rate
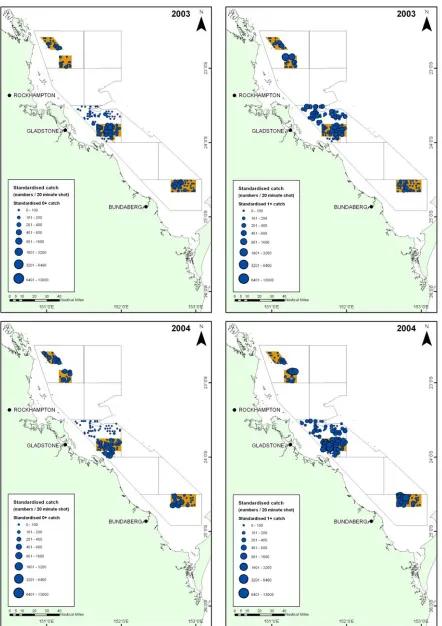
Maps of standardised observed survey catch rates (number of scallops per 20 minute shot) from each year provided visual presentations of spatial and temporal trends (Figure 4). Some of the key spatial and temporal observations were:
• In 1997 higher catch rates of 1+ scallops were seen compared with 0+ scallops.
• In 1998 there was an increase in catch rates of 1+ scallops throughout the scallop grounds, especially in the central Bustard Head and Hervey Bay closures.
• In 1999 there was a marked increase in catch rates of 0+ scallops within the Hervey Bay closures.
• In 2000 there was an increase in catch rates of both 0+ and 1+ scallops within all closures
• In 2001 0+ scallops seemed to have benefited from the closures in Yeppoon and Bustard Head, catch rates of 1+ scallops were high in across all closures.
• From 2002 to 2003 highest catch rates were seen in the Bustard Head closures. The north-western part of the Yeppoon closure and the south-eastern part of the Hervey Bay closures remained devoid of scallops.
• In 2004 there were high catch rates of both cohorts of scallops. The south-eastern part of the Hervey Bay closures remained virtually devoid of scallops.
• 2005 had the lowest number of scallops caught of any survey year. This decrease was particularly evident in the BHA and BHB closures for 1+ scallops.
• In 2006, catch rates of 0+ scallops were low, catch rates of 1+ scallops were highest in the Yeppoon and Hervey Bay closures.
0 0.05 0.1
BHA
1997 1998 1999 2000 2001 2002 2003 2004 2005 2006
0 0.05 0.1
BHB
0 0.05 0.1
BHC
0 0.05 0.1
BHD
0 0.05 0.1
HBA
0 0.05 0.1
HBB
0 0.05 0.1
HBC
0 0.05 0.1
HBD
10 20 30 40 50 60 70 80 90 100 110 120 130 0
0.05 0.1
P
rop
or
ti
on
S28
10 20 30 40 50 60 70 80 90 100 110 120 130 0
0.05 0.1
Shell height (mm)
S29
Figure 3. Scallop shell height frequencies by survey stratum and year (Note: S28, T28, S29, T29, U30, U31, V31, V32 were only surveyed from 1997–2000).
0 0.05 0.1
T28
1997 1998 1999 2000 2001 2002 2003 2004 2005 2006
0 0.05 0.1
T29
0 0.05 0.1
T30
0 0.05 0.1
U30
0 0.05 0.1
U31
0 0.05 0.1
V31
0 0.05 0.1
V32
10 20 30 40 50 60 70 80 90 100 110 120 130 0
0.05 0.1
Shell height (mm) YA
10 20 30 40 50 60 70 80 90 100 110 120 130 0
0.1 0.2
Shell height (mm)
P
ropo
rt
io
n
YB
Figure 4. Standardised scallop catch rates (number/20 minute shot) per age class, survey site and year (0+ are scallops younger than one year old; 1+ are scallops older than one year old).
Figure 4 (continued). Standardised scallop catch rates (number/20 minute shot) per age class, survey site and year (0+ are scallops younger than one year old; 1+ are scallops older than one year old).
Figure 4 (continued). Standardised scallop catch rates (number/20 minute shot) per age class, survey site and year (0+ are scallops younger than one year old; 1+ are scallops older than one year old).
Blue swimmer crab (Portunis pelagicus)
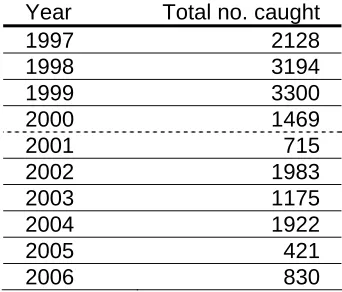
The numbers of blue swimmer crabs remained relatively constant from 1997 to 1999. Results from Phase 2 surveys (from 2001 to 2006) are from a reduced survey effort and area, during these years high numbers of blue swimmer crabs were caught in 2002, 2003 and 2004. In 2006, there was an increase in numbers caught compared with 2005 (Table 3).
Table 3. Total numbers of blue swimmer crabs captured by survey year (Note: survey reduced in area from 2001 onwards).
Year Total no. caught
1997 2128 1998 3194 1999 3300 2000 1469 2001 715 2002 1983 2003 1175 2004 1922 2005 421 2006 830
Length frequency
YA M = 38
F = 11
0 10 20 30 40 50-59 60-69 70-79 80-89 90-99 10 0-109 11 0-119 12 0-129 13 0-139 14 0-149 15 0-159 16 0-169 17 0-179 18 0-189 19 0-199 20 0-210 BHA M = 201 F = 176
0 10 20 30 40 50-59 60-69 70-79 80-89 90-99 100-109 110-119 120-129 130-139 140-149 150-159 160-169 170-179 180-189 190-199 200-210 BHB M = 71
F = 83
0 10 20 30 40 50-59 60-69 70-79 80-89 90-99 100-109 110-119 120-129 130-139 140-149 150-159 160-169 170-179 180-189 190-199 200-210 BHC M = 105
F = 39
0 10 20 30 40 50-59 60-69 70-79 80-89 90-99 100-109 110-119 120-129 130-139 140-149 150-159 160-169 170-179 180-189 190-199 200-210 BHD M = 63
F = 66
0 10 20 30 40 50-59 60-69 70-79 80-89 90-99 100-1 09 110-1 19 120-1 29 130-1 39 140-1 49 150-1 59 160-1 69 170-1 79 180-1 89 190-1 99 200-2 10 Females Male YB
M = 146 F = 103
0 10 20 30 40 50-59 60-69 70-79 80-89 90-99 100-109 110-119 120-129 130-139 140-149 150-159 160-169 170-179 180-189 190-199 200-210 F req u e n cy (% )
Carapace width (mm)
Figure 5. Size frequency of blue swimmer crab by sex and grid for all years combined. Note: eight crabs were caught under 50 mm carapace width, these animals have not been shown. Grids only surveyed in Phase 1 of the survey are not shown.
igure 5 (continued). Size frequency of blue swimmer crab by sex and grid for all years
ve not
HBA M = 198
F = 248
0 10 20 30 40 50-59 60-69 70-79 80-89 90-99 10 0-109 11 0-119 12 0-129 13 0-139 14 0-149 15 0-159 16 0-169 17 0-179 18 0-189 19 0-199 20 0-210 HBB M = 291
F = 307
0 10 20 30 40 50 -5 9 60 -6 9 70 -7 9 80 -8 9 90 -9 9 100 -1 09 110 -1 19 120 -1 29 130 -1 39 140 -1 49 150 -1 59 160 -1 69 170 -1 79 180 -1 89 190 -1 99 200 -2 10 HBC M = 723 F = 1030
0 10 20 30 40 50 -5 9 60 -6 9 70 -7 9 80 -8 9 90 -9 9 100-109 110-119 120-129 130-139 140-149 150-159 160-169 170-179 180-189 190-199 200-210 HBD M = 729 F = 1071
0 10 20 30 40 50-59 60-69 70-79 80-89 90-99 100-109 110-119 120-129 130-139 140-149 150-159 160-169 170-179 180-189 190-199 200-210 T30 M = 776
F = 682
0 10 20 30 40 50-59 60-69 70-79 80-89 90-99 1 00-109 1 10-119 1 20-129 1 30-139 1 40-149 1 50-159 1 60-169 1 70-179 1 80-189 1 90-199 2 00-210 Females Males F re q ue nc y ( % )
Carapace width (mm)
F
Catch rate (mean number per shot)
Mean number of blue swimmer crabs per shot (from all nets) are unstandardised. They were more abundant in the Hervey Bay closures exhibiting the highest mean in most years in HBD (Figure 6). In 2005, berried females were only caught in YB, T30, HBC, and HBD and only in low numbers. Blue swimmer crab data presented has not been standardised.
YA 0 4 8 12 16 20 1
997 1998 1999 2000 2001 2002 2003 2004 2005 2006
YB 0 4 8 12 16 20 199 7 199 8 199 9 200 0 200 1 200 2 200 3 200 4 200 5 200 6 BHA 0 4 8 12 16 20 199 7 199 8 199 9 200 0 200 1 200 2 200 3 200 4 200 5 200 6 BHB 0 4 8 12 16 20 1
997 1998 1999 2000 2001 2002 2003 2004 2005 2006
BHD 0 4 8 12 16 20 199 7 199 8 199 9 200 0 200 1 200 2 200 3 200 4 200 5 200 6 BHC 0 4 8 12 16 20 1
997 1998 1999 2000 2001 2002 2003 2004 2005 2006
HBA 0 4 8 12 16 20
1997 1998 1999 2000 2001 2002 2003 2004 2005 2006
HBB 0 4 8 12 16 20
1997 1998 1999 2000 2001 2002 2003 2004 2005 2006
HBC 0 10 20 30 40 50 1
997 1998 1999 2000 2001 2002 2003 2004 2005 2006
M e a n num be r pe r s hot HBD 0 10 20 30 40 50
1997 1998 1999 2000 2001 2002 2003 2004 2005 2006
T30 0 4 8 12 16 20
1997 1998 1999 2000 2001 2002 2003 2004 2005 2006
Males Females
Year
Figure 6. Mean number of blue swimmer crabs per shot, by sex, grid and year. Note: HBC and HBD are graphed at a different scale. Grids only surveyed in Phase 1 of the survey are not shown.
Moreton Bay bug (Thenus orientalis)
From 1998 to 2000 the numbers of bugs collected annually remained similar and decreased in 2001 with a reduction in survey sites. The catch of Moreton Bay bugs during the survey has been relatively constant since 2001 with an increase in numbers caught seen in 2006 (Table 4).
Table 4. Total numbers of Moreton Bay bugs captured by survey year (Note: survey reduced in area from 2001 onwards).
Year Total no. caught
1998 1832 1999 1813 2000 2050 2001 932 2002 1109 2003 1202 2004 1067 2005 1074 2006 1408
Length frequency
BHA M = 185
F = 196
0 10 20 30 40 50 60 70 20 -29 30 -39 40 -49 50 -59 60 -69 70 -79 80 -89 90 -99 10 0-1 09 11 0-1 19 BHB M = 184 F = 177
0 10 20 30 40 50 60 70 20 -29 30 -39 40 -49 50 -59 60 -69 70 -79 80 -89 90 -99 10 0-1 09 11 0-1 19 BHC M = 342
F = 205
0 10 20 30 40 50 60 70 20 -29 30 -39 40 -49 50 -59 60 -69 70 -79 80 -89 90 -99 10 0-10 9 11 0-11 9 BHD M = 100
F = 172
0 10 20 30 40 50 60 70 20 -29 30 -39 40 -49 50 -59 60 -69 70 -79 80 -89 90 -99 10 0-10 9 11 0-11 9 Females Males YA
M = 130 F = 135
0 10 20 30 40 50 60 70 20 -29 30 -39 40 -49 50 -59 60 -69 70 -79 80 -89 90 -99 10 0-1 09 11 0-1 19 YB M = 100
F = 292
0 10 20 30 40 50 60 70 20 -29 30 -39 40 -49 50 -59 60 -69 70 -79 80 -89 90 -99 10 0-1 09 11 0-1 19 Fr e que nc y ( % )
Carapace length (mm)
Figure 7. Moreton Bay bug length frequency by sex, and grid for all years combined. Note: Grids only surveyed in Phase 1 of the survey are not shown.
HBA M= 100 F = 238
0 10 20 30 40 50 60 70 20-29 30-39 40-49 50-59 60-69 70-79 80-89 90-99 10 0-109 11 0-119 HBB M = 213
F = 149
0 10 20 30 40 50 60 70 20-29 30-39 40-49 50-59 60-69 70-79 80-89 90-99 10 0-109 11 0-119 HBC M = 100
F = 239
0 10 20 30 40 50 60 70 20-29 30-39 40-49 50-59 60-69 70-79 80-89 90-99 10 0-1 09 11 0-1 19 HBD M = 100
F = 116
0 10 20 30 40 50 60 70 20-29 30-39 40-49 50-59 60-69 70-79 80-89 90-99 1 00-109 1 10-119 Fr e que nc y ( % ) T30 M = 1221 F = 1533
0 10 20 30 40 50 60 70 20 -29 30 -39 40 -49 50 -59 60 -69 70 -79 80 -89 90 -99 100 -10 9 110 -11 9 Females Males
Carapace length (mm)
Catch rate
Mean numbers of Moreton Bay bugs per shot (from all nets) are unstandardised. Catch rates of males and females were approximately equal. The highest average catch rate over all years was within BHC, however, the highest annual catch rate recoded occurred in HBD, in 2000 (Figure 8).
YB 0 2 4 6 8 10 12 19 98 19 99 20 00 20 01 20 02 20 03 20 04 20 05 20 06 YA 0 2 4 6 8 10 12 199 8 199 9 200 0 200 1 200 2 200 3 200 4 200 5 200 6 BHA 0 2 4 6 8 10 12 19 98 19 99 20 00 20 01 20 02 20 03 20 04 20 05 20 06 BHB 0 2 4 6 8 10 12 1
998 1999 2000 2001 0022 2003 2004 2005 2006
BHC 0 2 4 6 8 10 12 199 8 199 9 200 0 200 1 200 2 200 3 200 4 200 5 200 6 HBA 0 2 4 6 8 10 12 19 98 19 99 20 00 20 01 20 02 20 03 20 04 20 05 20 06 HBB 0 2 4 6 8 10 12 19 98 19 99 20 00 20 01 20 02 20 03 20 04 20 05 20 06 M e a n nu m be r pe r s hot HBD 0 2 4 6 8 10 12 14 16 18 199 8 199 9 200 0 200 1 200 2 200 3 200 4 200 5 200 6 Year BHD 0 2 4 6 8 10 12 199 8 199 9 200 0 200 1 200 2 200 3 200 4 200 5 200 6 HBC 0 2 4 6 8 10 12 19 98 19 99 20 00 20 01 20 02 20 03 20 04 20 05 20 06 T30 0 2 4 6 8 10 12 19 98 19 99 20 00 20 01 20 02 20 03 20 04 20 05 20 06 Males Females
Figure 8. Moreton Bay bug mean number per shot, by sex, grid and year. Note: HBD is graphed at a different scale. Grids only surveyed in Phase 1 of the survey are not shown.
Syngnathids
Since 2000, syngnathids (pipehorses, pipefish and seahorses) caught during the survey were recorded. Low numbers were caught in each survey year therefore results have been pooled and are presented as Yeppoon, Bustard Head, T30 (Table 5). No syngnathids were caught in Hervey Bay SRAs. The number of syngnathids caught has been variable over the survey duration with a noticeable peak in 2003.
The majority of syngnathids were caught in the Bustard Head region and at either 30 or 31 m depth. All except one individual (caught at 19 m) were caught at depths between 27 to 50 m depth. The pipehorse species collected in these surveys was identified as Solegnathus hardwickii.
Table 5. Numbers of syngnathids caught per year. Survey area and effort was reduced from 2001 onwards (Note: an additional 24 syngnathids were caught in 2000 in grids only surveyed in Phase 1 of sampling).
Year Yeppoon Bustard
Head T30 Total
2000 0 2 7 9
2001 2 12 2 16 2002 2 32 19 53 2003 1 63 19 83 2004 2 24 20 46 2005 0 12 8 20 2006 1 14 9 24
Sea snakes
Recording of incidental catches of sea snakes was incorporated in the survey from 2000. Total numbers caught for each year were low, therefore results have been pooled and are presented as Yeppoon, Bustard Head and Hervey Bay and T30 (Table 6). Numbers caught have been relatively constant, except for an increased in captures during 2005.
Sea snakes were caught between 12 m and 60 m in depth, with a mean depth of 32 m.
Table 6. Numbers of sea snakes per year per region (Note: an additional 61 sea snakes were caught in 2000 in grids only surveyed in Phase 1 of sampling).
Year Yeppoon Bustard
Head
Hervey
Bay T30 Total
2000 1 1 3 22 27
2001 1 9 1 8 19
26 Fisheries Long Term Monitoring Program, Summary of scallop (Amusium japonicum balloti) survey results: (1997-2006)
References
Barker, J., O’ Sullivan, S., Jebreen, E.J, Roy, D., and Kennedy, C. (2004). Fisheries Long-Term Monitoring Program, Benthic Marine Fauna Composition of the Scallop Fishery Area in 2000 and 2002. Department of Primary Industries and Fisheries, Brisbane, Australia.
Courtney, A.J., Tonks, M., Roy, D., Haddy, J., Jebreen, E., and Campbell, M. (2003). Exploring associations between pipehorse (Solegnathus cf. hardwickii) abundance and bycatch faunal communities in the Queensland trawl fishery. In ‘Incidental pipefish harvest from the
Queensland East Coast Trawl Fishery’ (Eds M. Dunning, C. Bullock, J. Bibby, A.J. Courtney) (Report to Environment Australia, April 2003.)
DPI&F (2005). Fisheries Long Term Monitoring Program Sampling Protocol – Scallop: (1997 onwards). Department of Primary Industries and Fisheries, Brisbane, Australia.
DPI&F (In Prep.) Long Term Monitoring Program: Data Protocol. Department of Primary Industries and Fisheries, Brisbane, Australia.
Fisheries (East Coast Trawl) Management Plan 1999. Subordinate legislation of the Fisheries Act 1994, www.legislation.qld.gov.au, Office of the Queensland Parliamentary Council. Fisheries Regulation 1995. Subordinate legislation of the Fisheries Act 1994,
www.legislation.qld.gov.au, Office of the Queensland Parliamentary Council.
Jebreen, E.J., Yeomans, K., Dredge, M., McGilvray, J., Smallwood, D., Bullock, C.L., Tonks, M., and Dichmont, C. (2003). Fisheries Long Term Monitoring Program Scallop Report 1997-2000. Abundance estimates and an evaluation of permanent scallop replenishment areas for the saucer scallop (Amusium japonicum balloti). Department of Primary Industries and Fisheries,
Brisbane, Australia.
Kailola, P.J., Williams, M.J., Stewart, P.C., Reichelt., R.E., McNee, A., and Grieve, C. (1993). ‘Australian Fisheries Resource’ (Bureau of Resource Sciences, Department of Primary Industries and Energy, and the Fisheries Research and Development Corporation: Canberra, Australia).